Naters-Top (Irrigated)
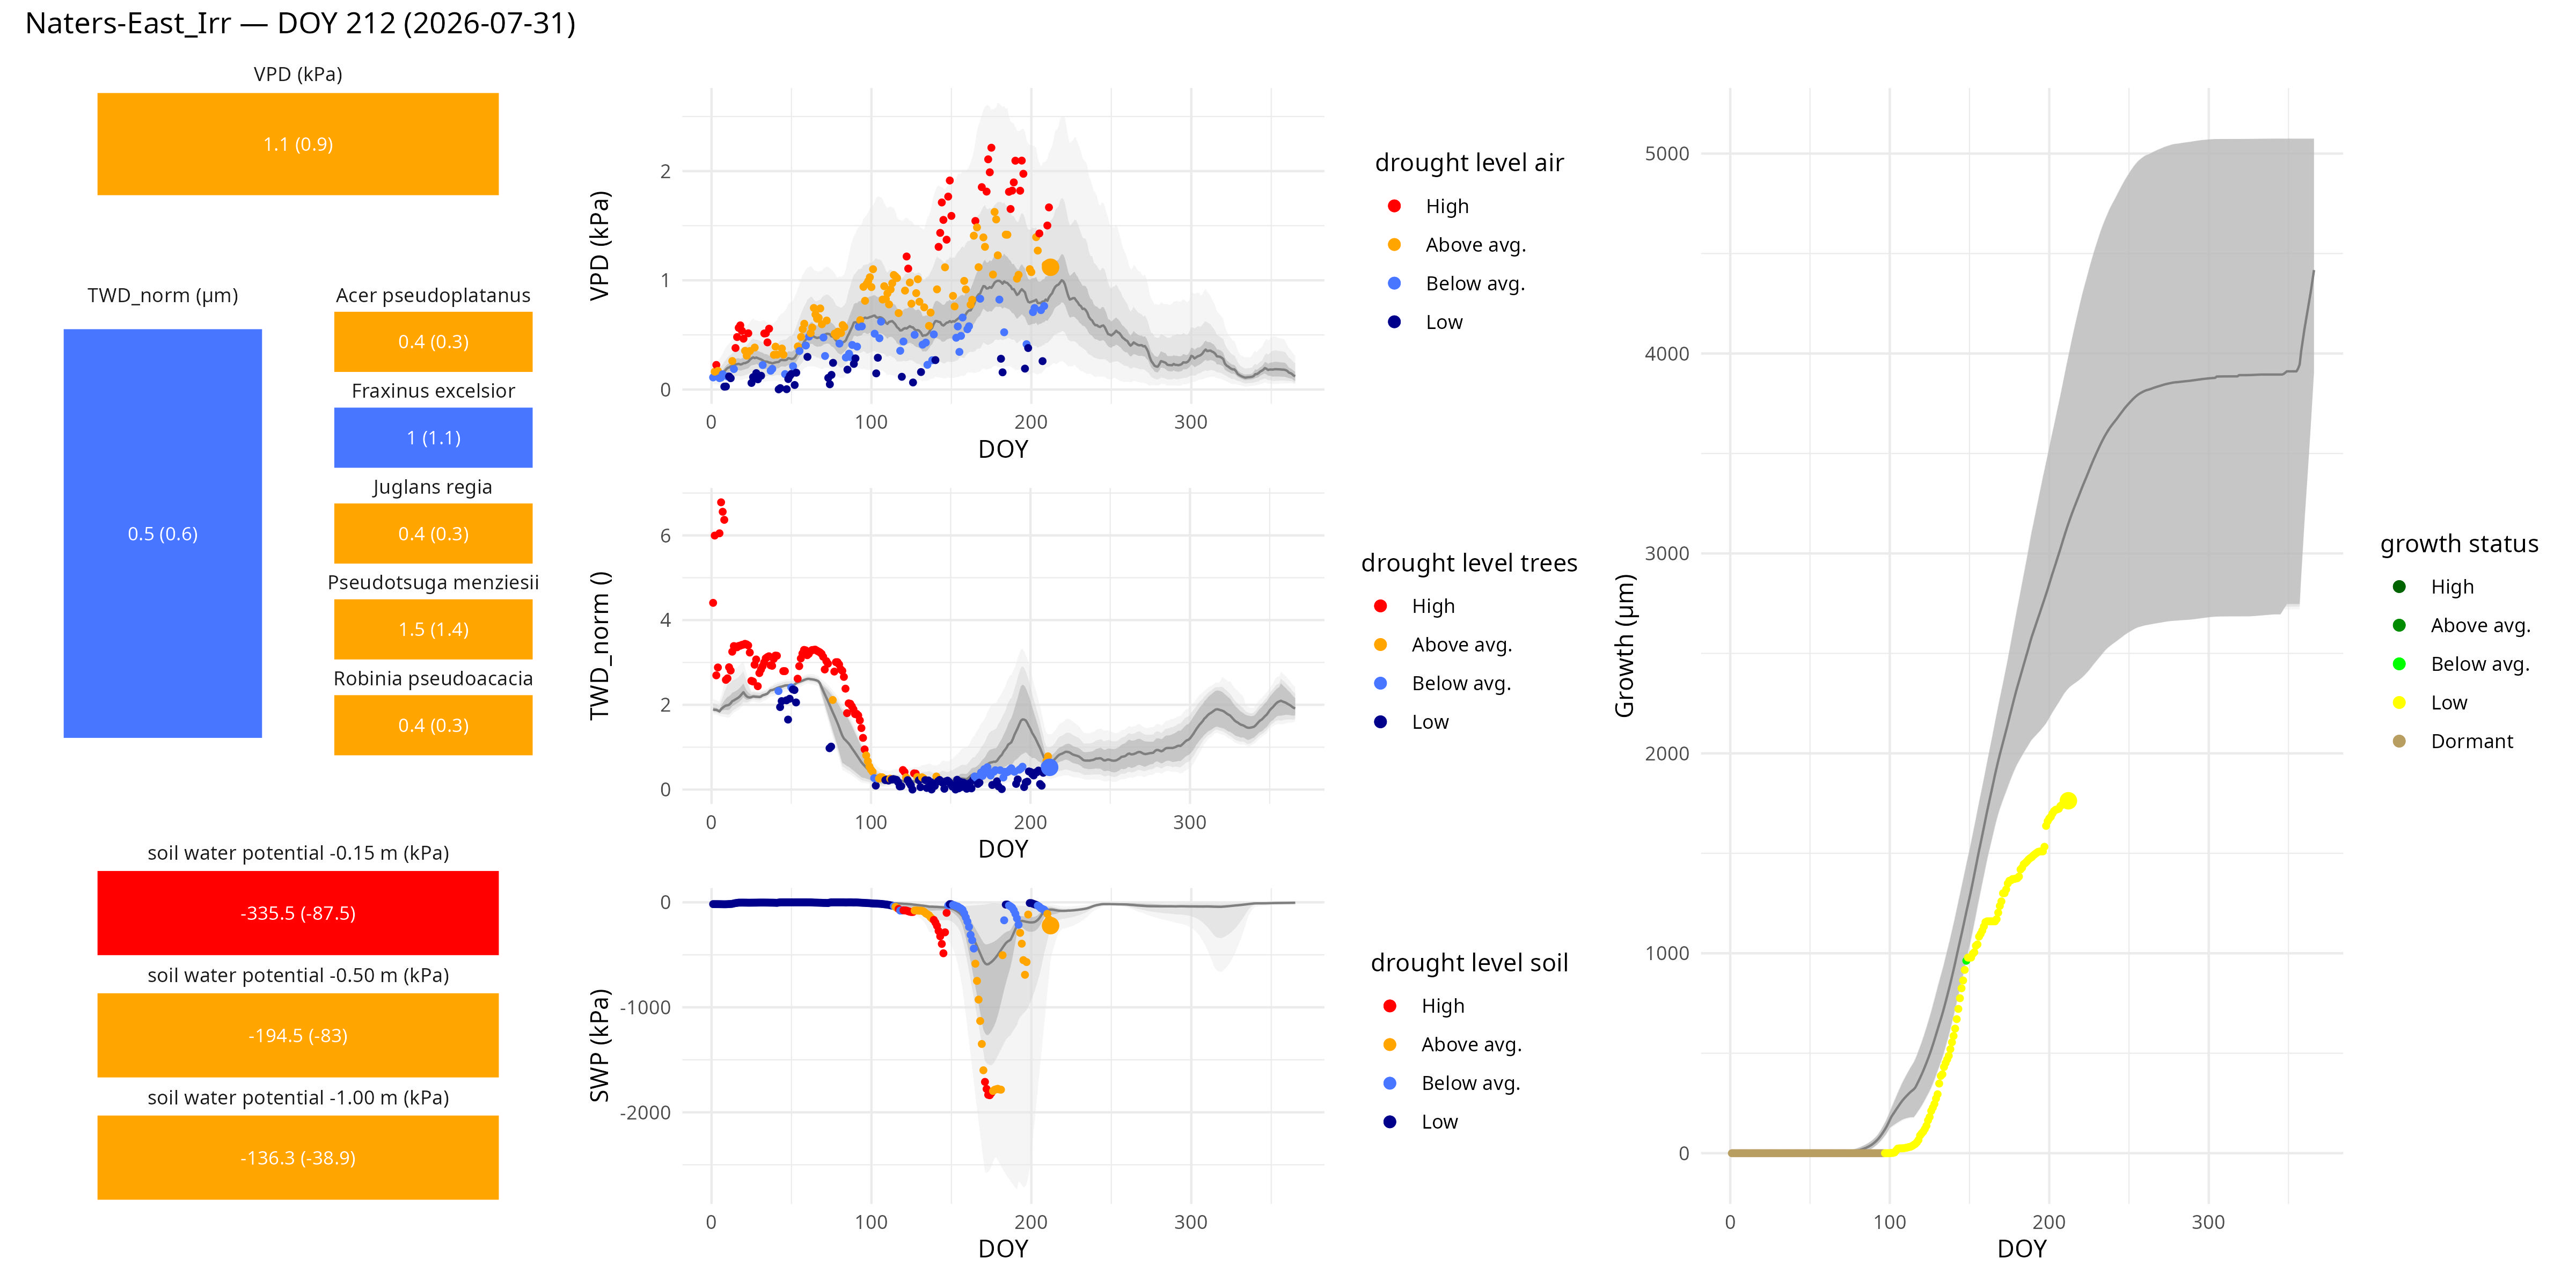
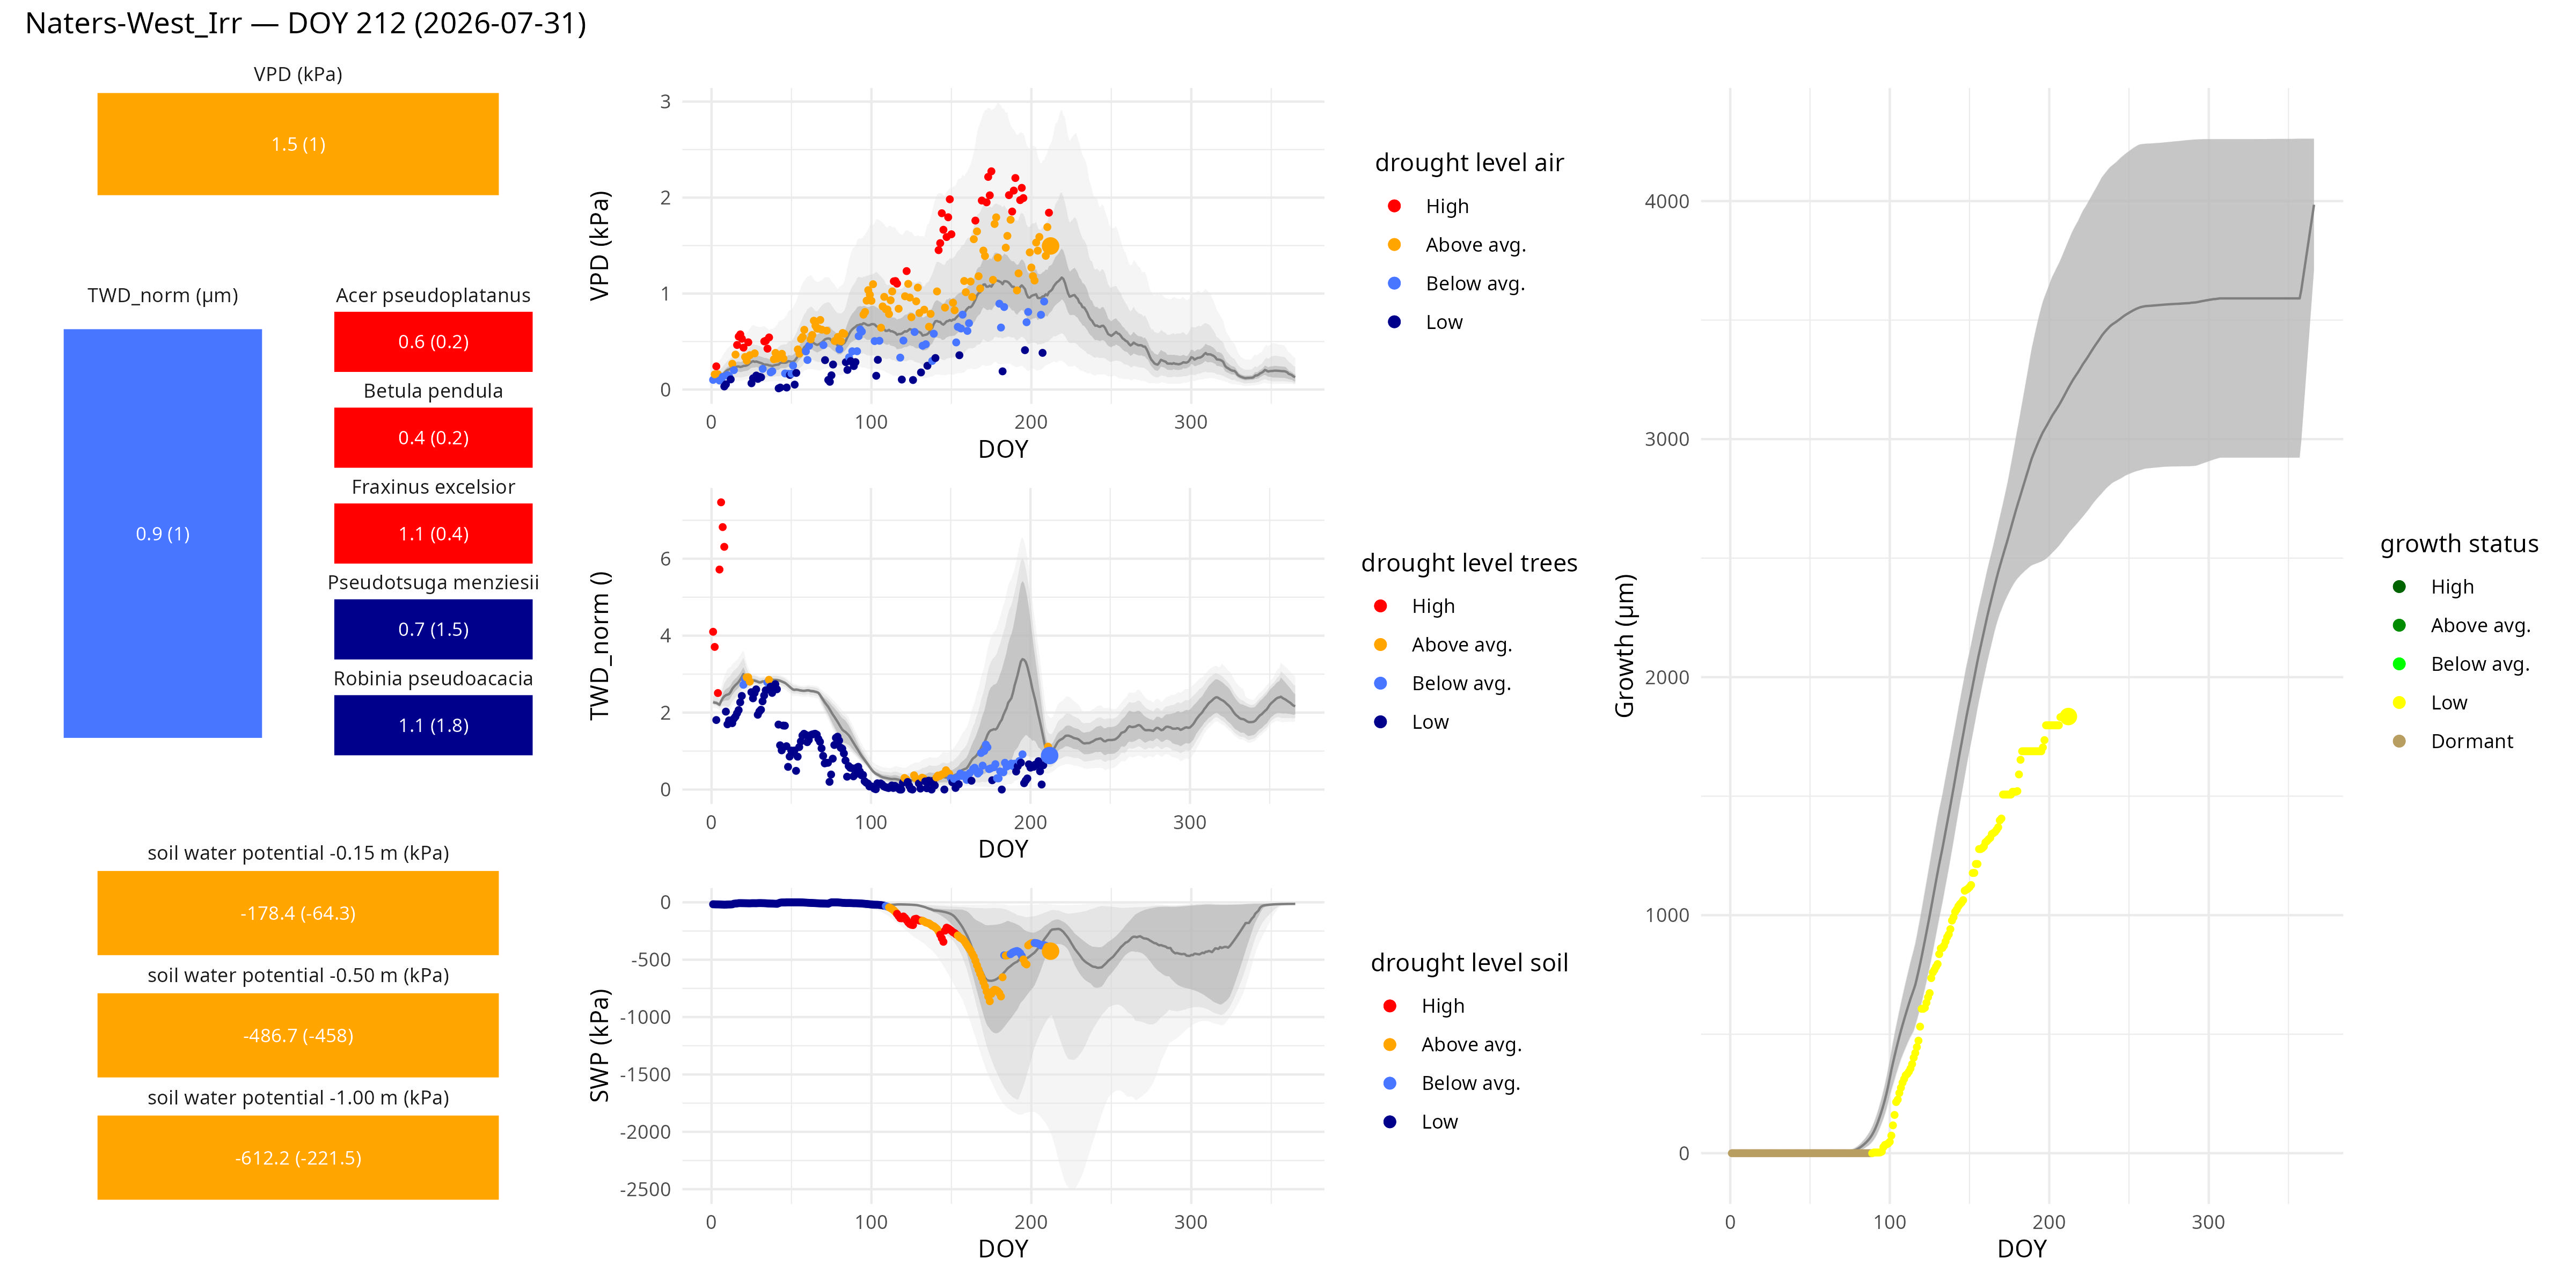
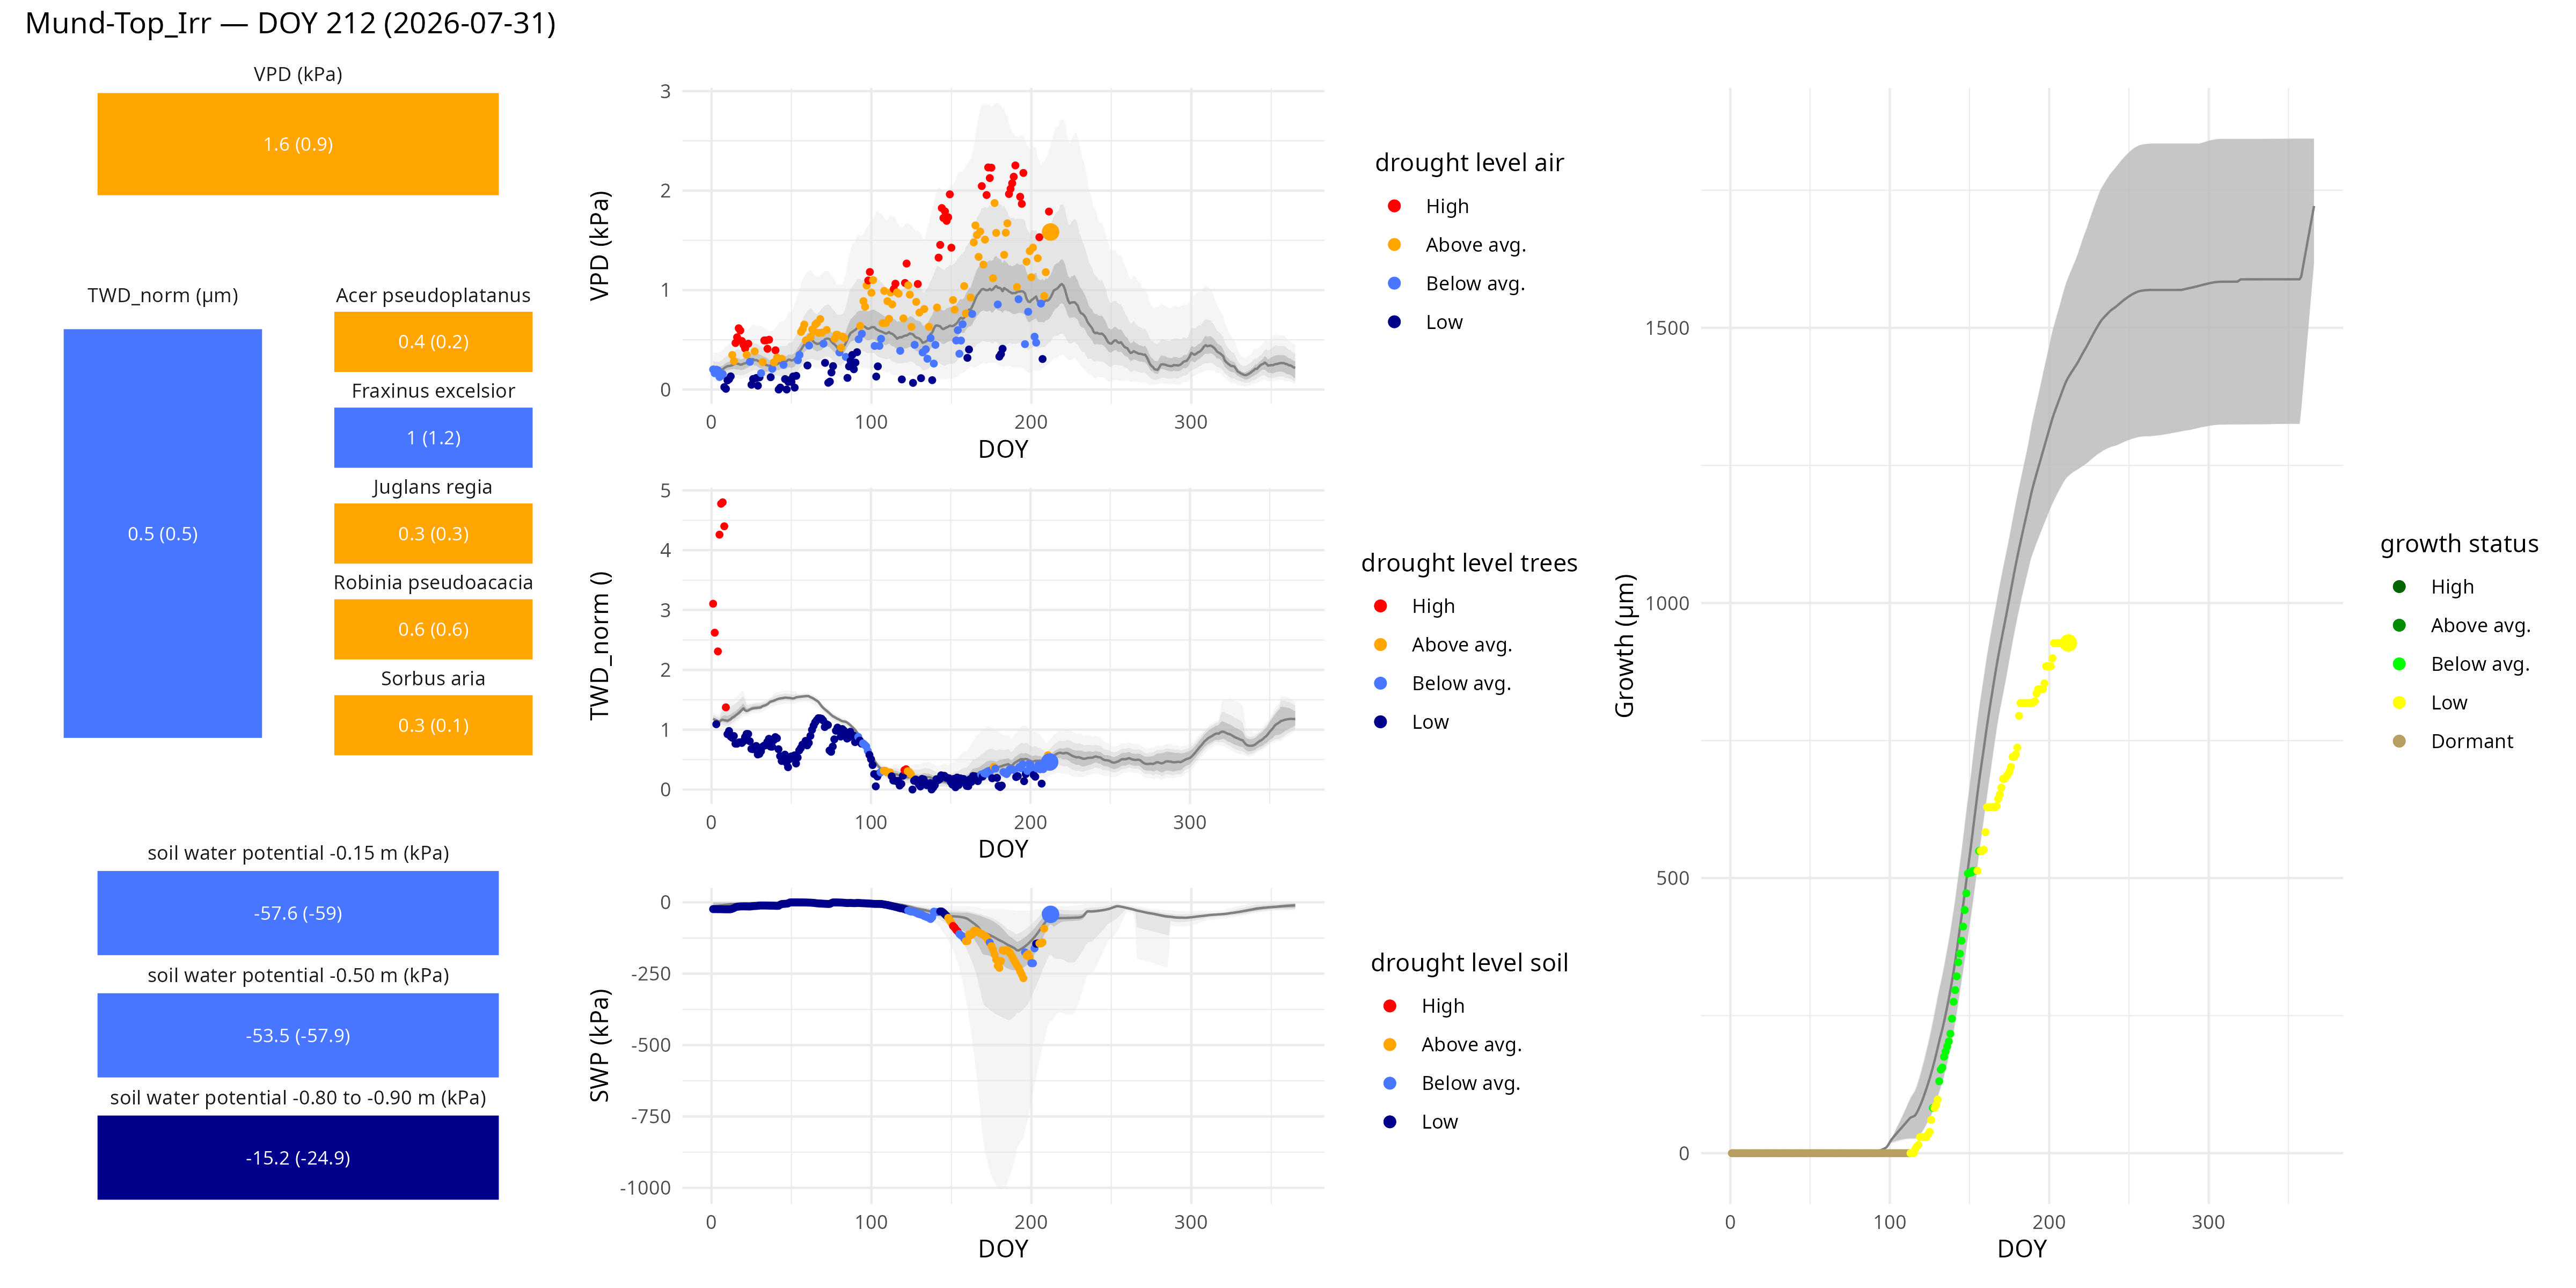
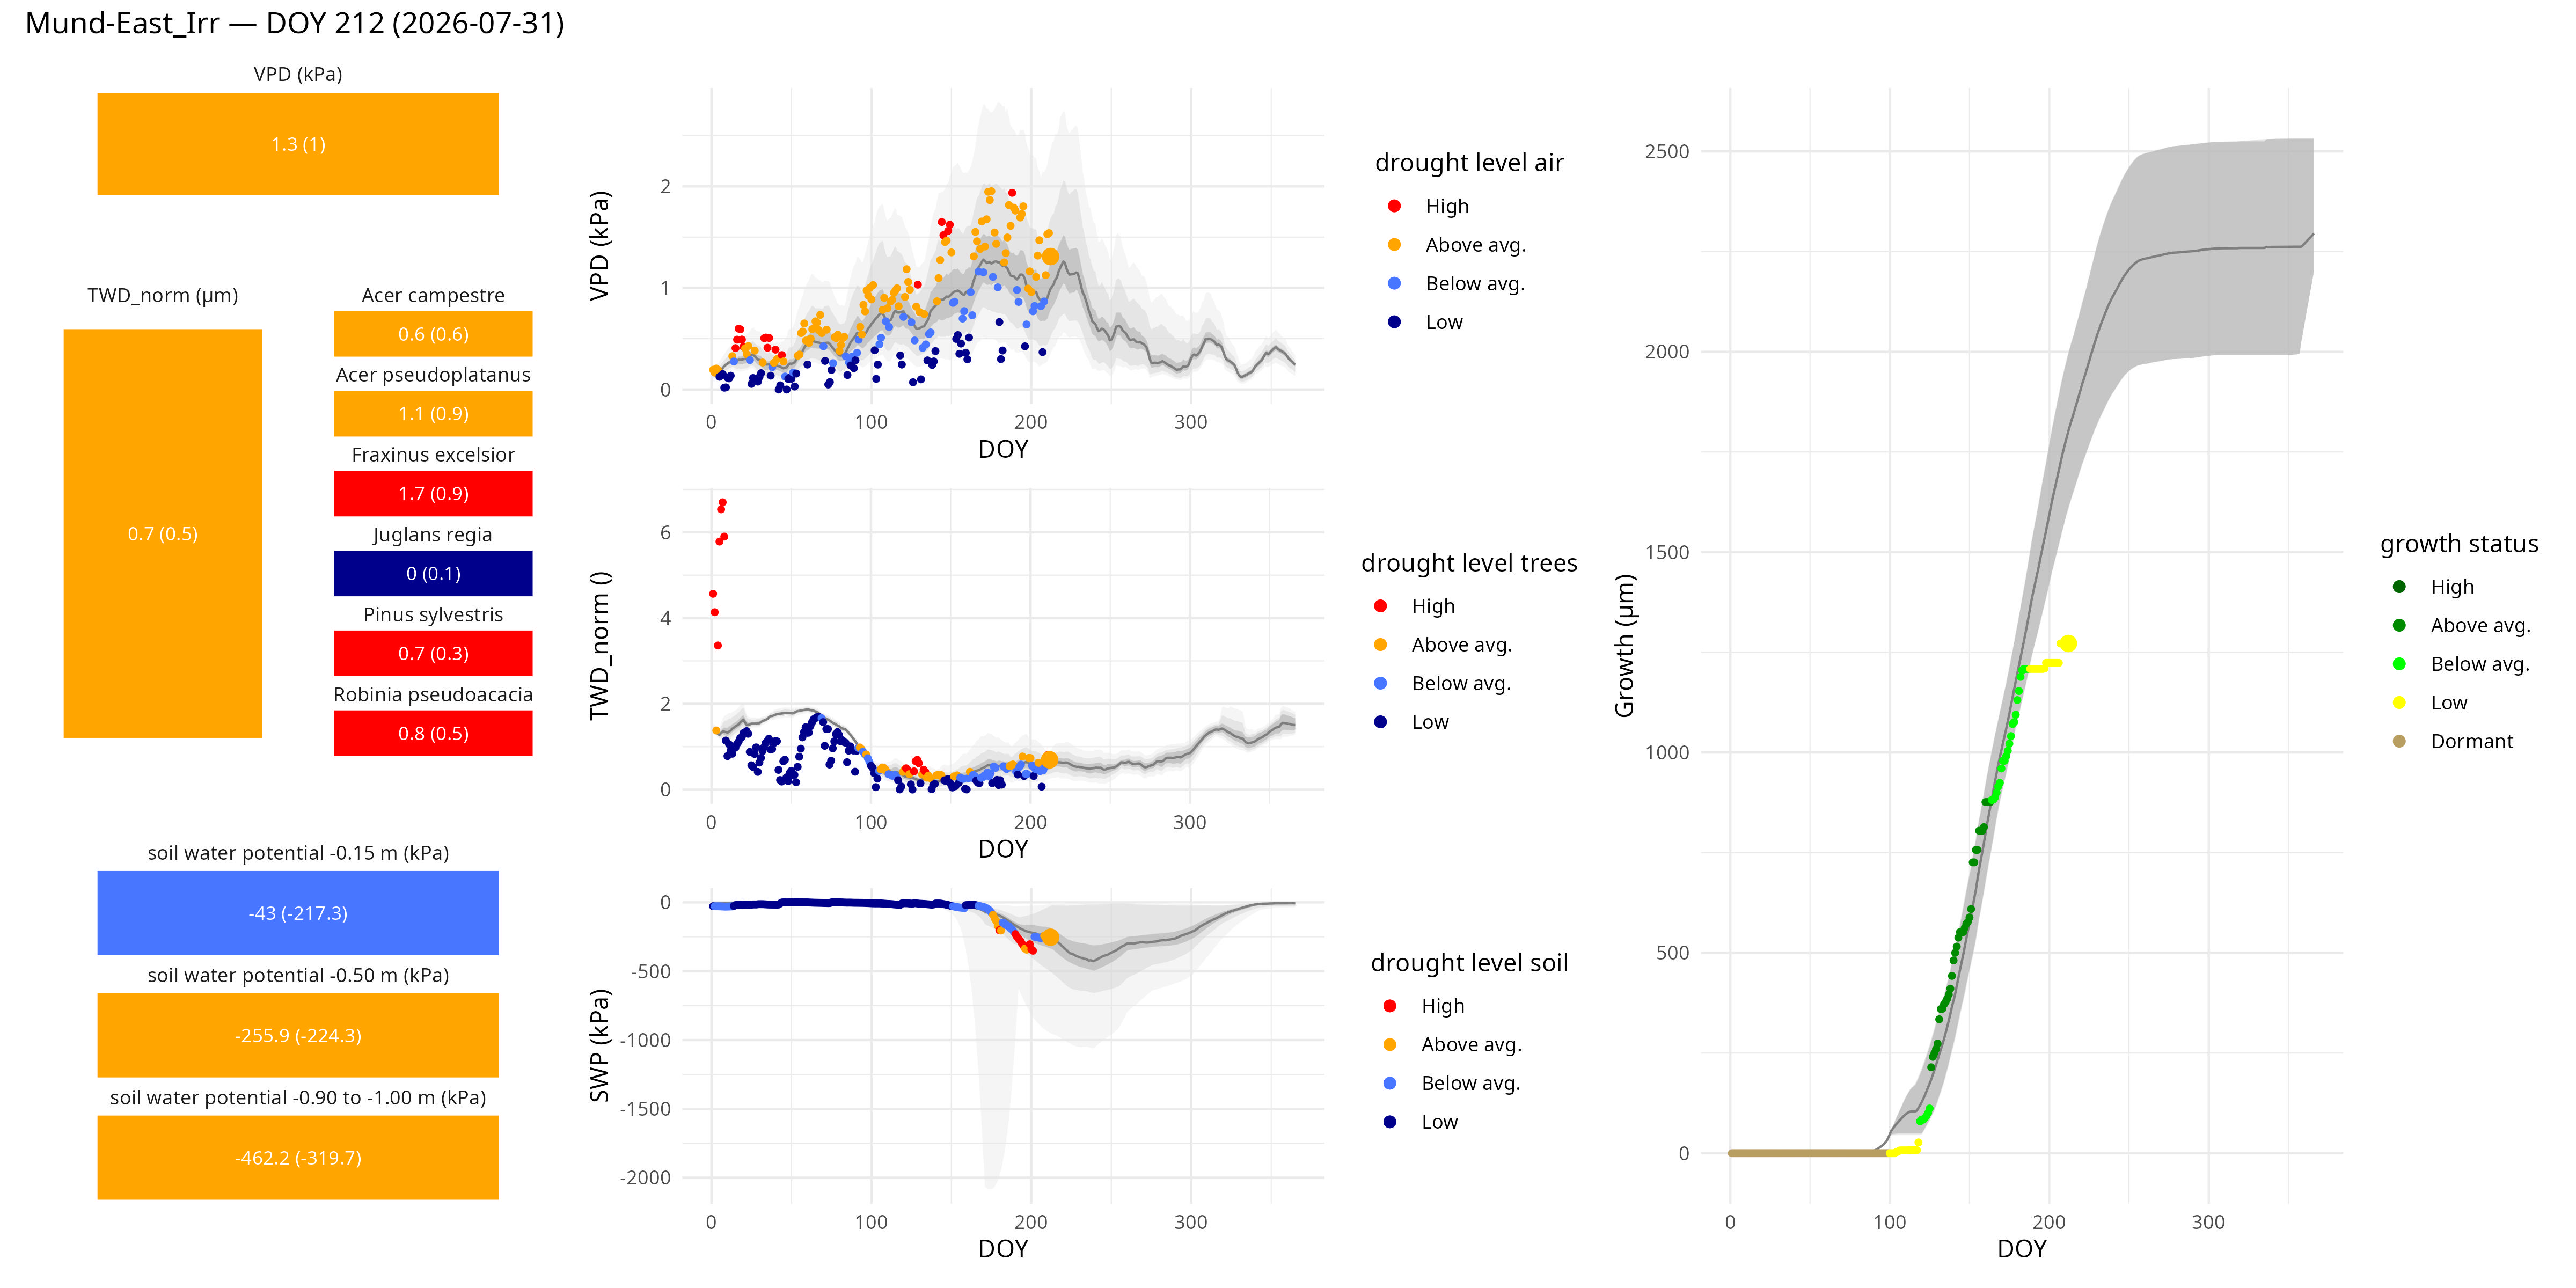
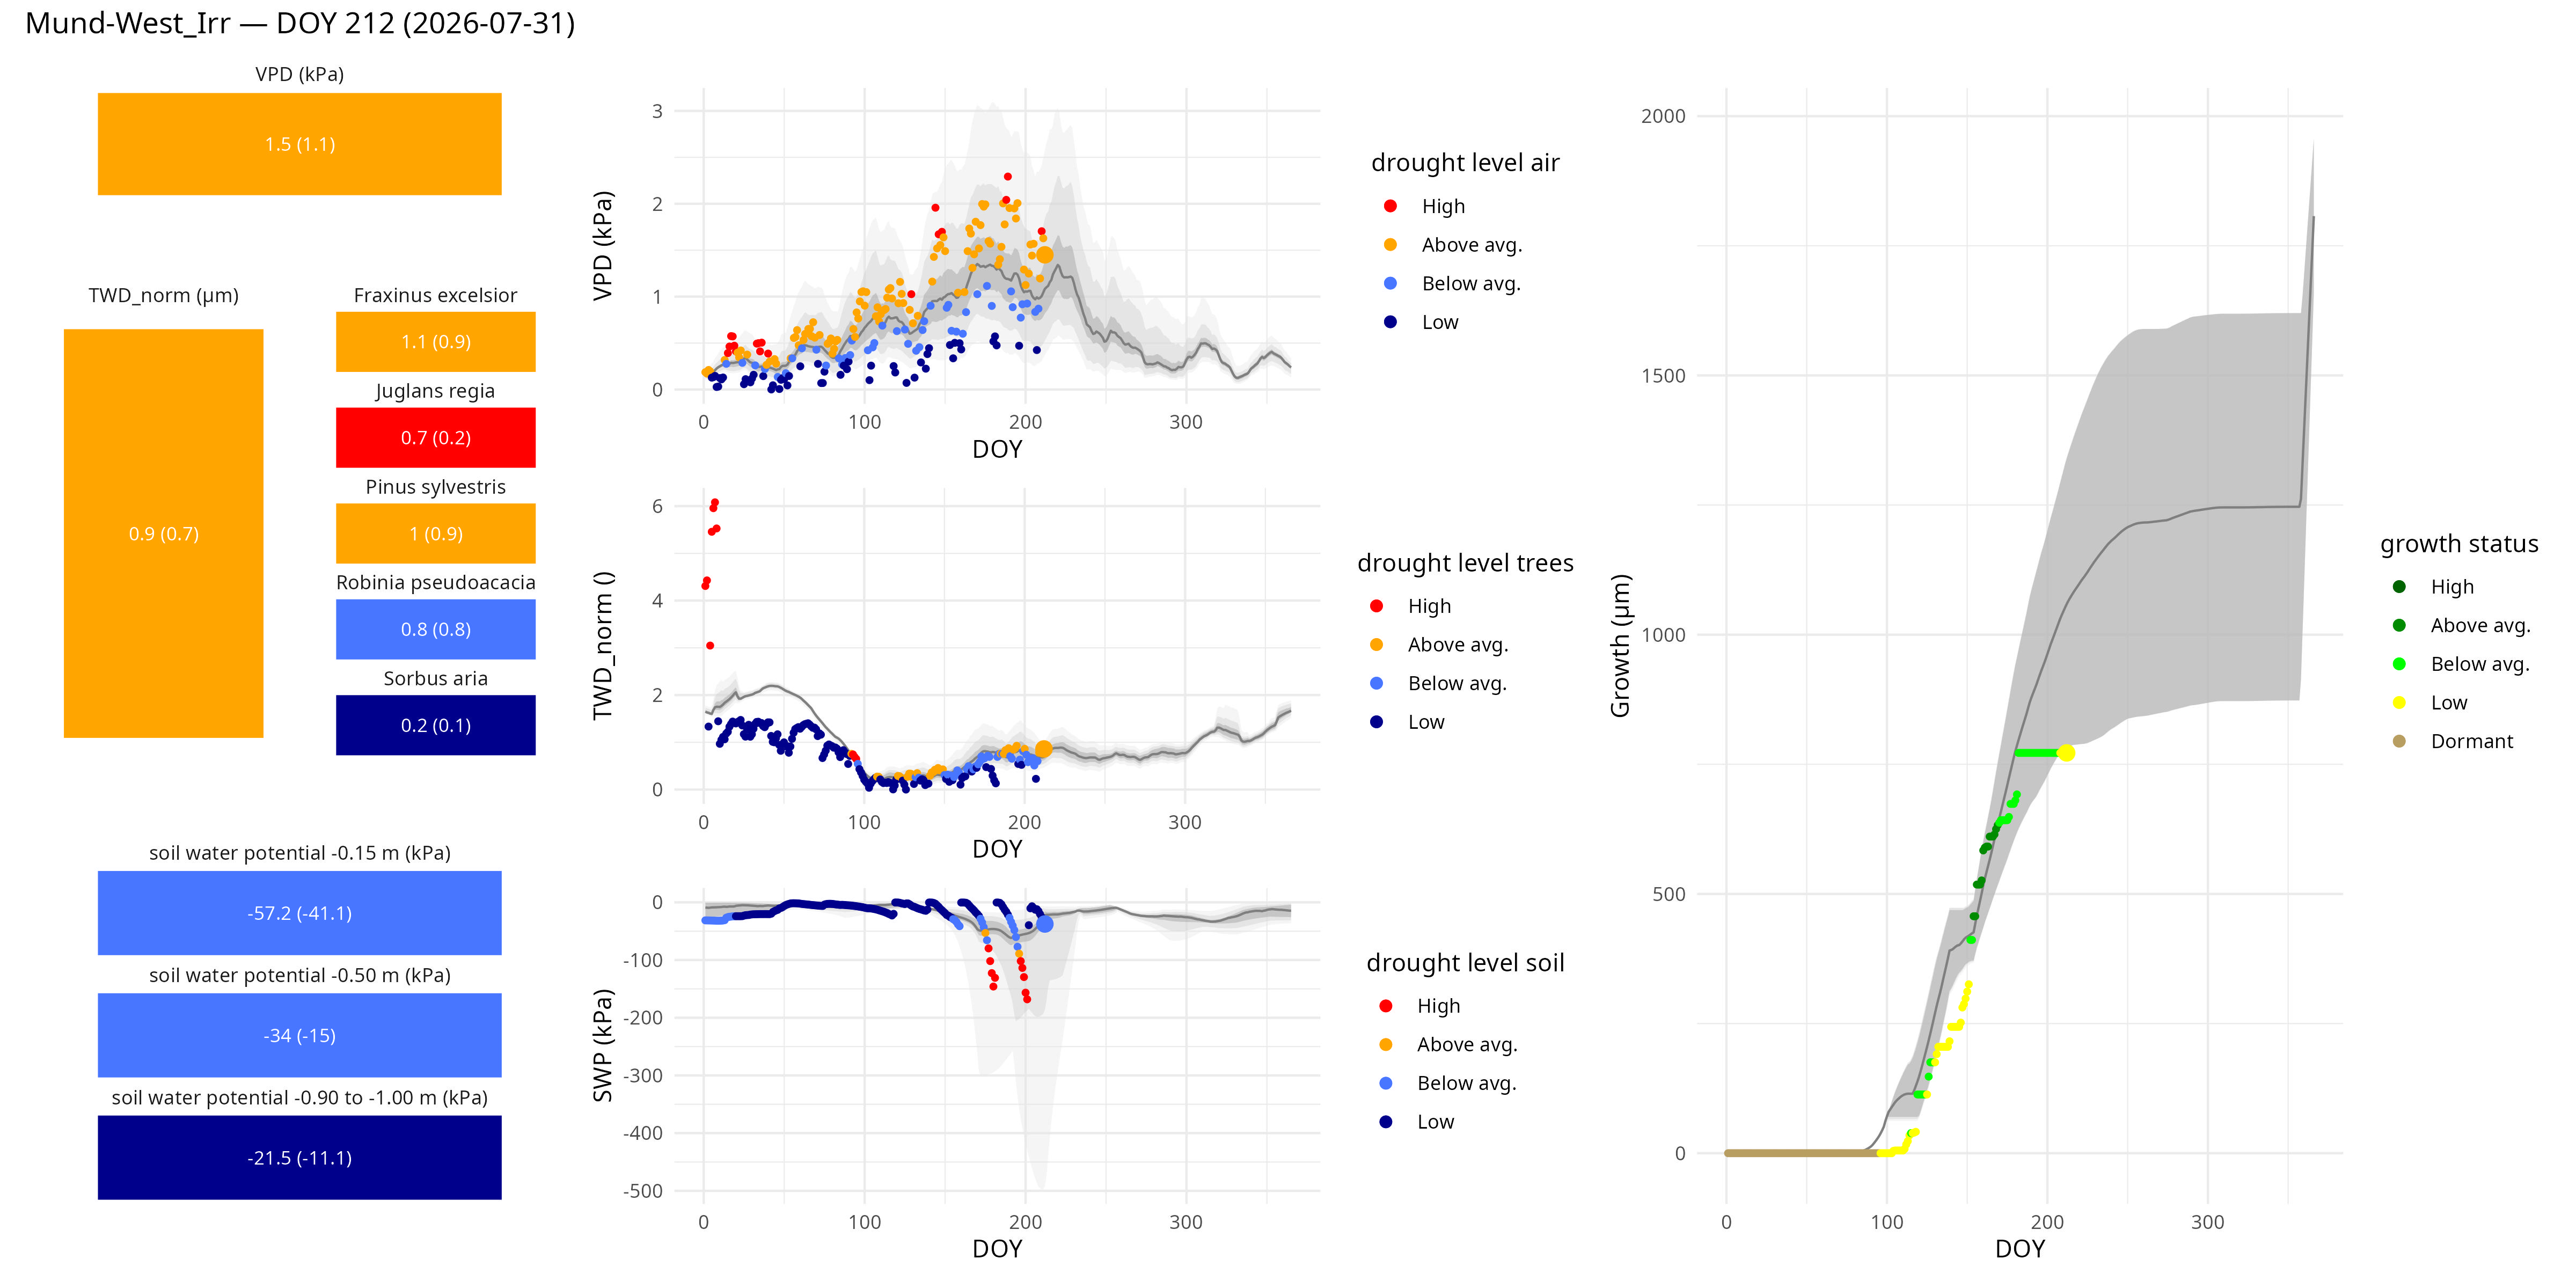
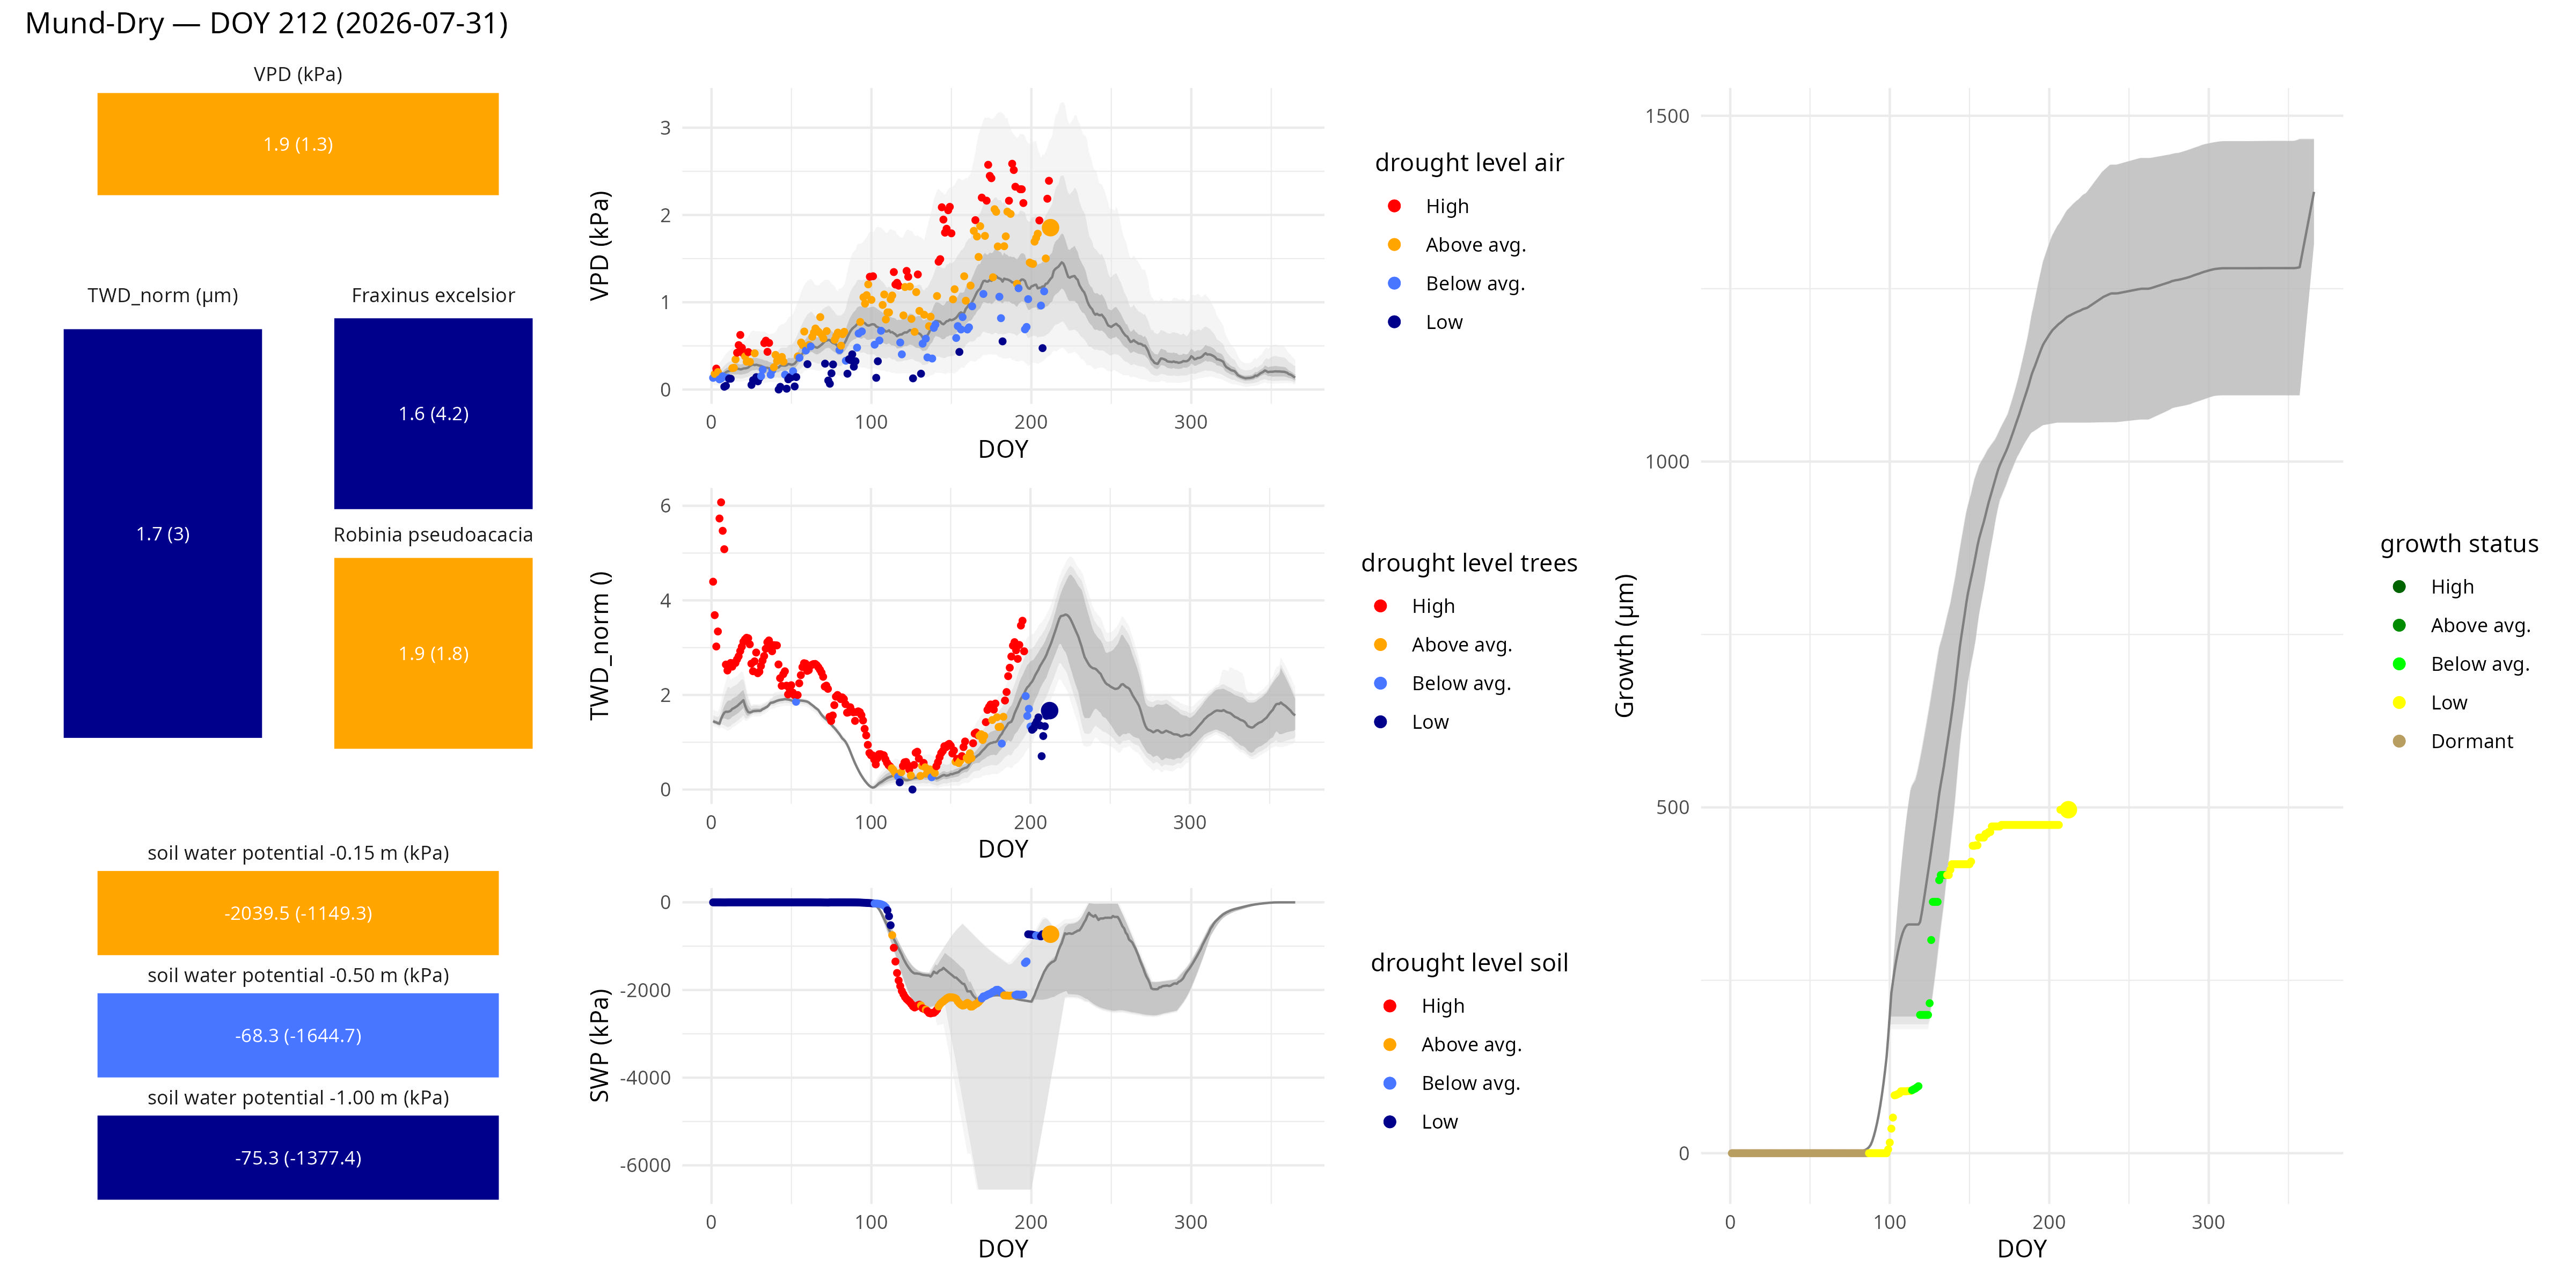
Left (stacks): Drought signals per site are displayed for up to three soil layers (bottom), for all trees pooled and for each species pooled per site (middle), and for the air (top). The colors indicate the intensity of drought stress on the current day compared to historical data, ranging from dark blue (no drought stress) to red (high drought stress). The numbers indicate the measured values in the respective unit.
Middle (time series): Seasonal progression of average soil water potential SWP (bottom), average tree water deficit TWD_norm (middle), and vapor pressure deficit VPD (top). Color coding as for the stacks.
Right (time series): Seasonal progression of average cumulative stem growth of the site. The color coding ranges from yellow (no/low growth) to dark green (high growth) and indicates the relative growth performance compared to historical data.
Data source: TreeNet, automatic data analysis with filtered data set.