Environmental Signals

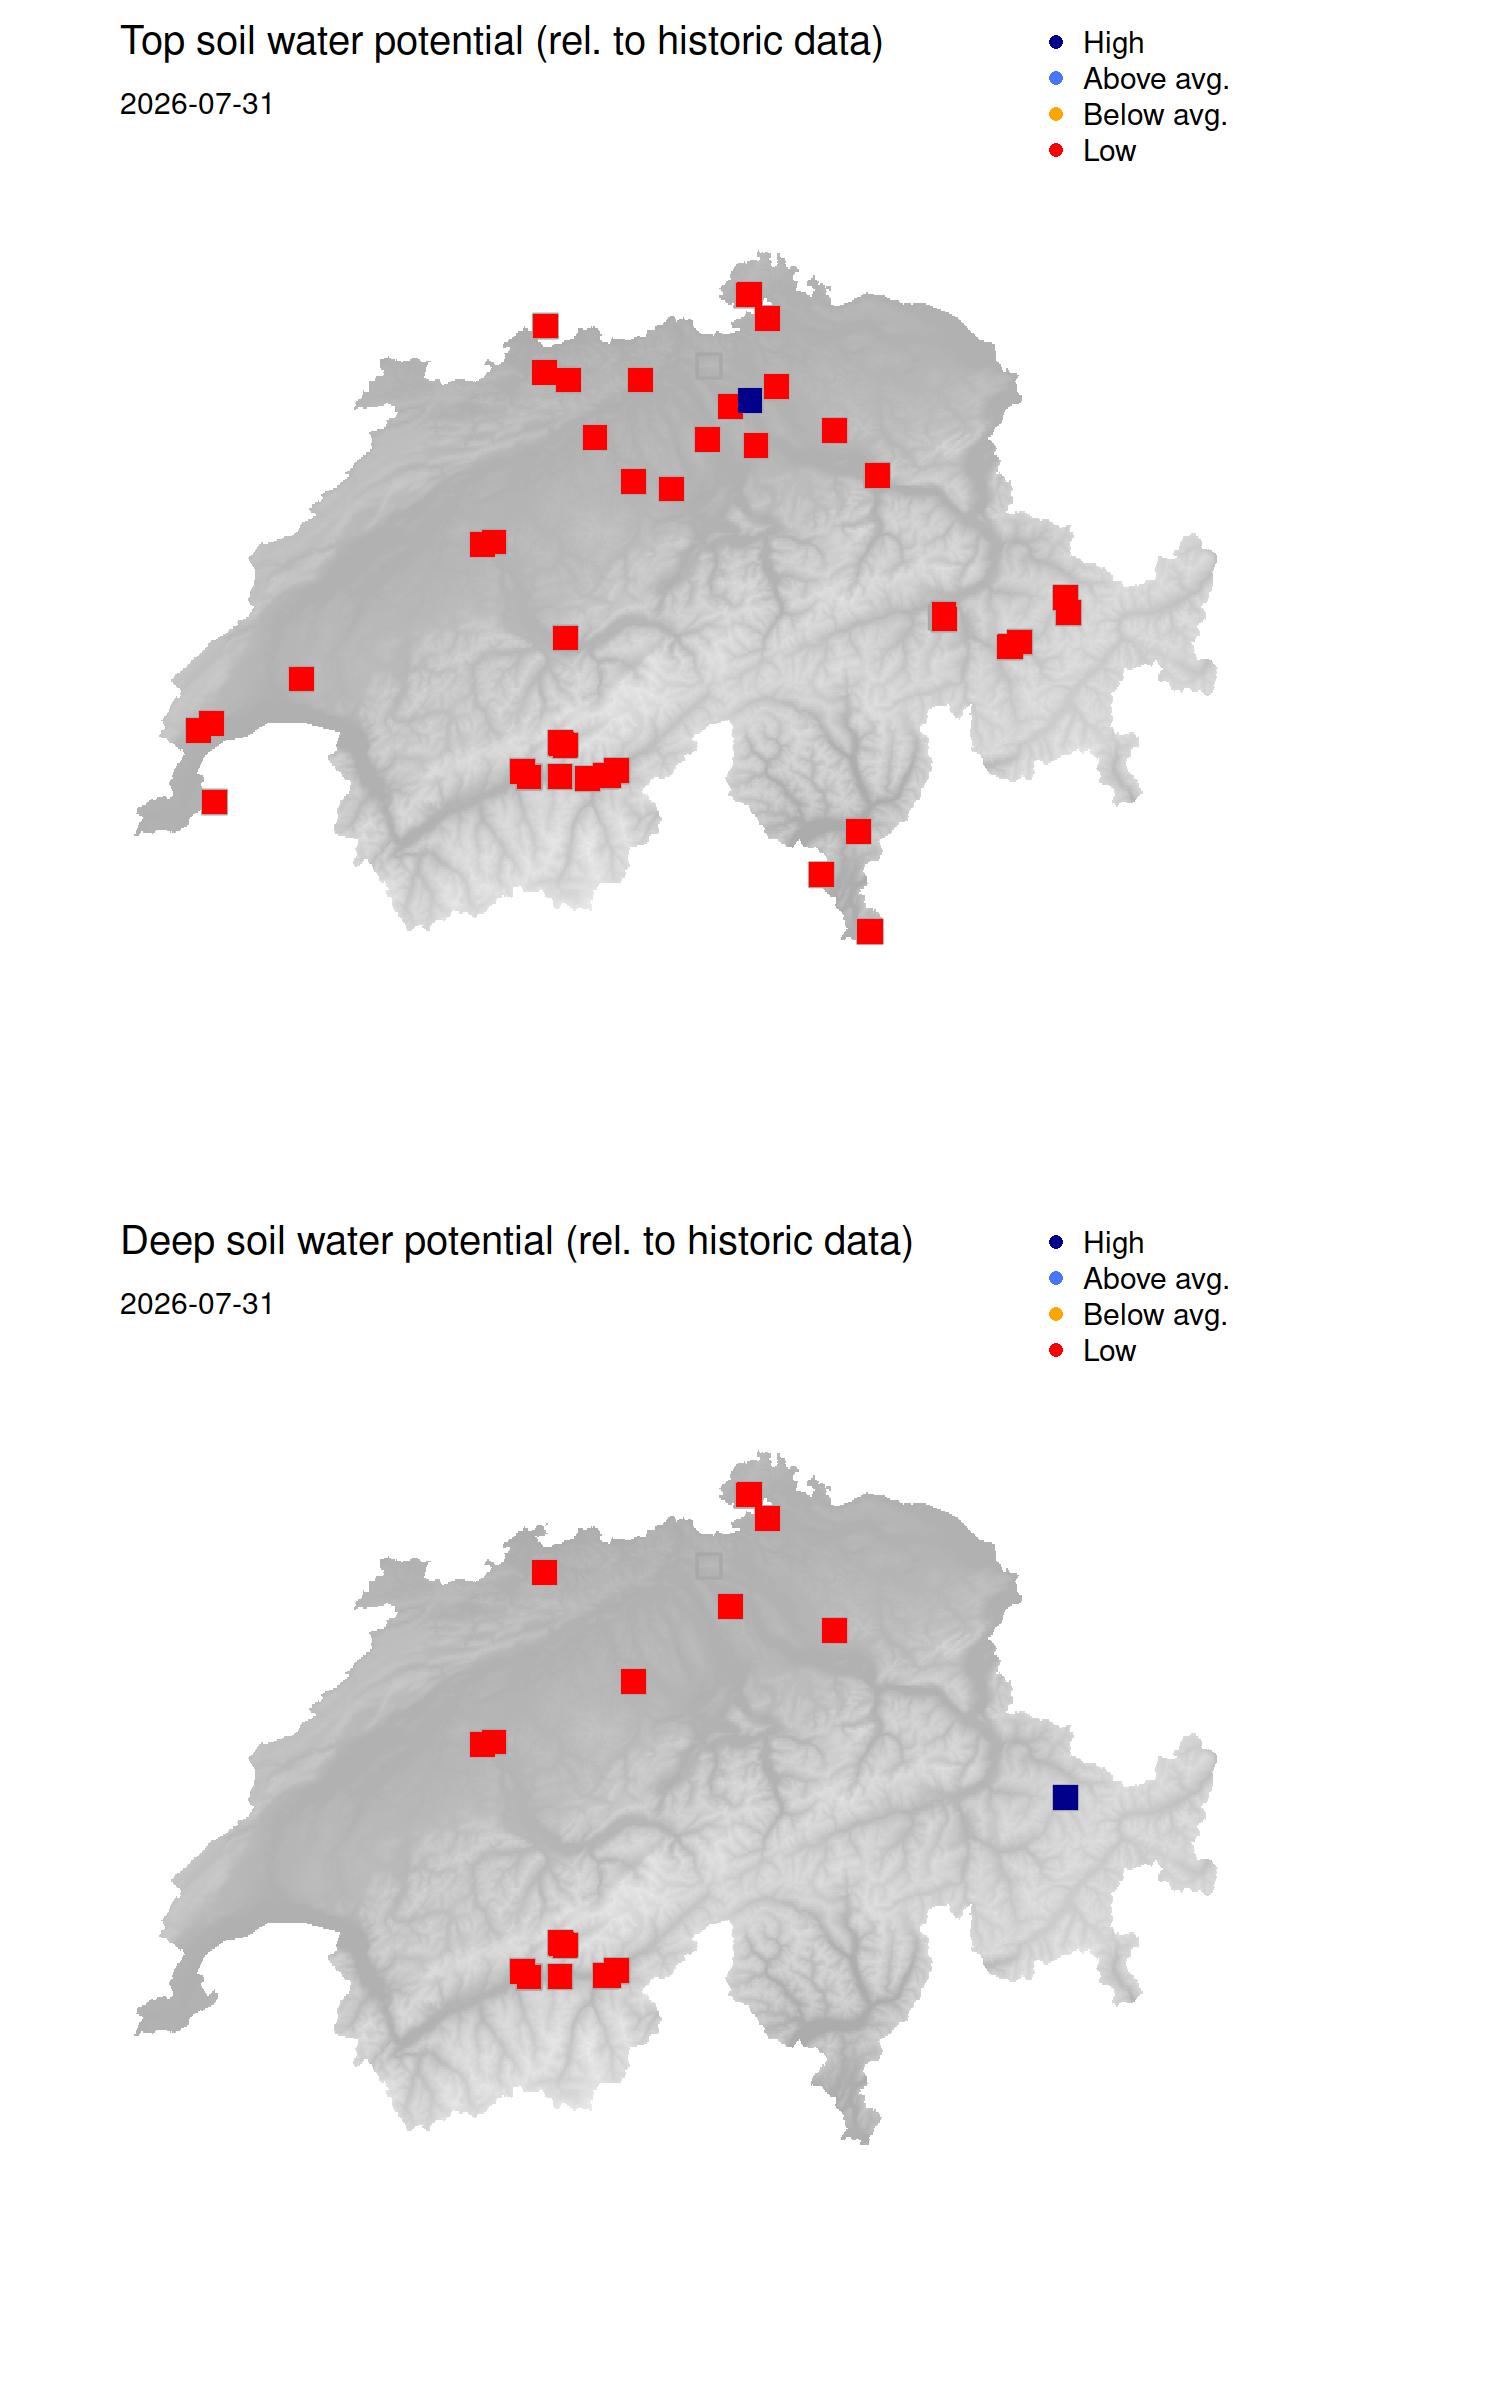
Soil water availability

The upper map shows the actual soil water availability in the top layer relative to the average, historic data (2011-past year) of a site. Soil water potentials are negative. Accordingly a fully water saturated soil has a value close to zero. The dryer the soil the more negative gets the soil water potential. Data are categorized as ‘high’ soil water availability (dark blue), ‘above average’ (light blue), ‘below average’ (orange), and ‘low’  (red).

The lower map shows the same for deeper soil layers.

Data source: TreeNet, automatic data analysis with filtered data set.

Soil water potentials (kPa) and relative air humidity (%)

The upper map shows the site-specific soil water potential in the top layer in absolute values. Soil water potentials are negative. Accordingly a fully water saturated soil has a value close to zero. The dryer the soil the more negative gets the soil water potential. Data are color-coded from wet (dark blue) to very dry (dark red).

The lower map shows the relative humidity of the air under the canopy in the forest. Data are color-coded from very humid (dark blue) to very dry (dark red).

Data source: TreeNet, automatic data analysis with filtered data set.

Air and soil temperature

The upper map shows the actual air temperature under the canopy in  the forest. Data are categorized from very cold (dark blue) to very hot (dark red).

The lower map shows the temperature of the top soil layer.

Data source: TreeNet, automatic data analysis with filtered data set.

TreeNet Switzerland collects continuous data on stem radius fluctuations measured with point dendrometers from trees all over Switzerland and estimates drought and growth indicators for Swiss forest ecosystems. We closely collaborate with the Long-term Forest Ecosystem Research Programme (LWF/WSL), the ETHZ, the Institute for Applied Plant Biology (IAP), and the University of Basel.