Actual GRO and TWD of individual trees
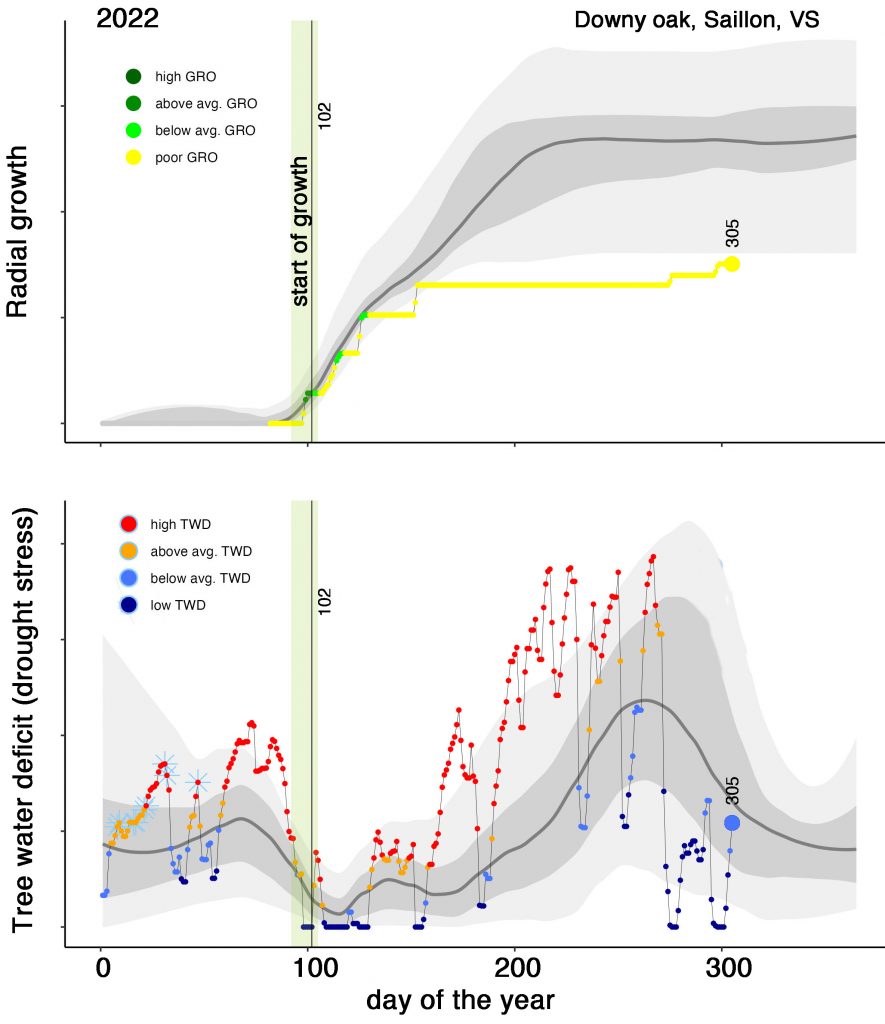
The top panel shows the growth performance in the current year of an individual tree relative to its average performance over its entire measured history.
The lower panel shows the same information as above, but this time for the tree water deficit (TWD).
The light gray area includes a smoothed range of all historical data, the dark gray area includes 50% of the most probable data. The grey line indicates the median of the historical data. The data of the current year are color-coded in relation to their actual performance (high, above avearge, below average, low/poor). A star indicates frost shrinkage of the stem.
Data source: TreeNet, automatic data analysis with filtered data set.