Combined Signals

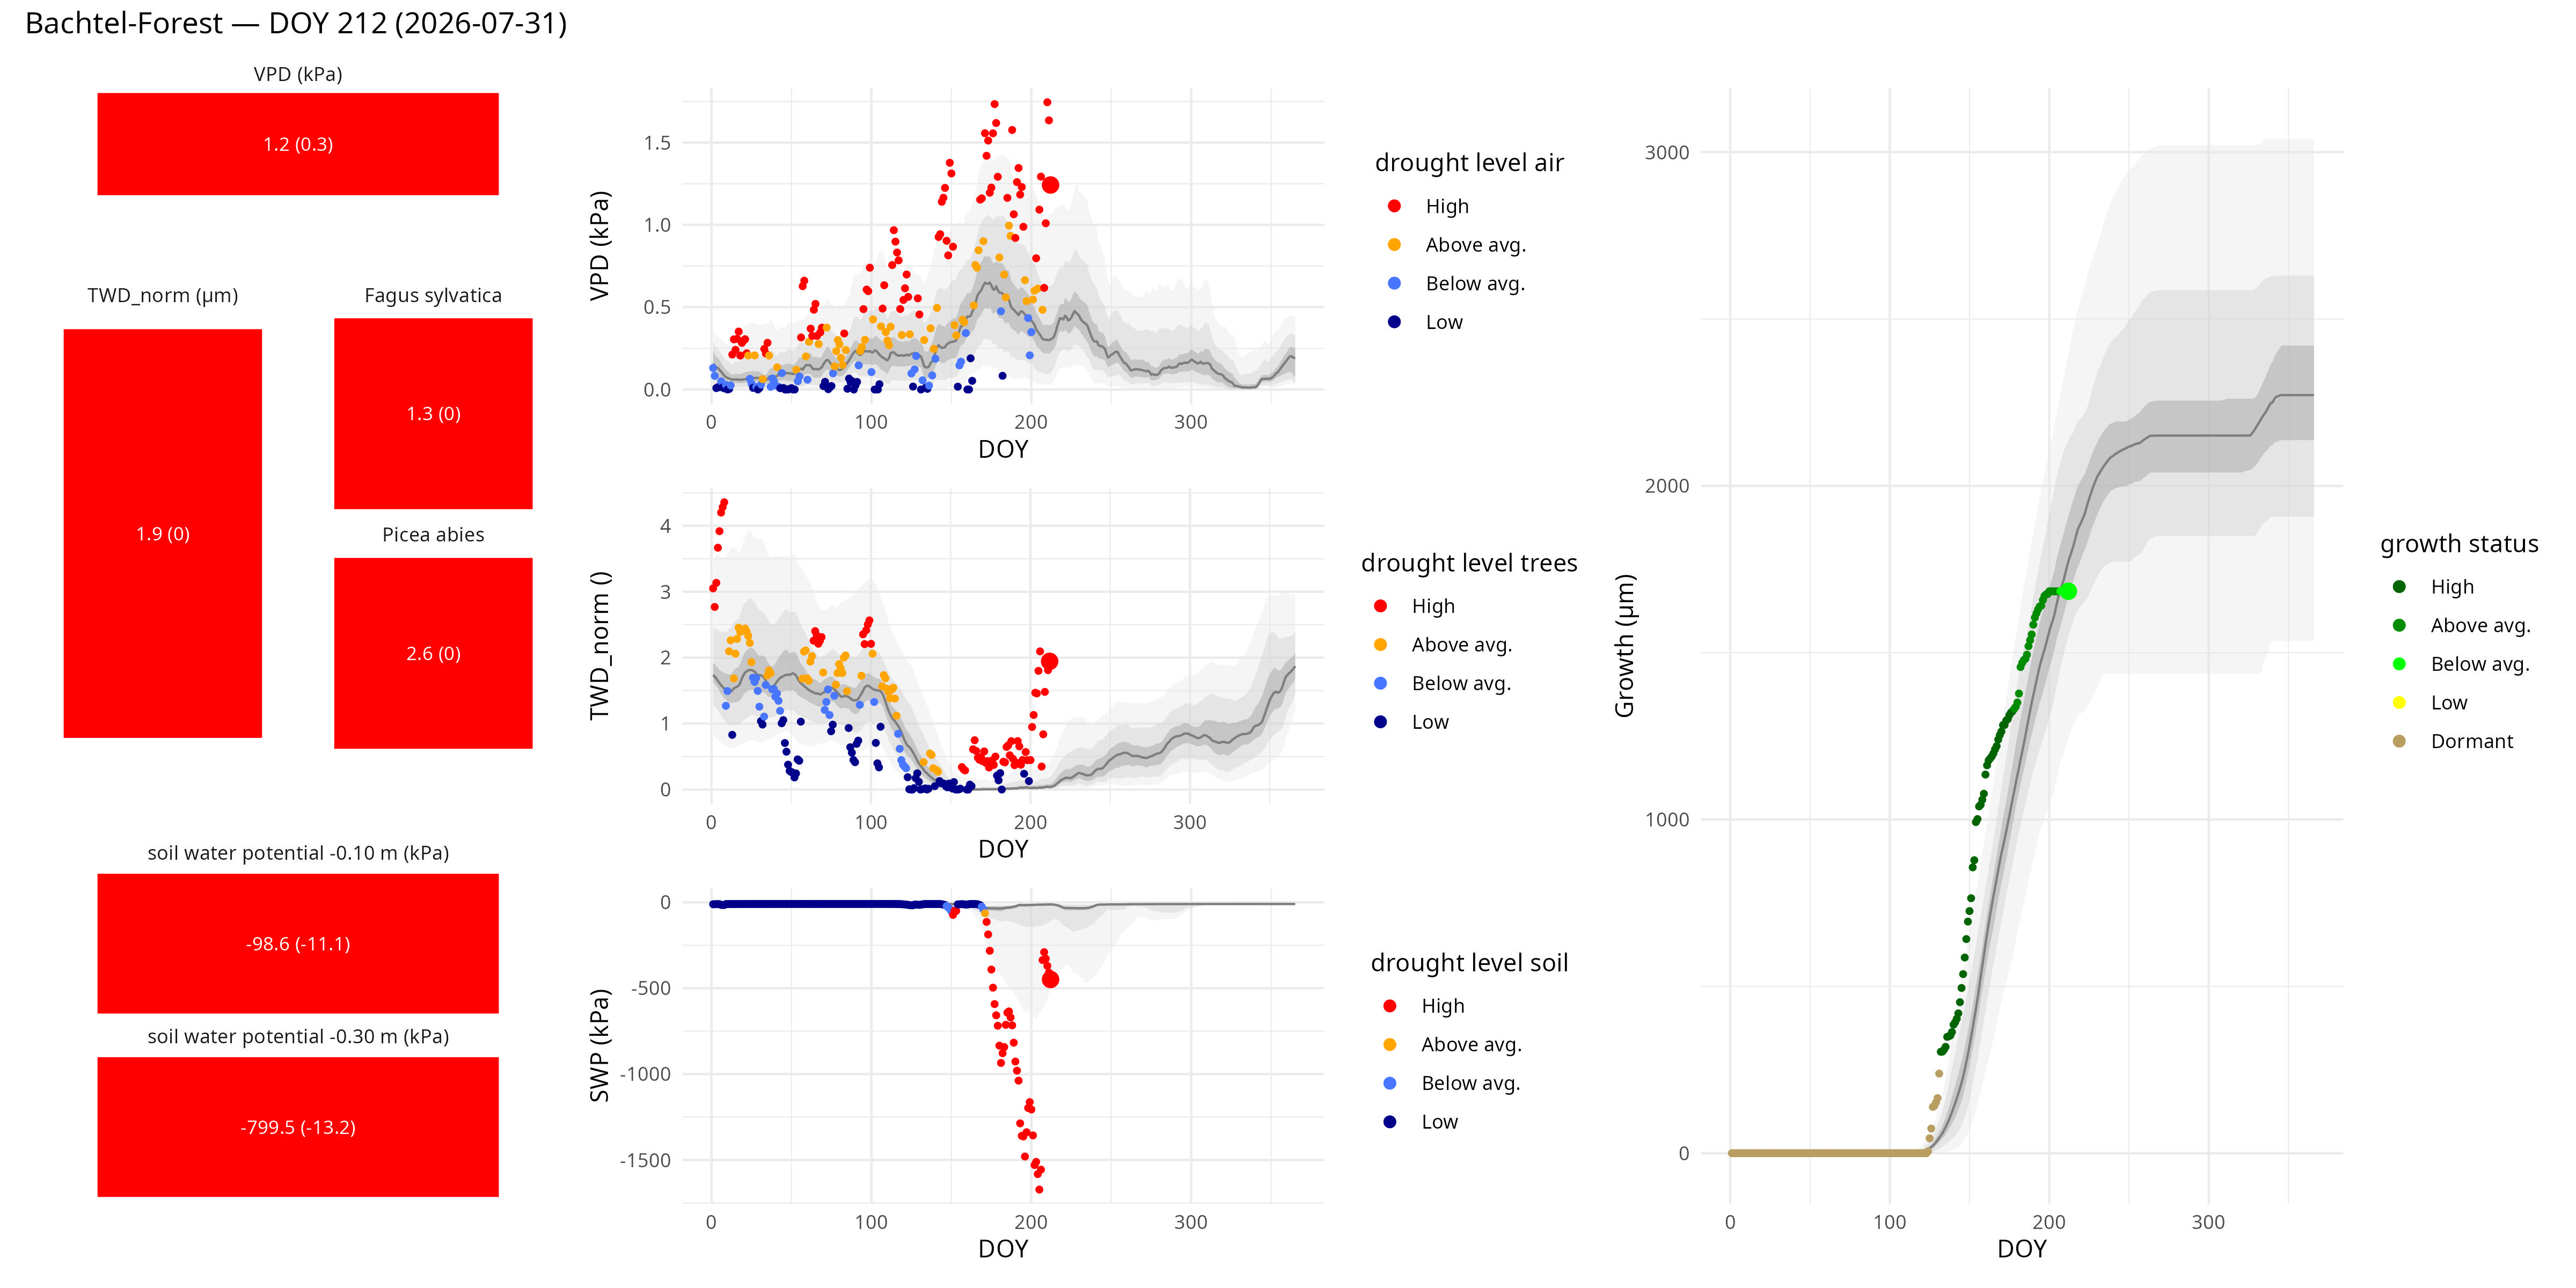
Bachtel Forest

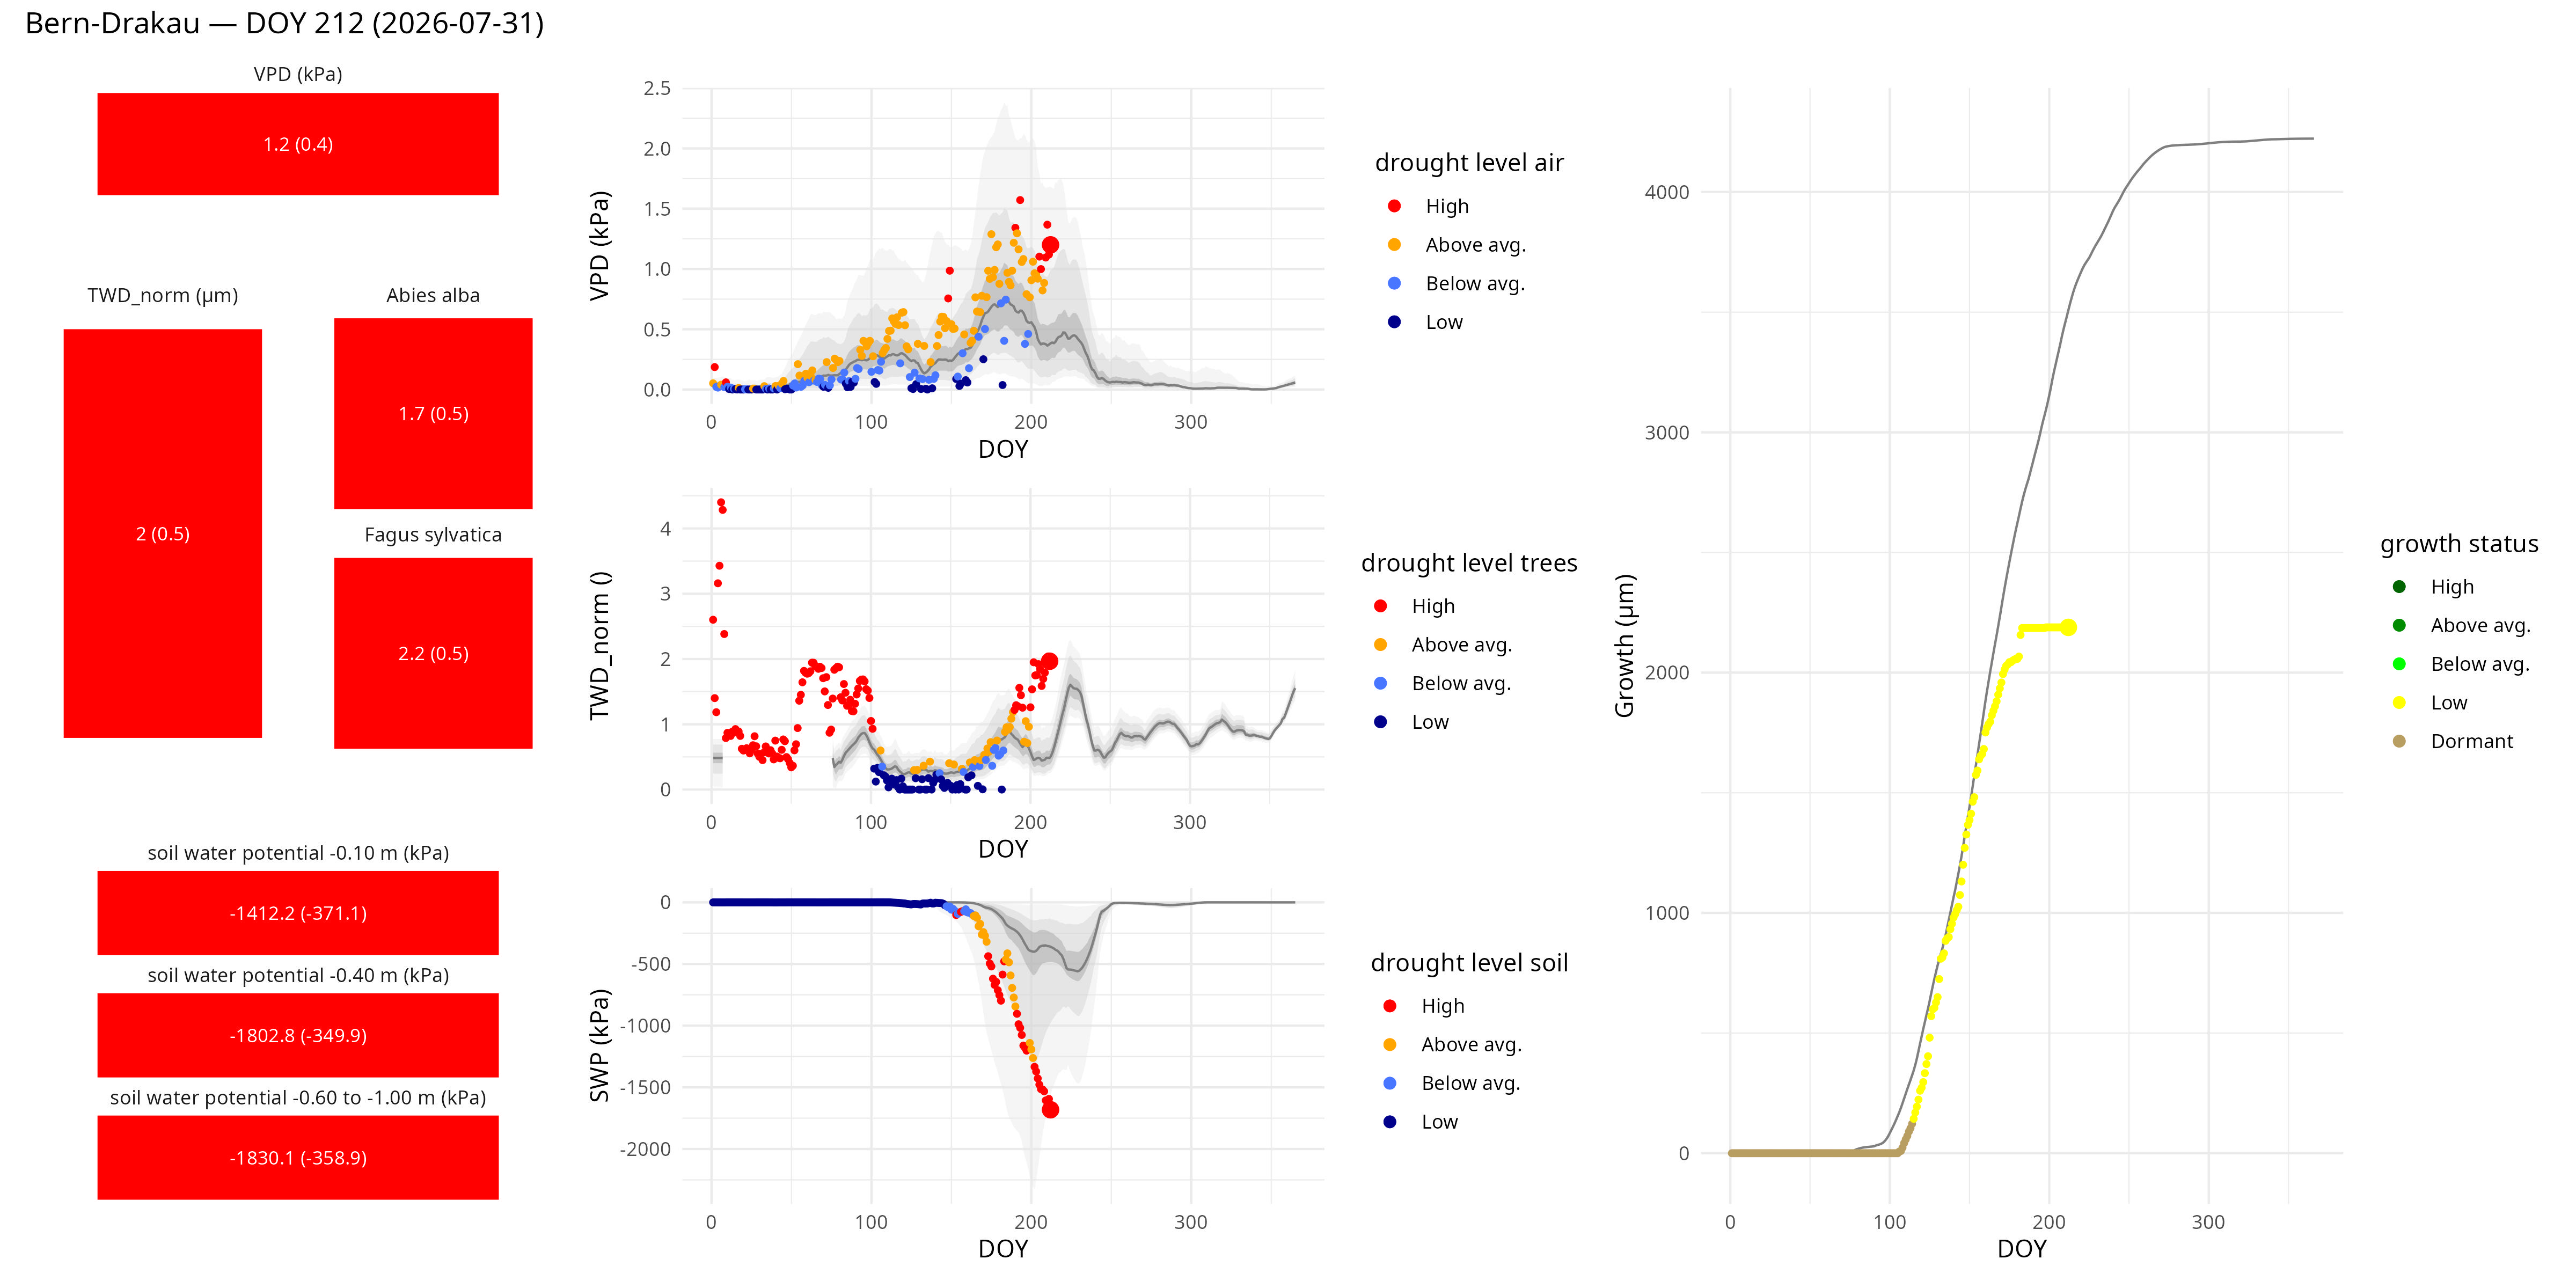
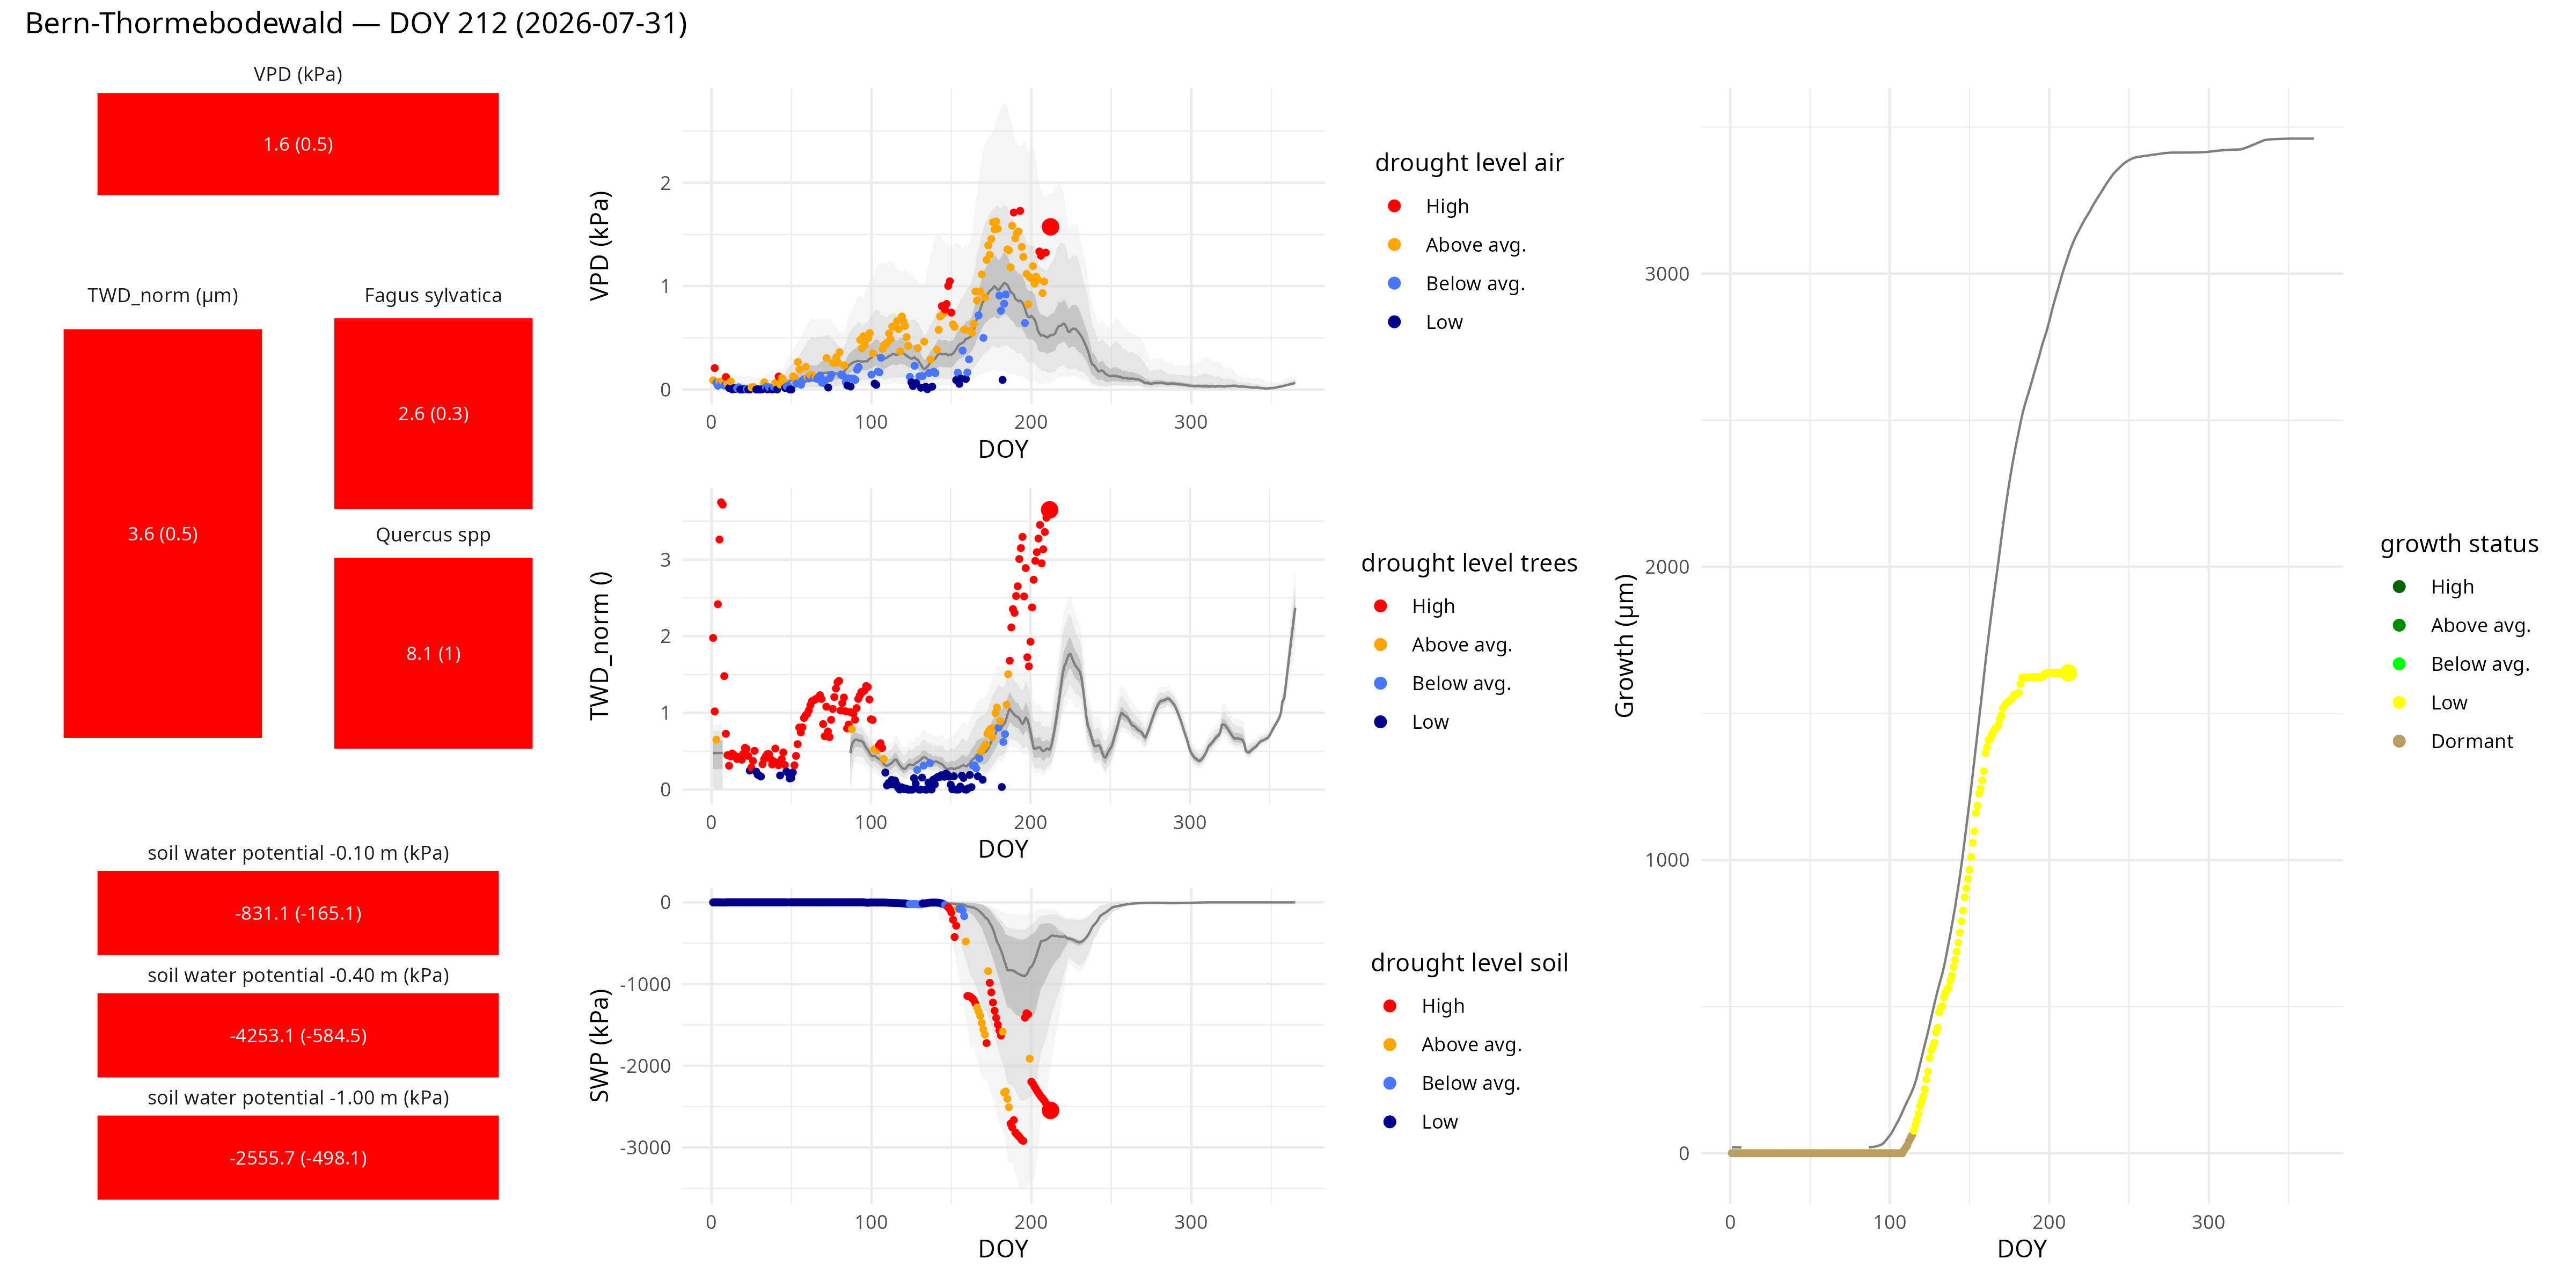
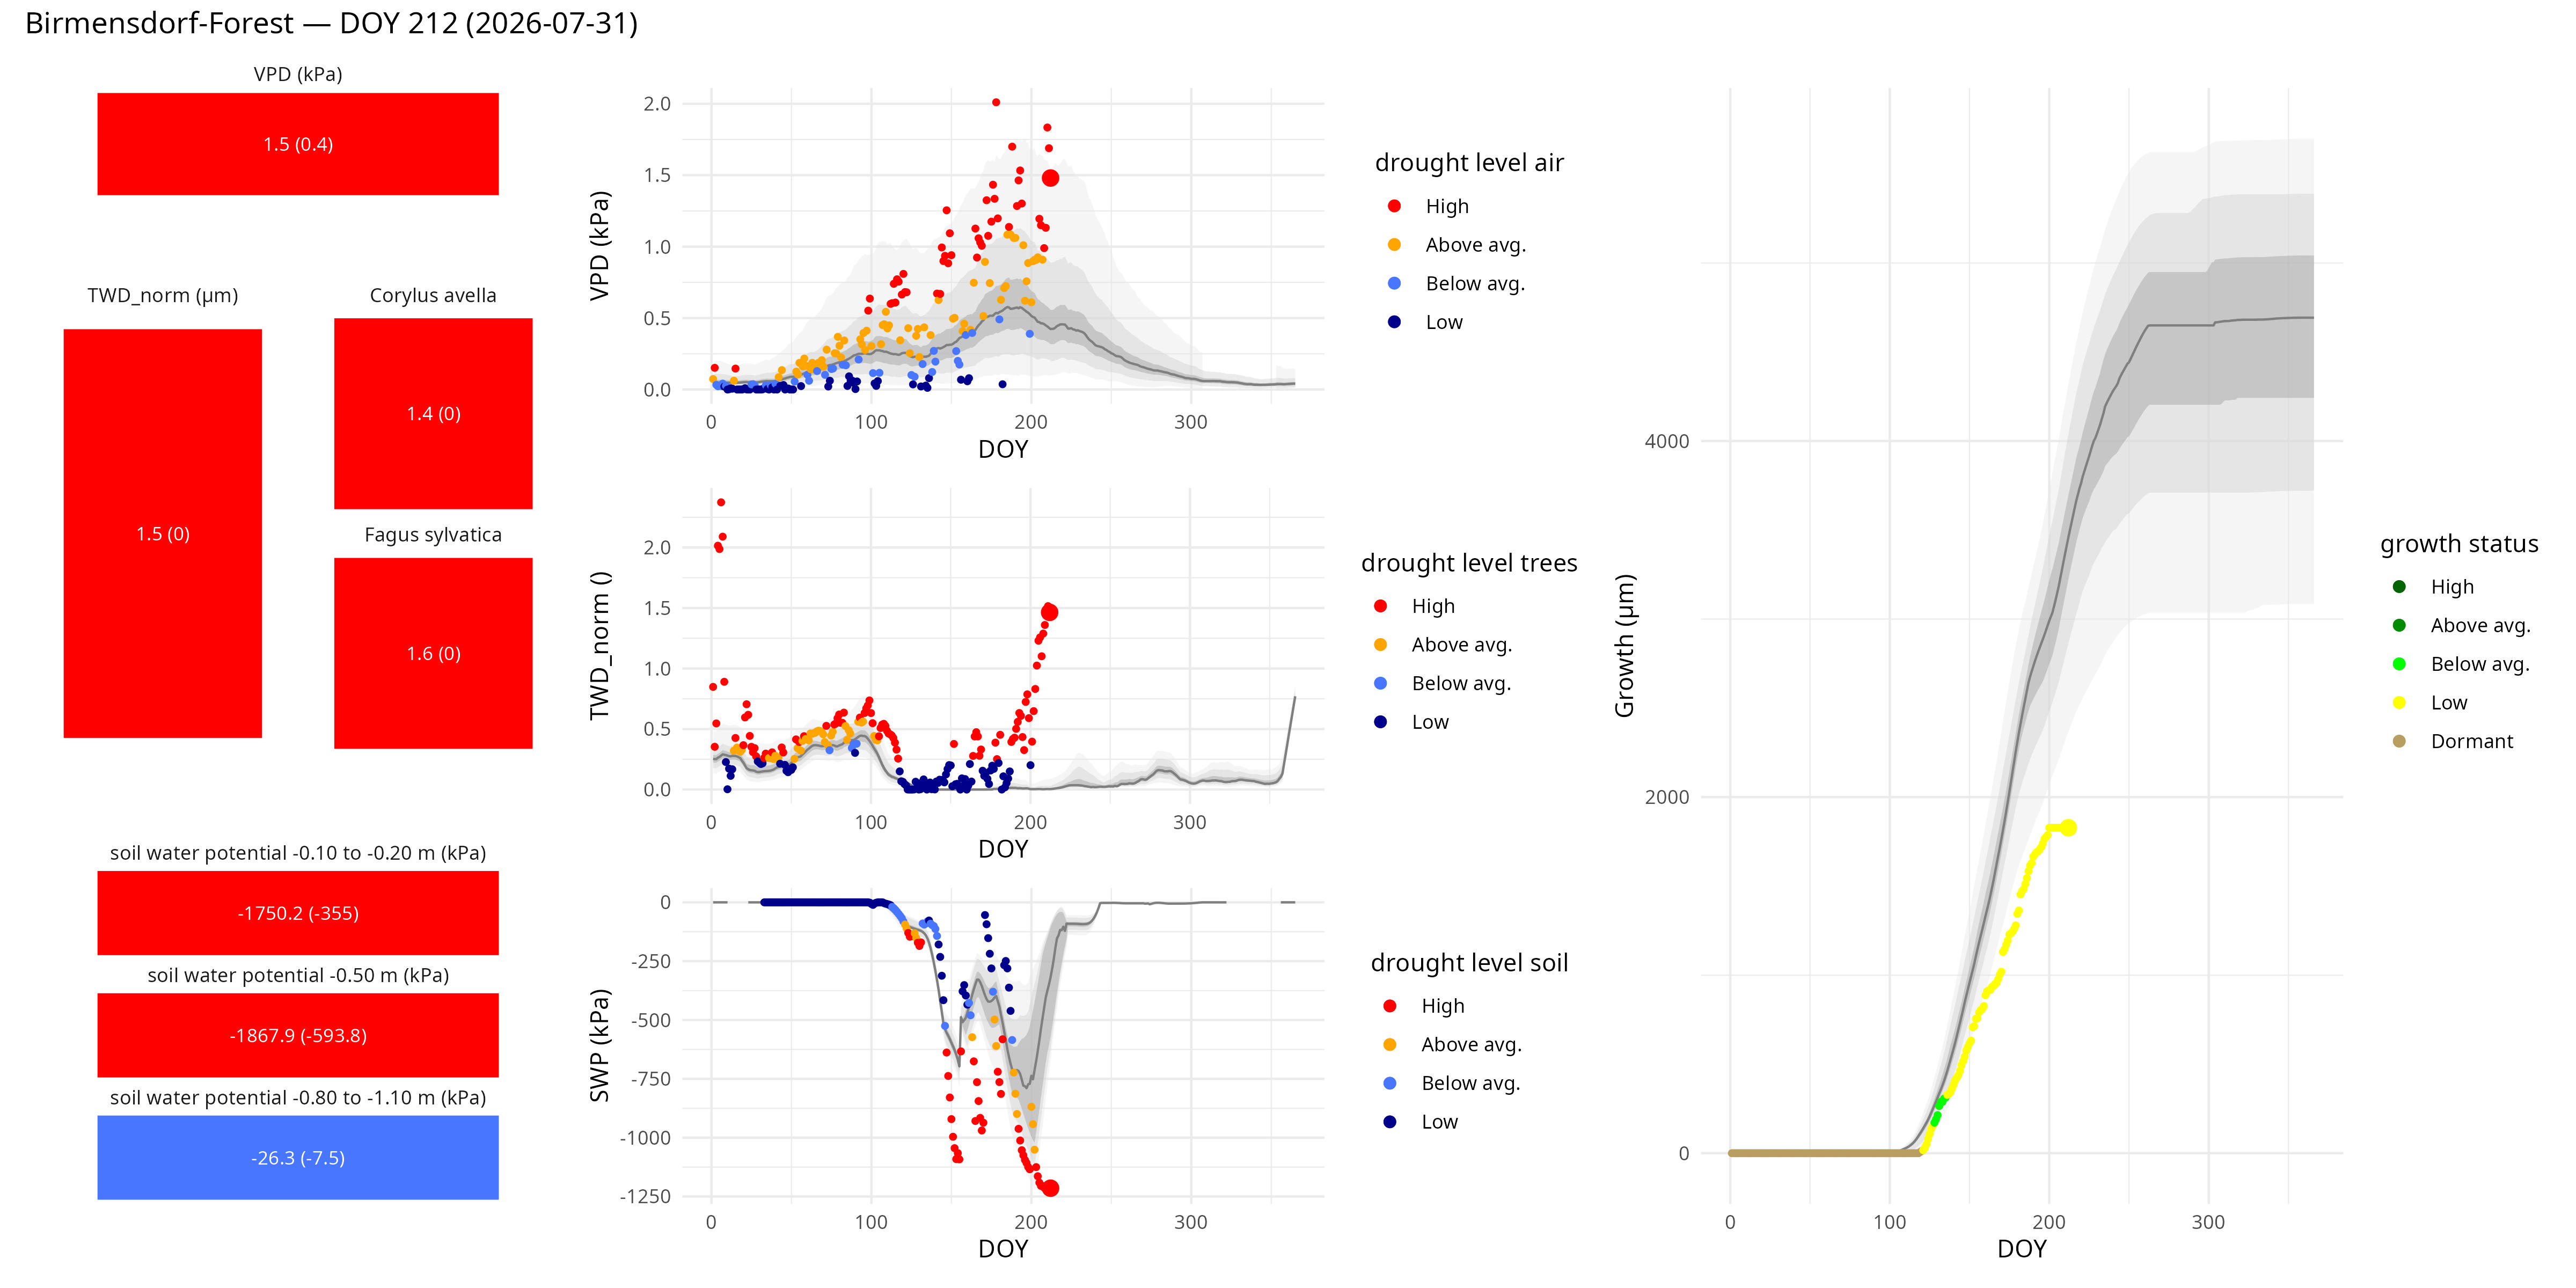
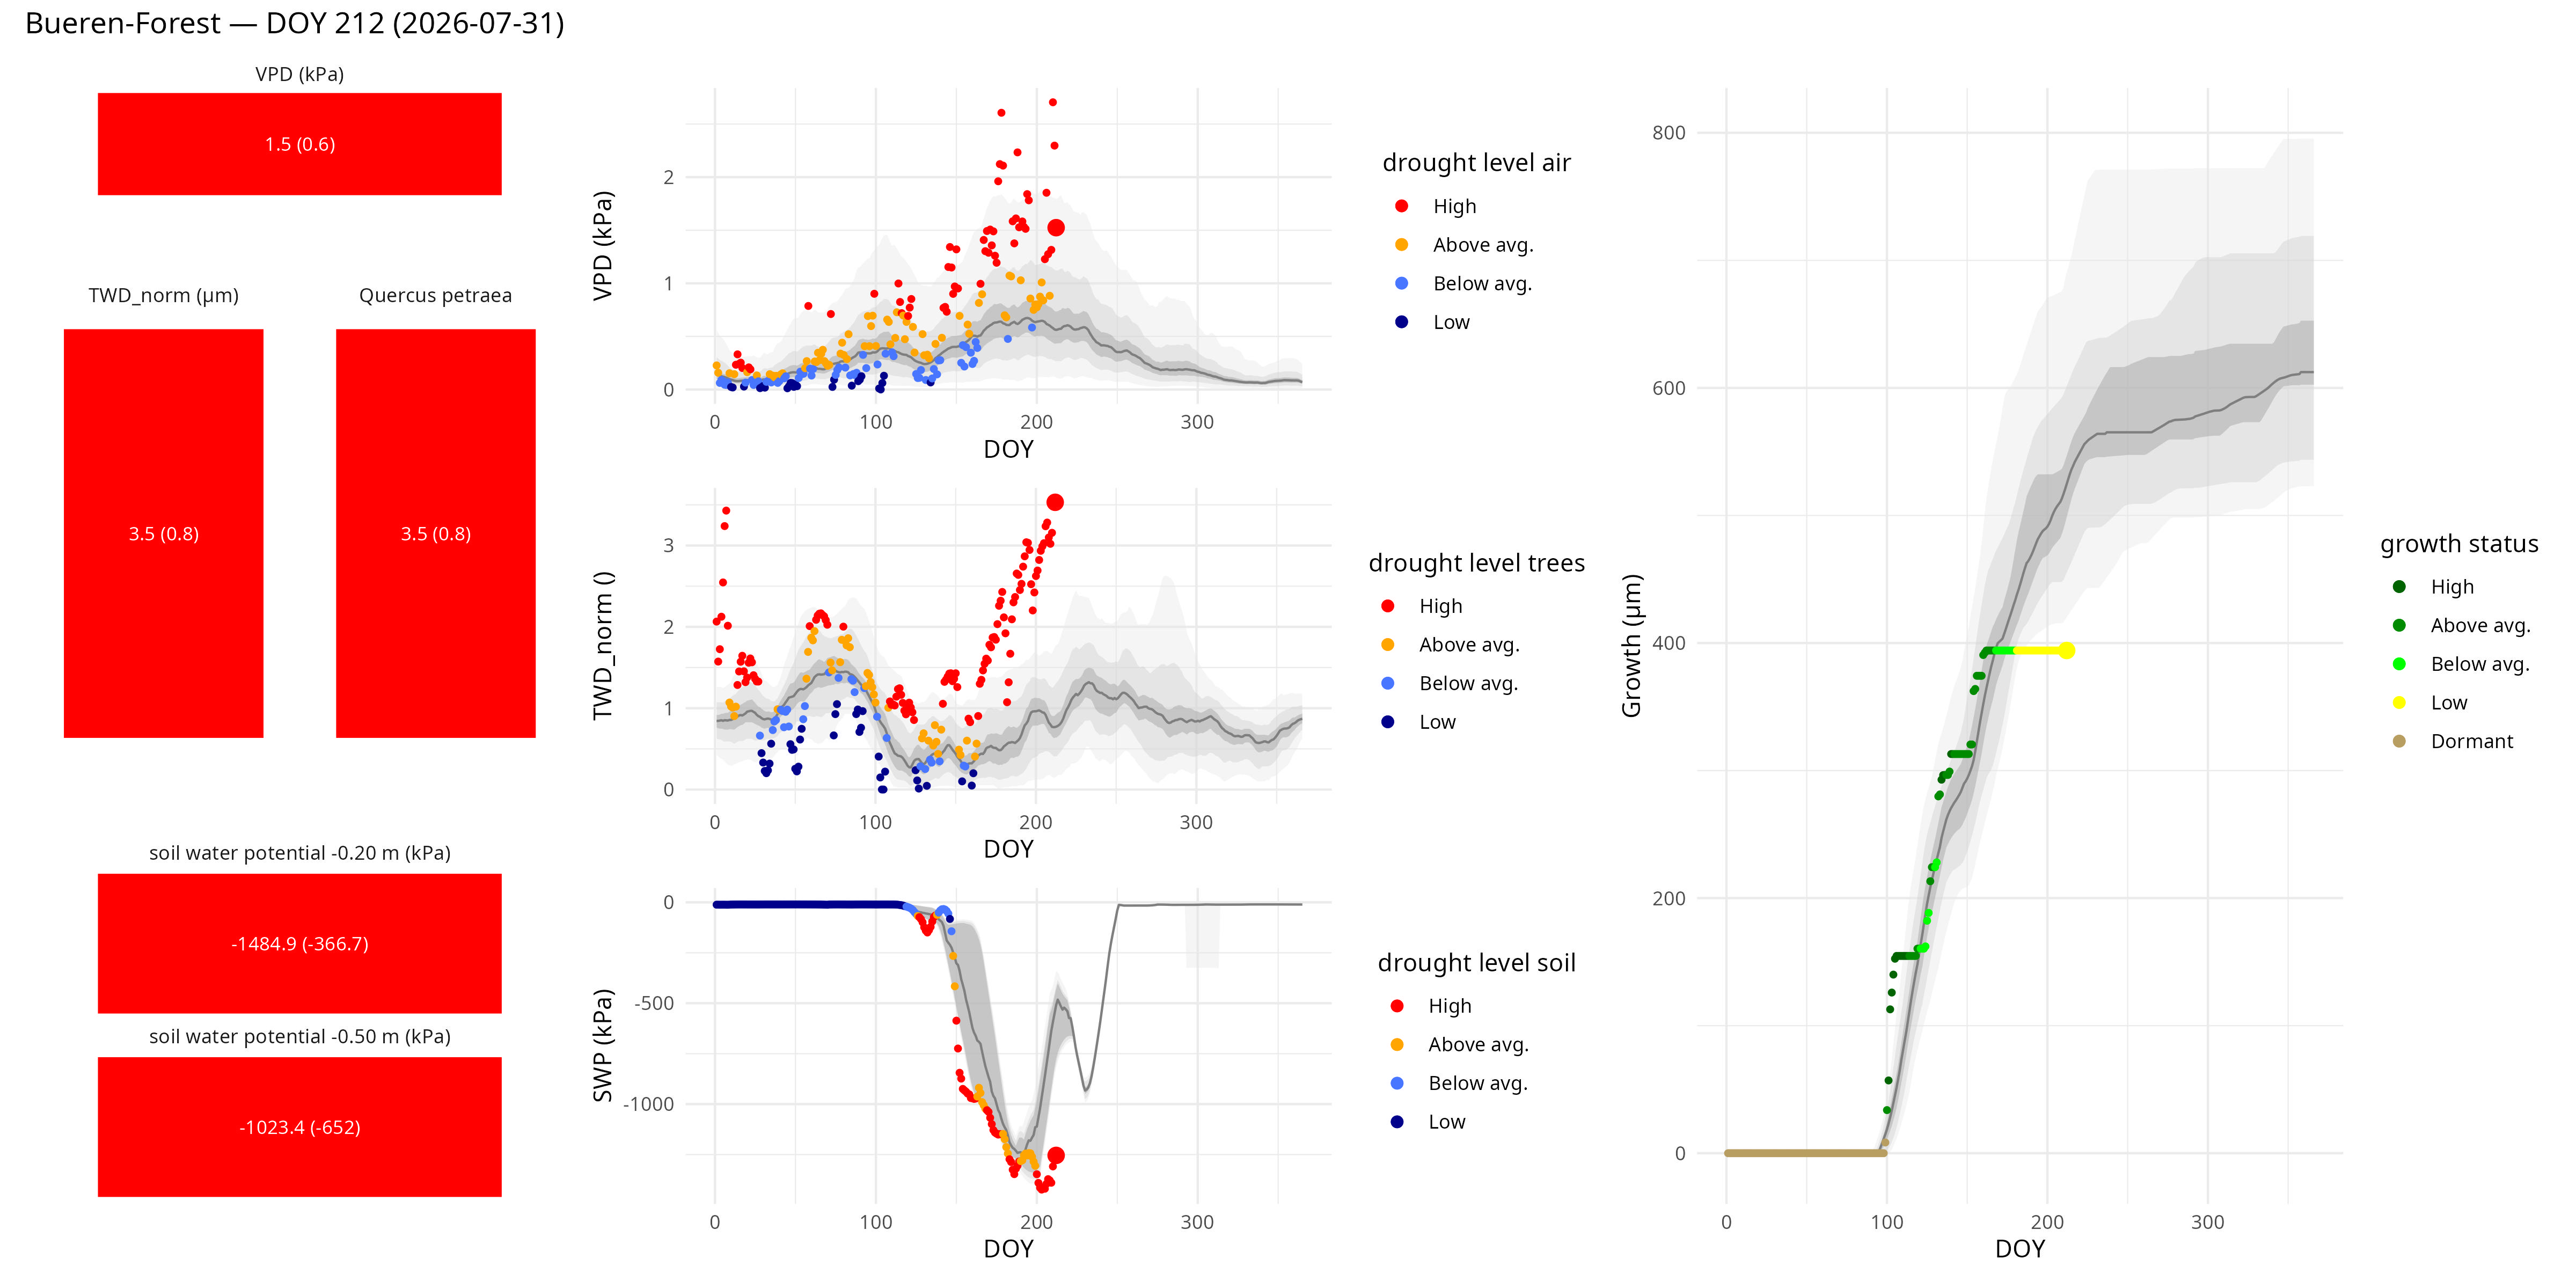
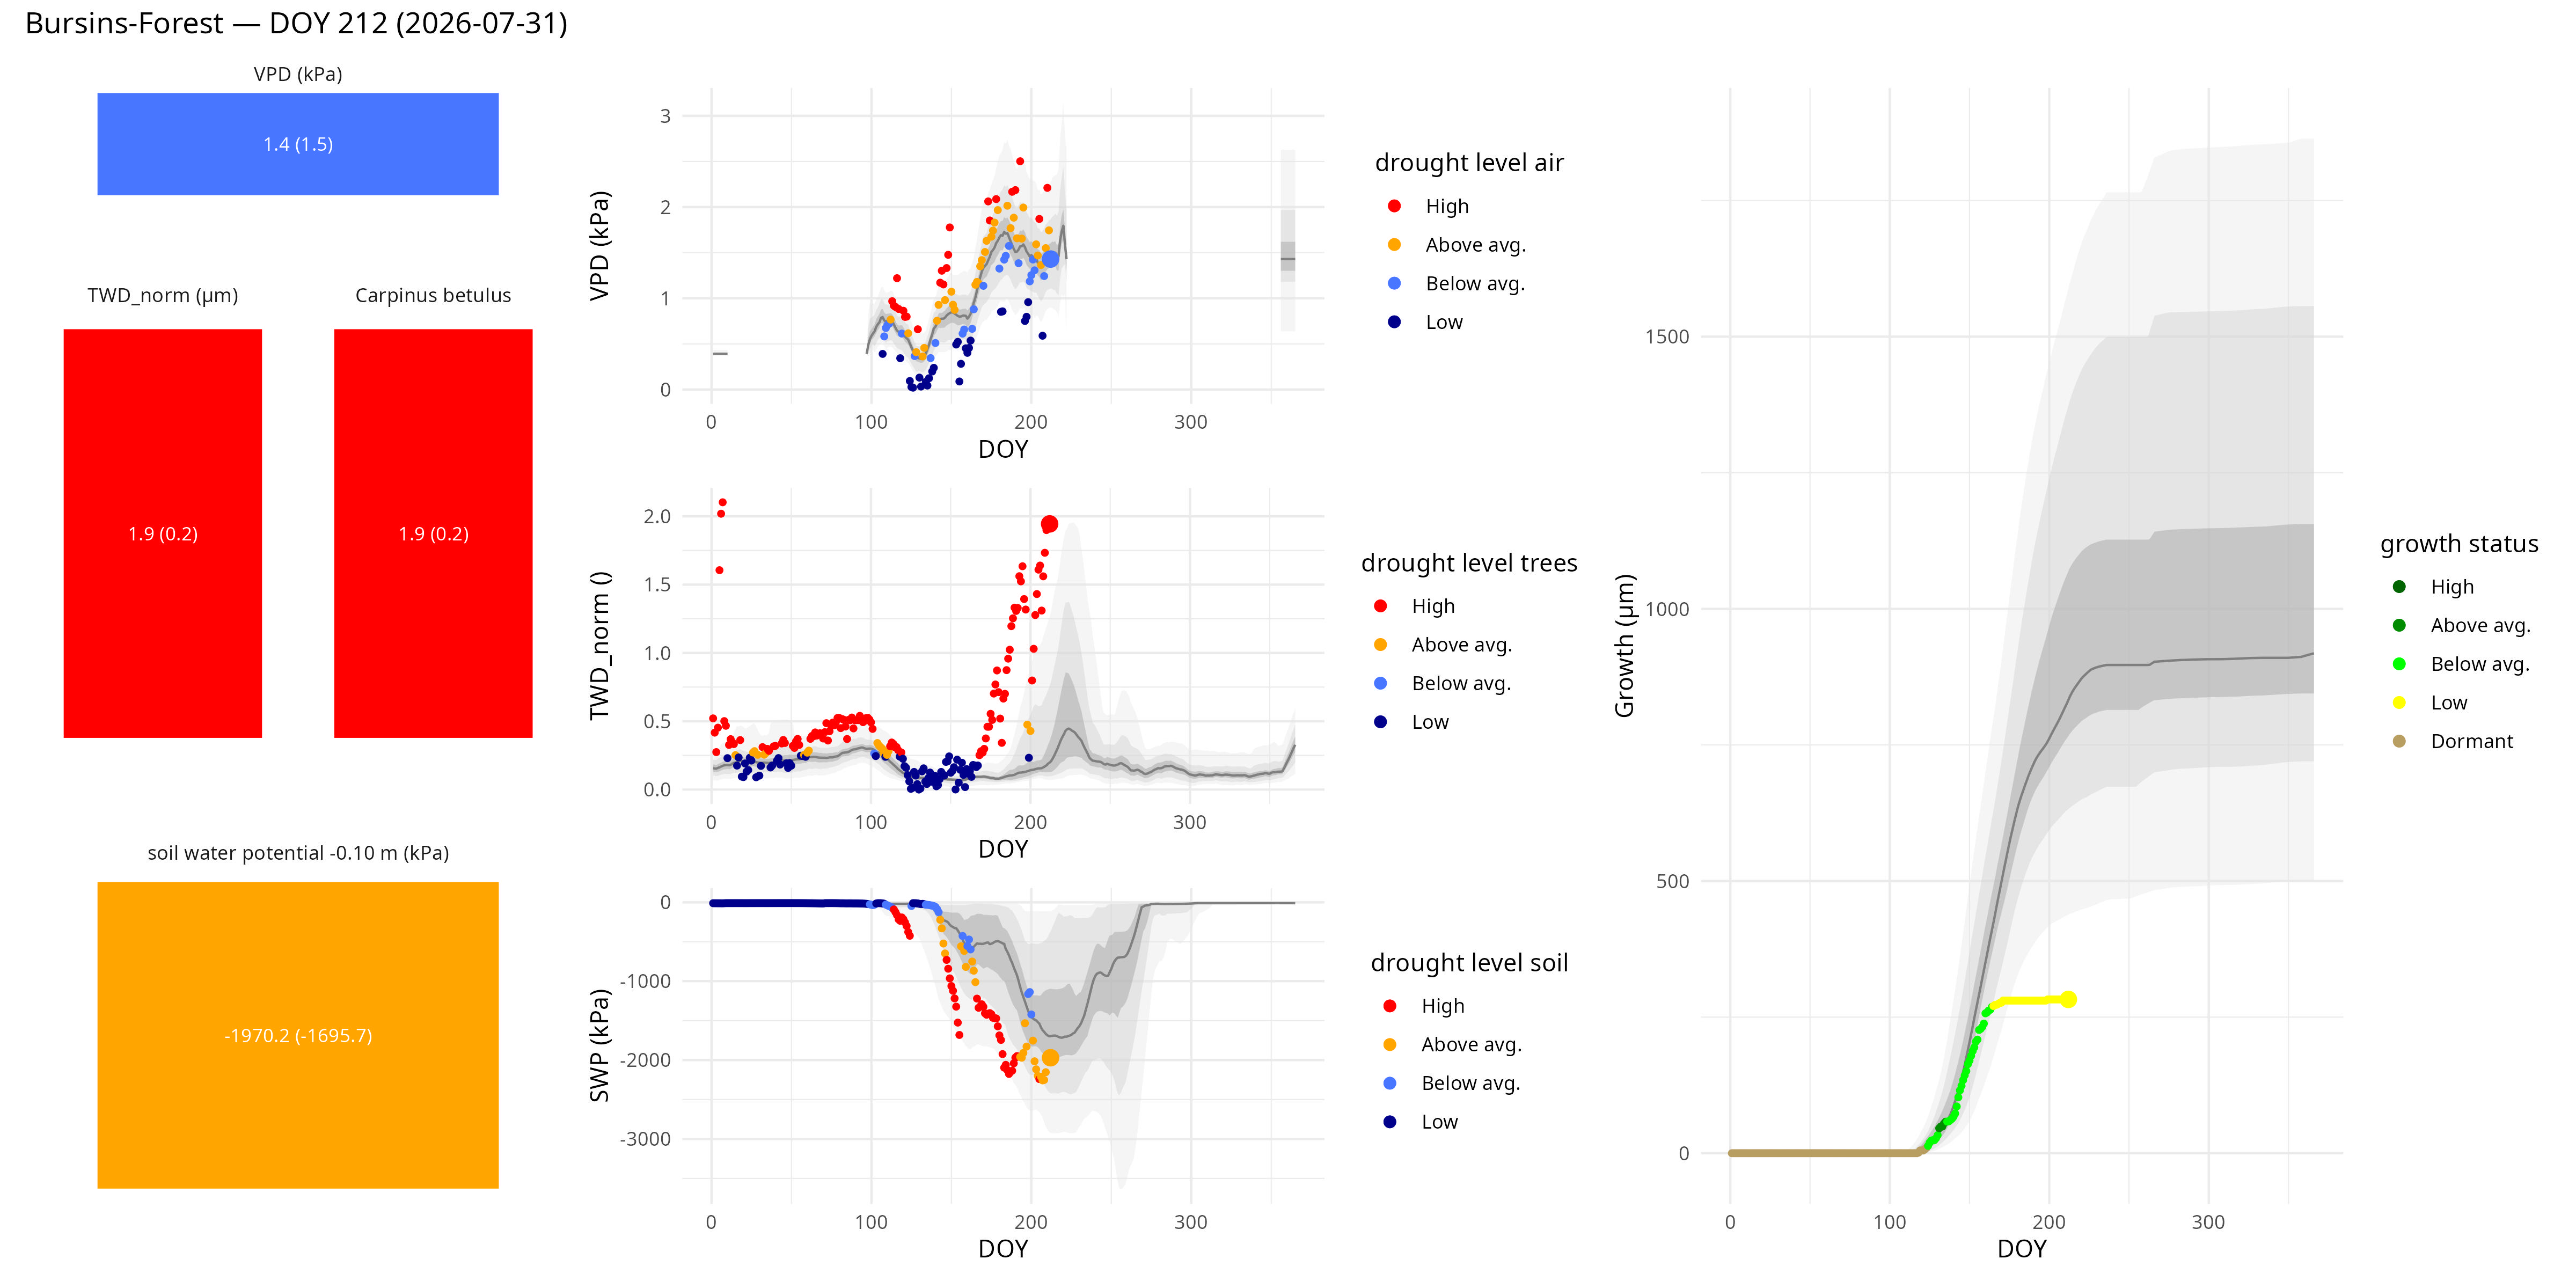
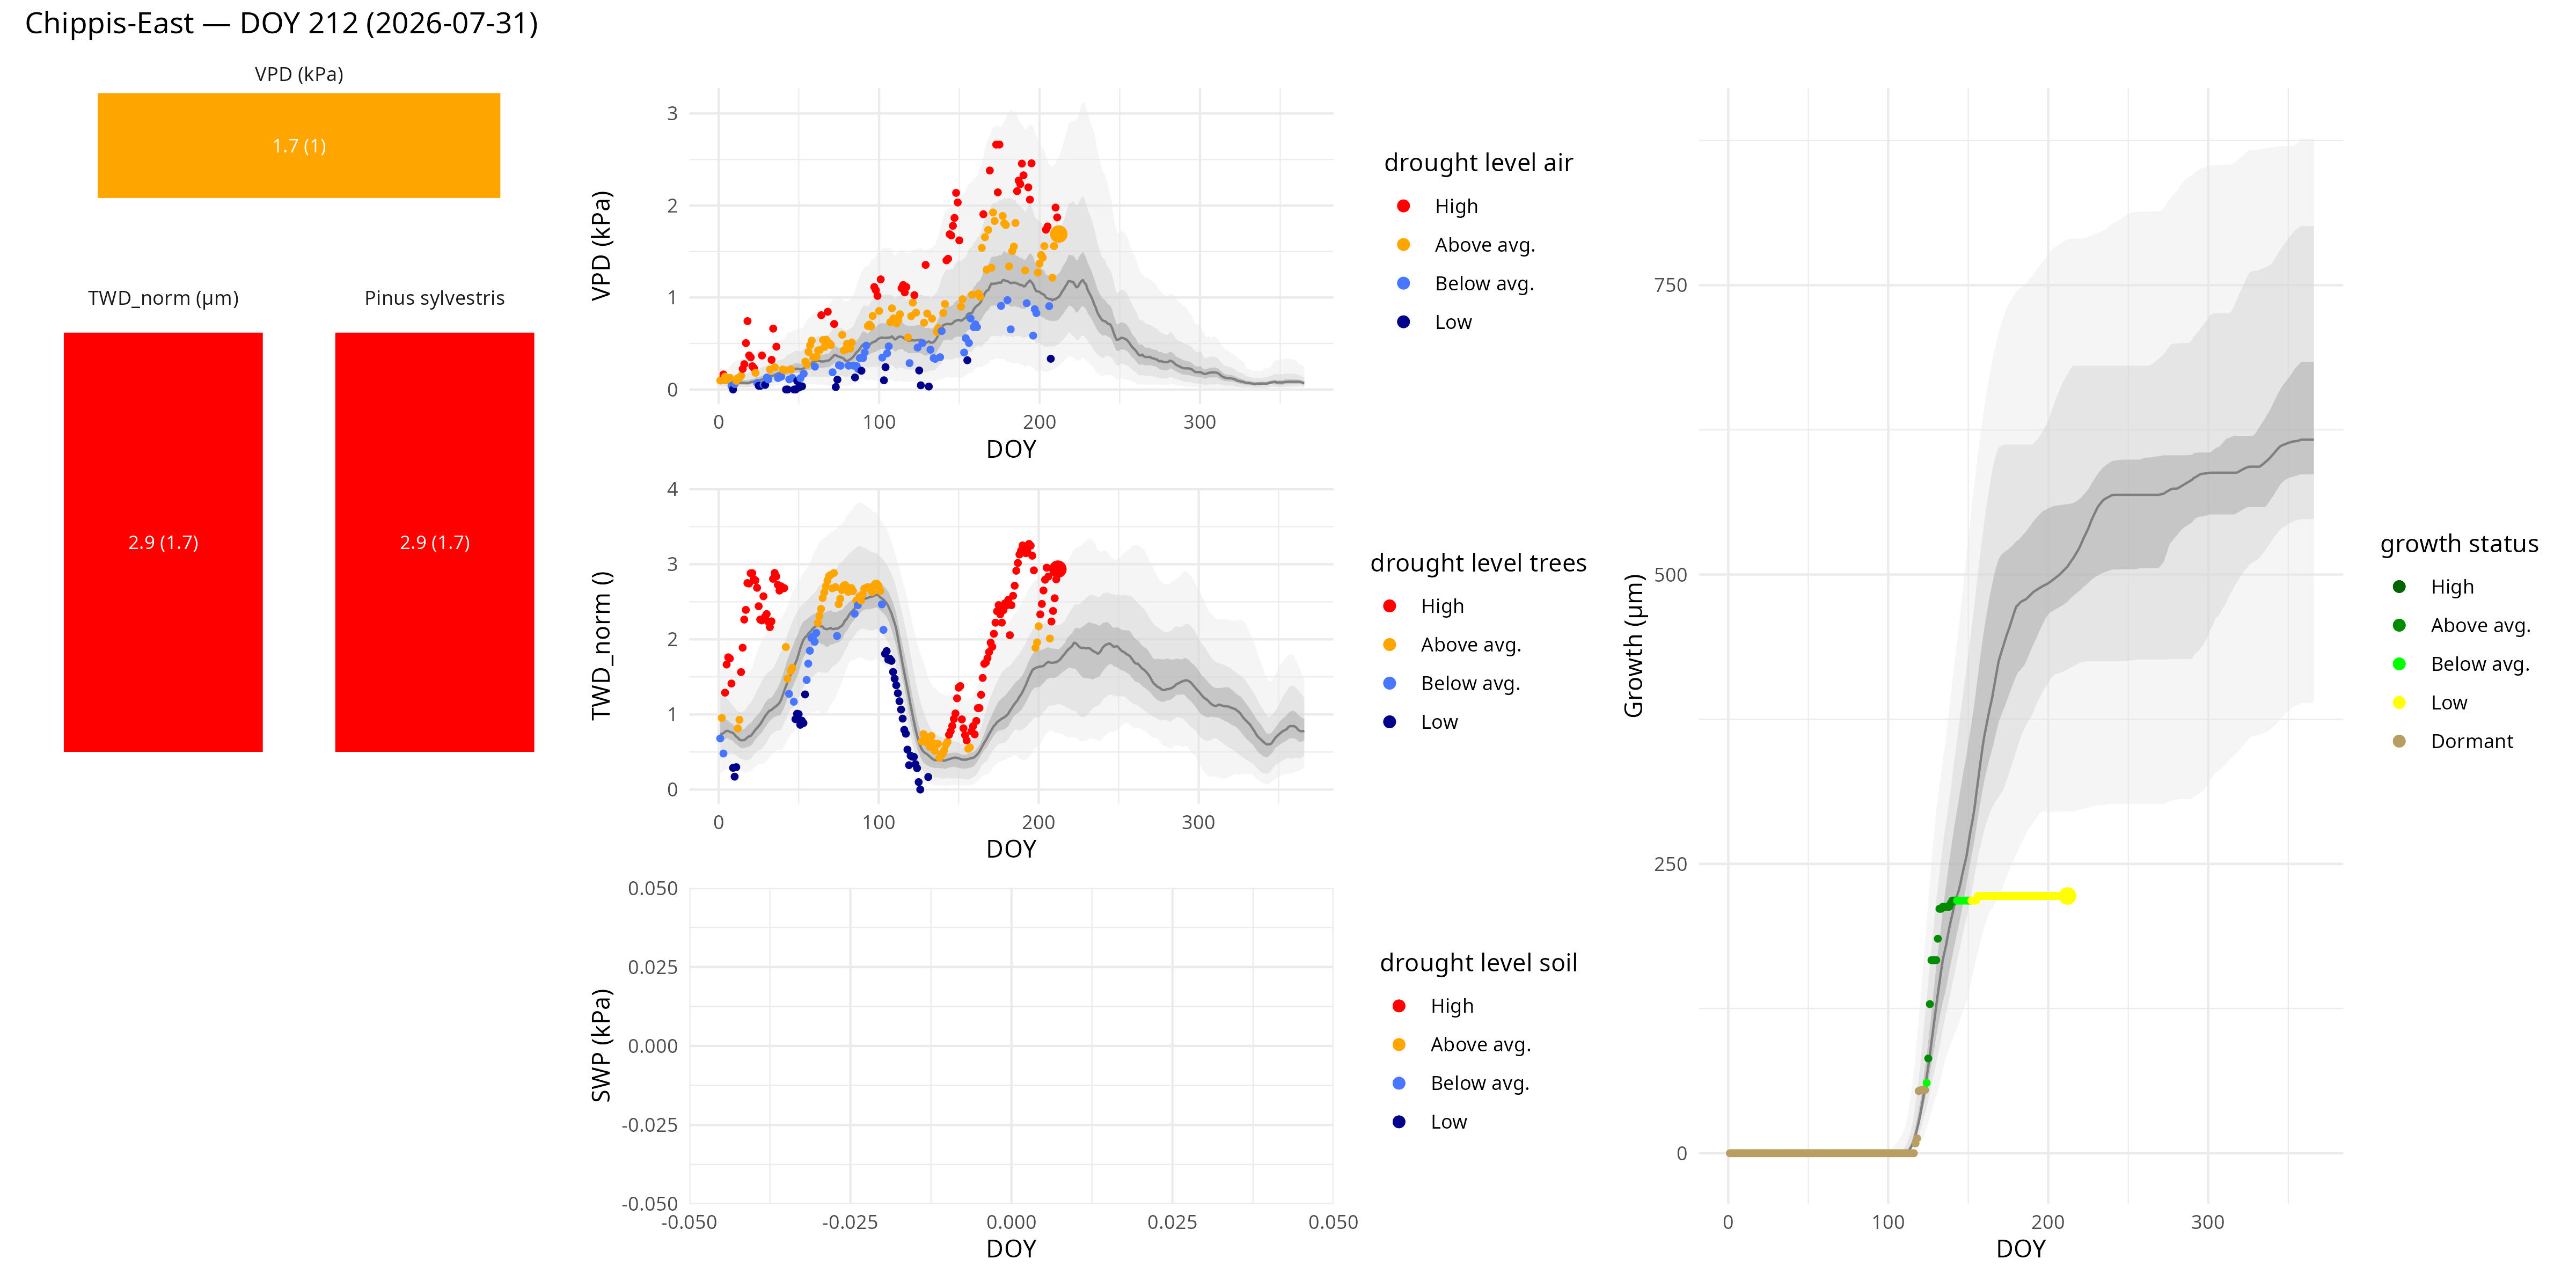
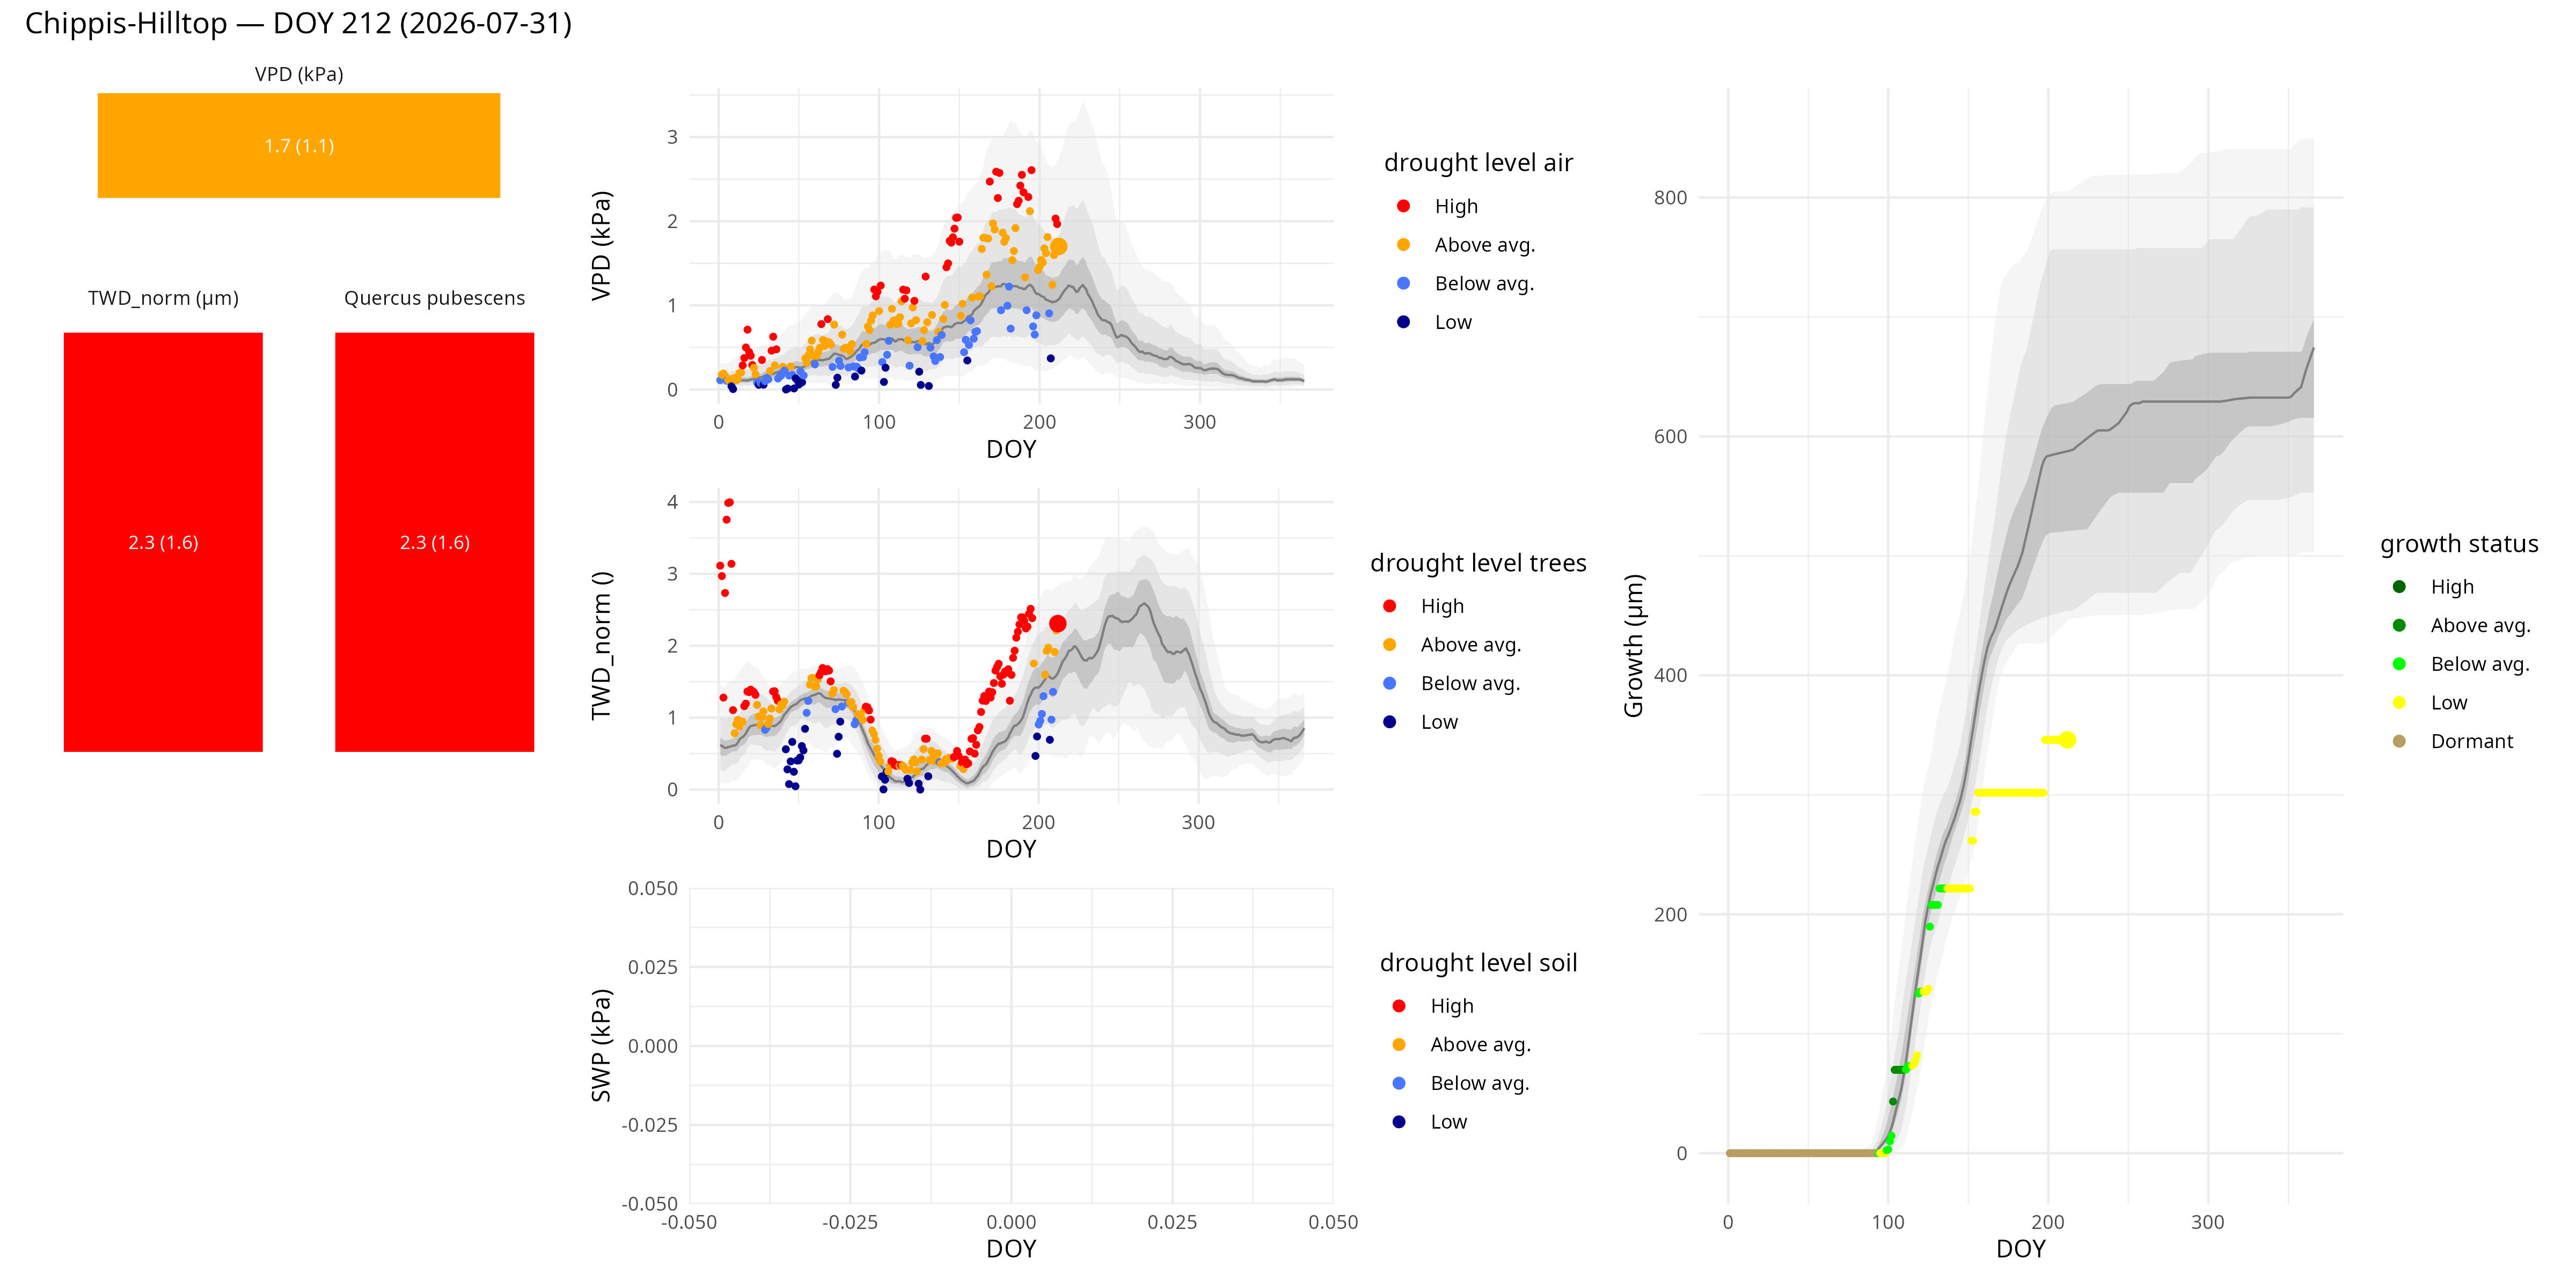
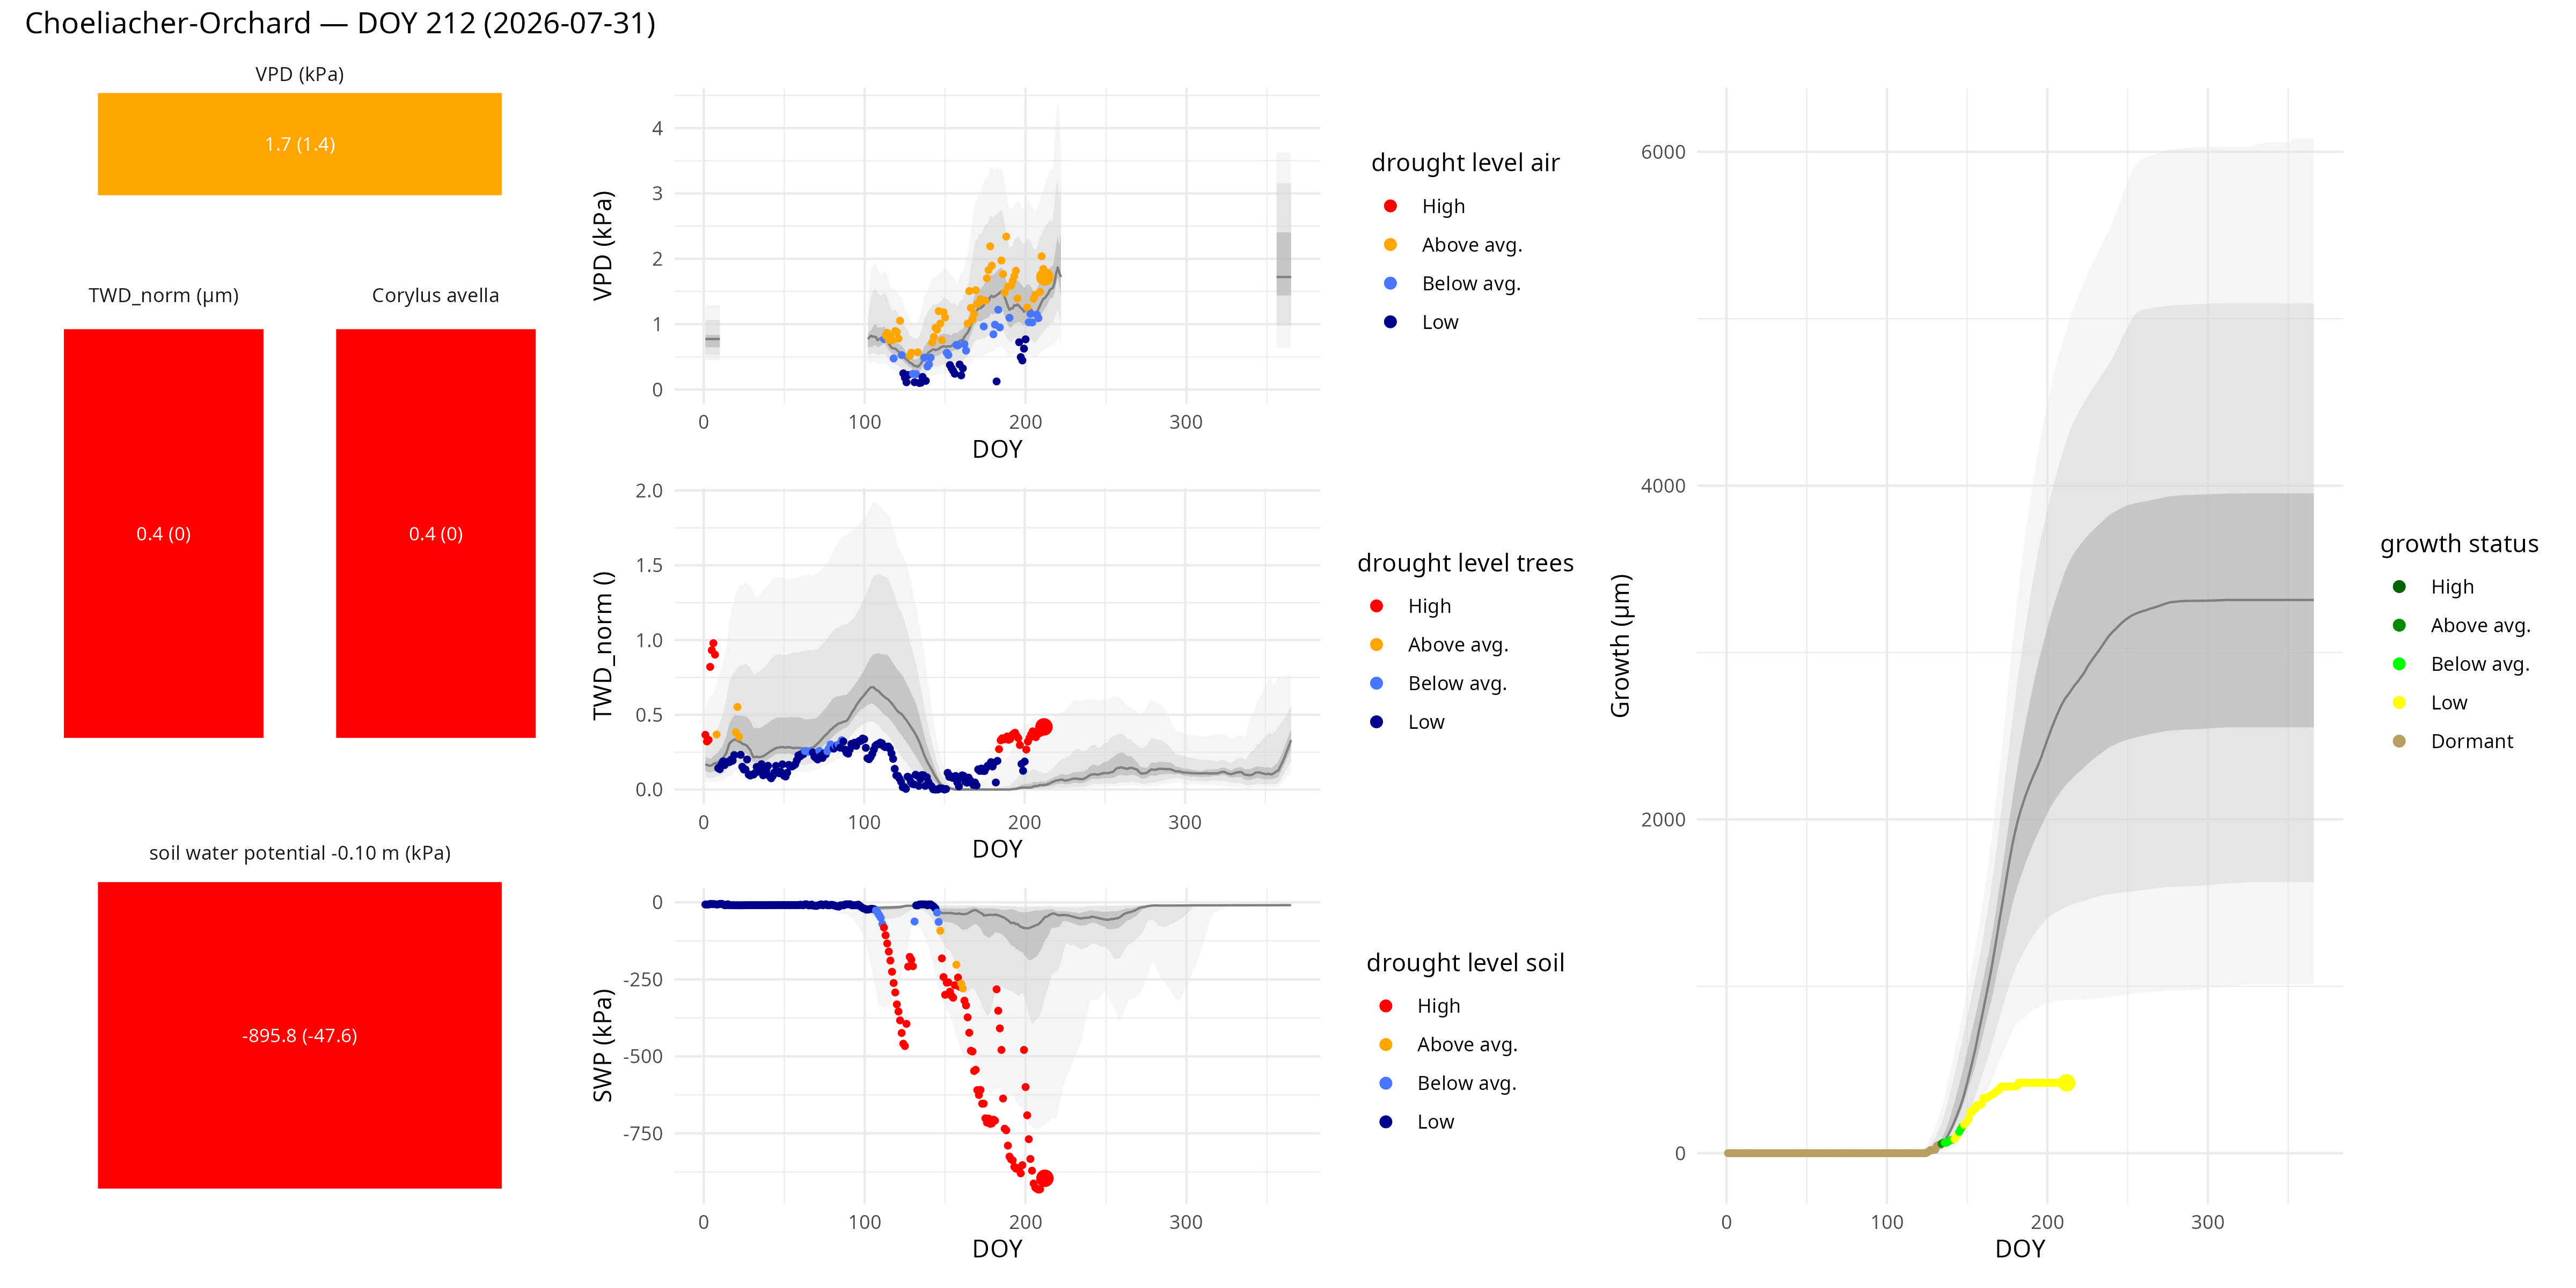
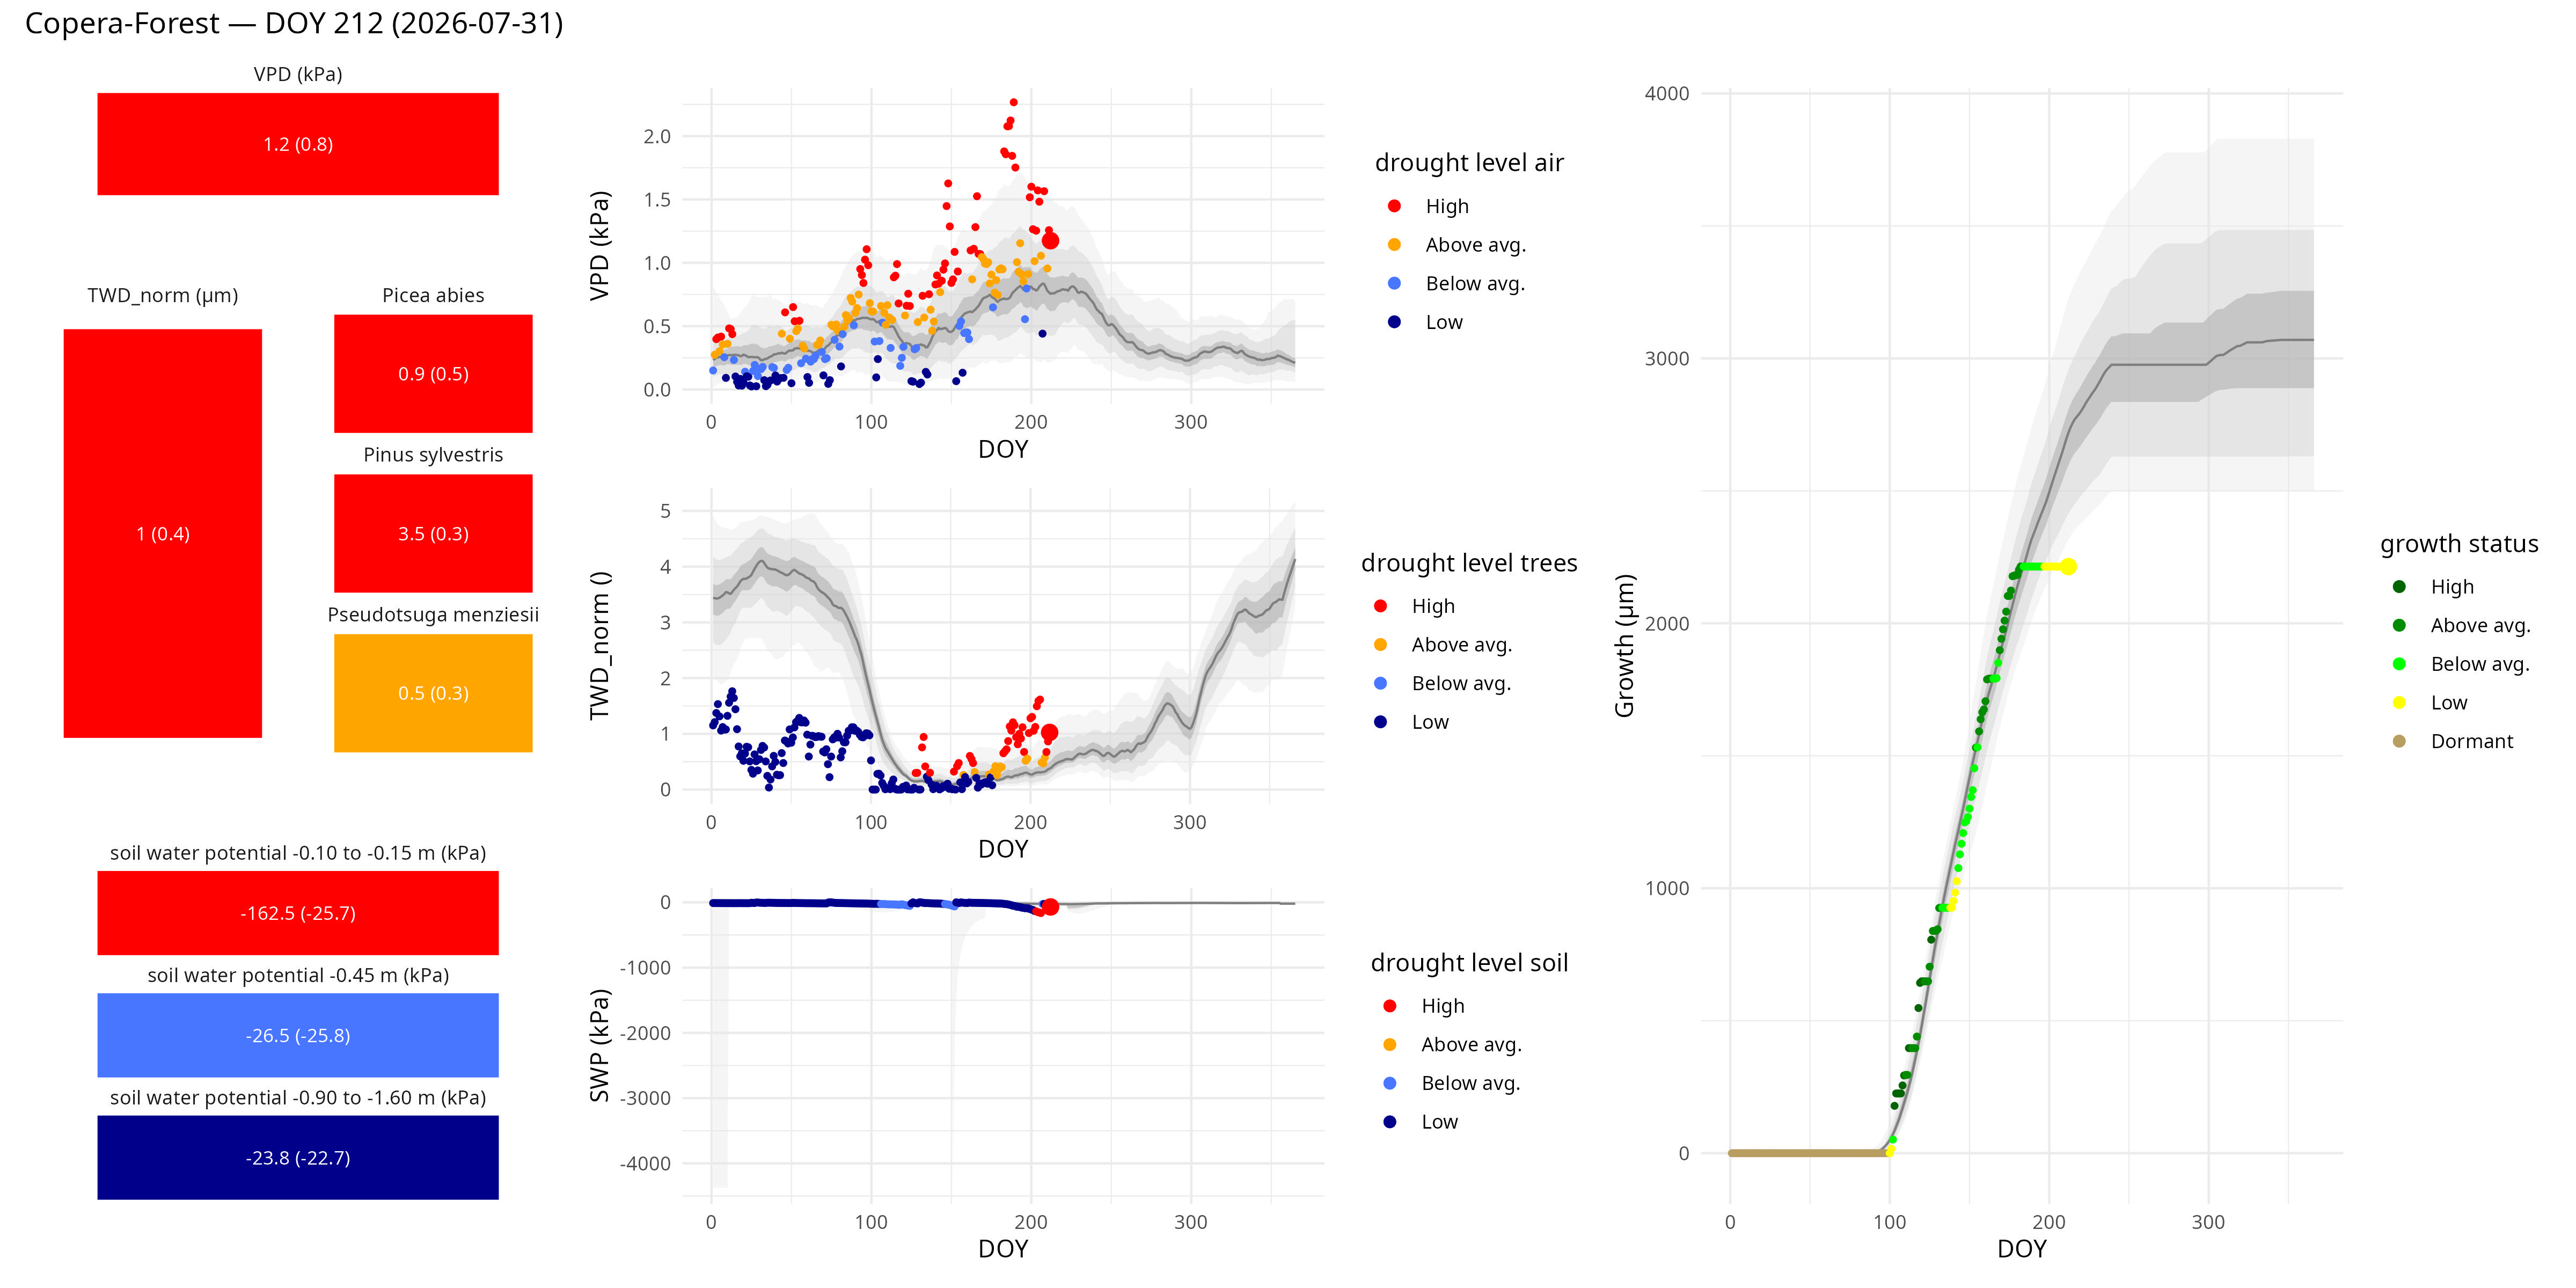
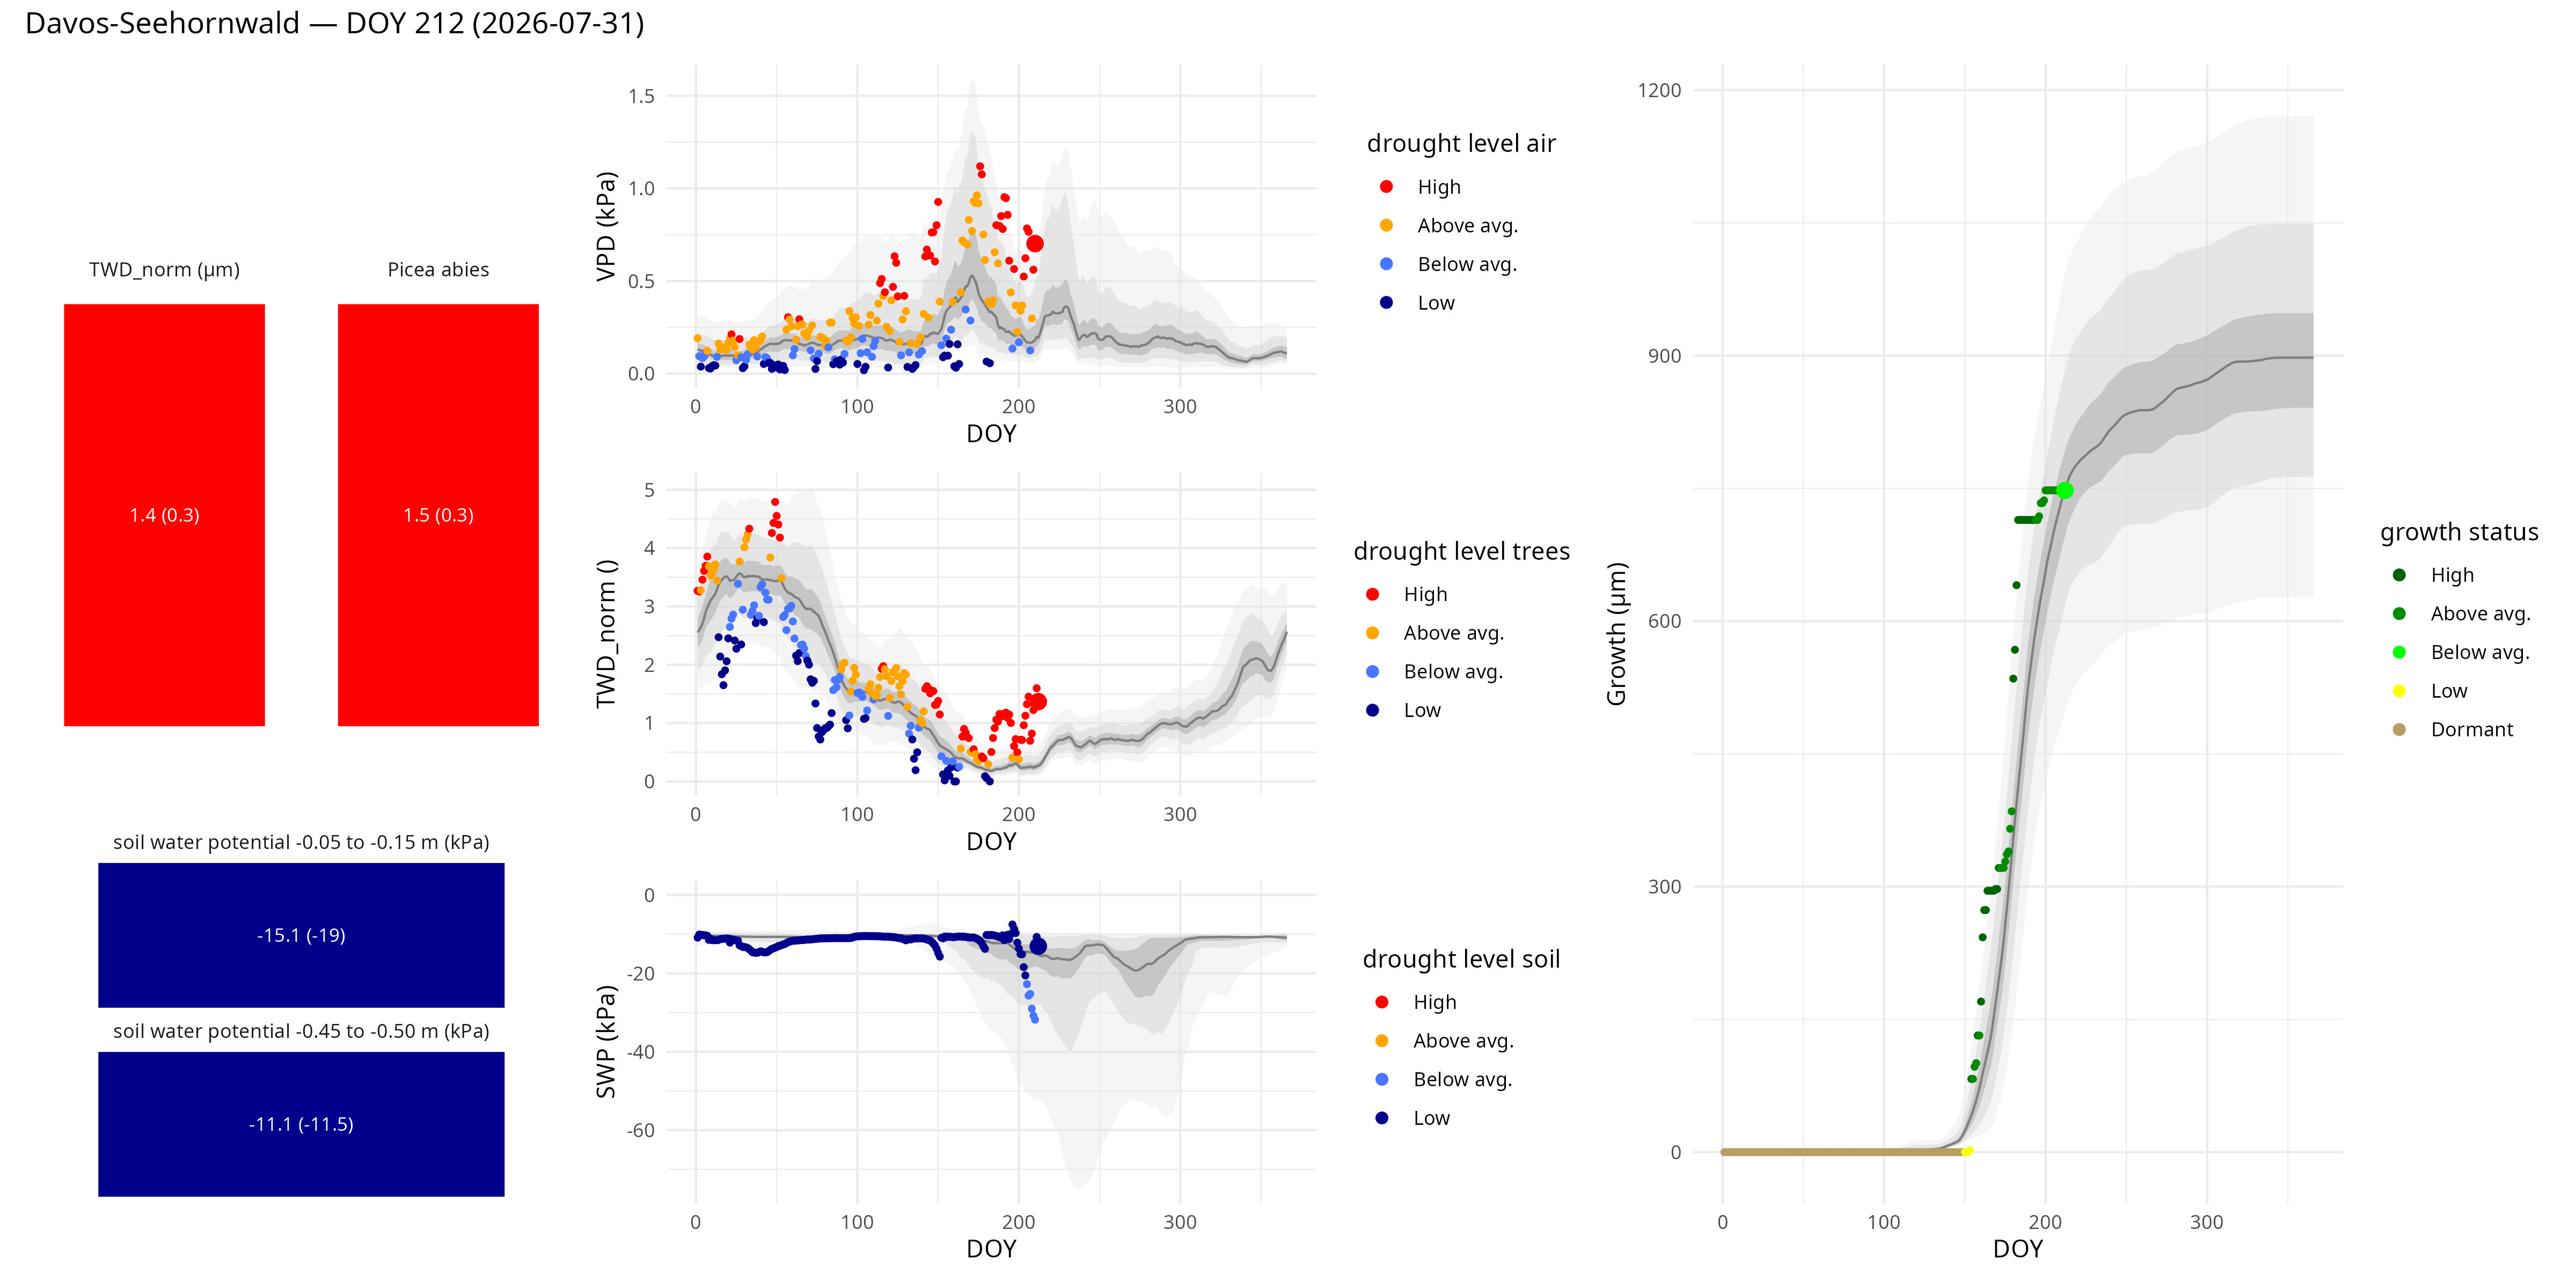
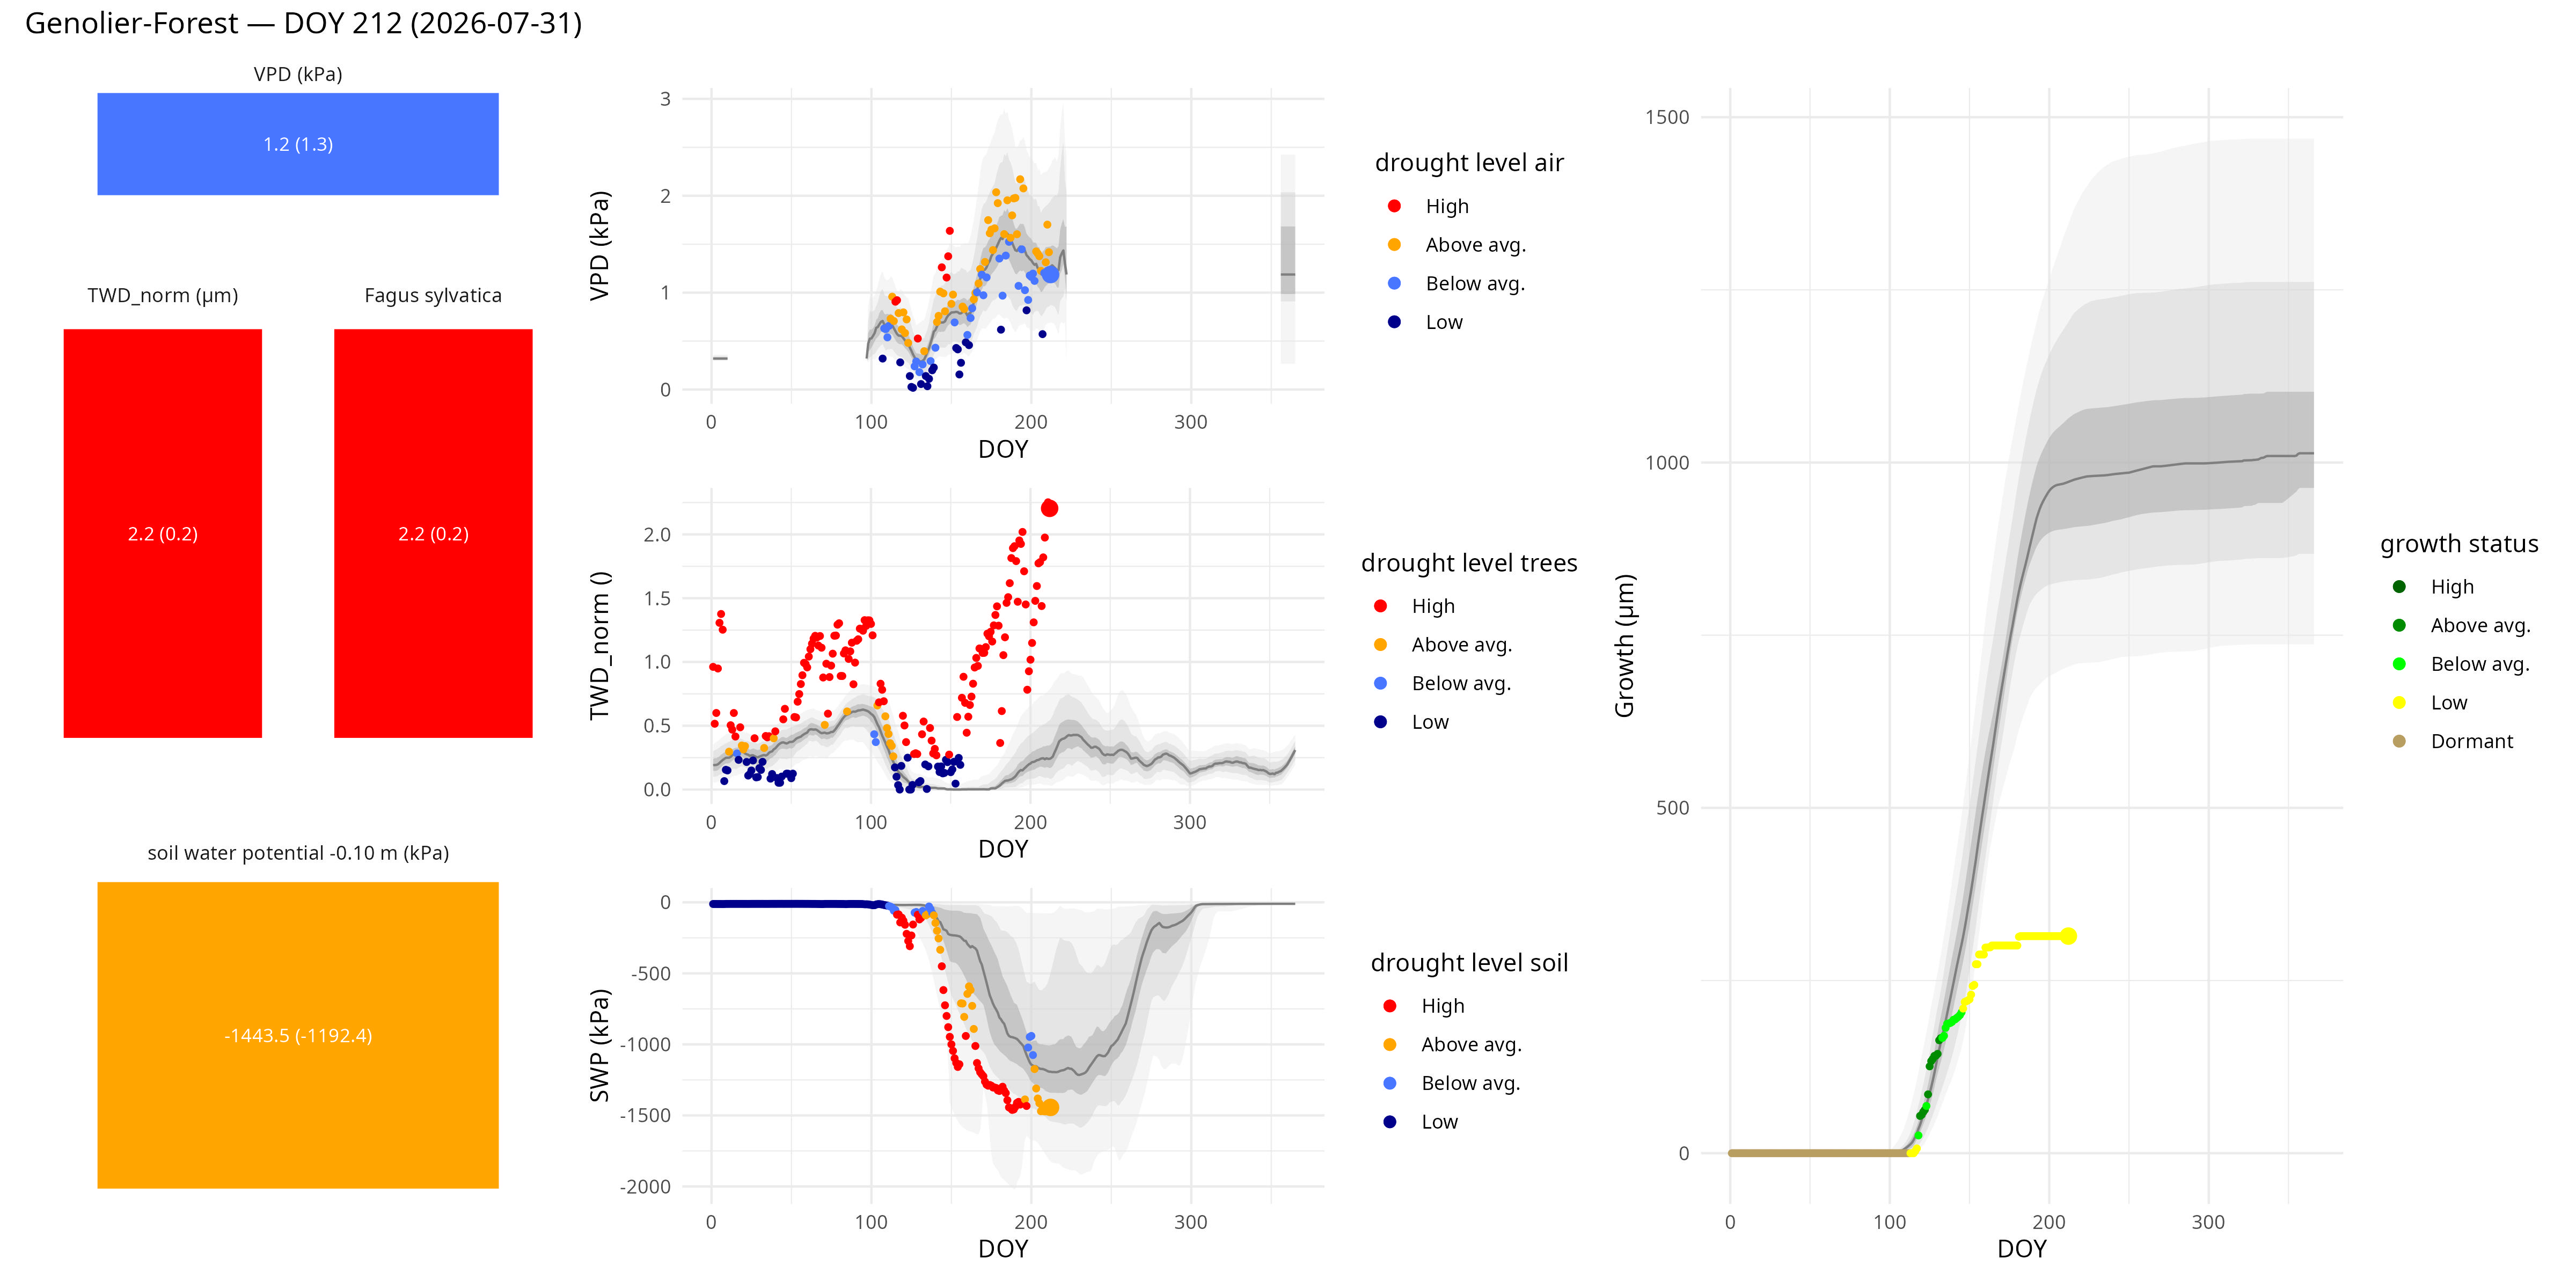
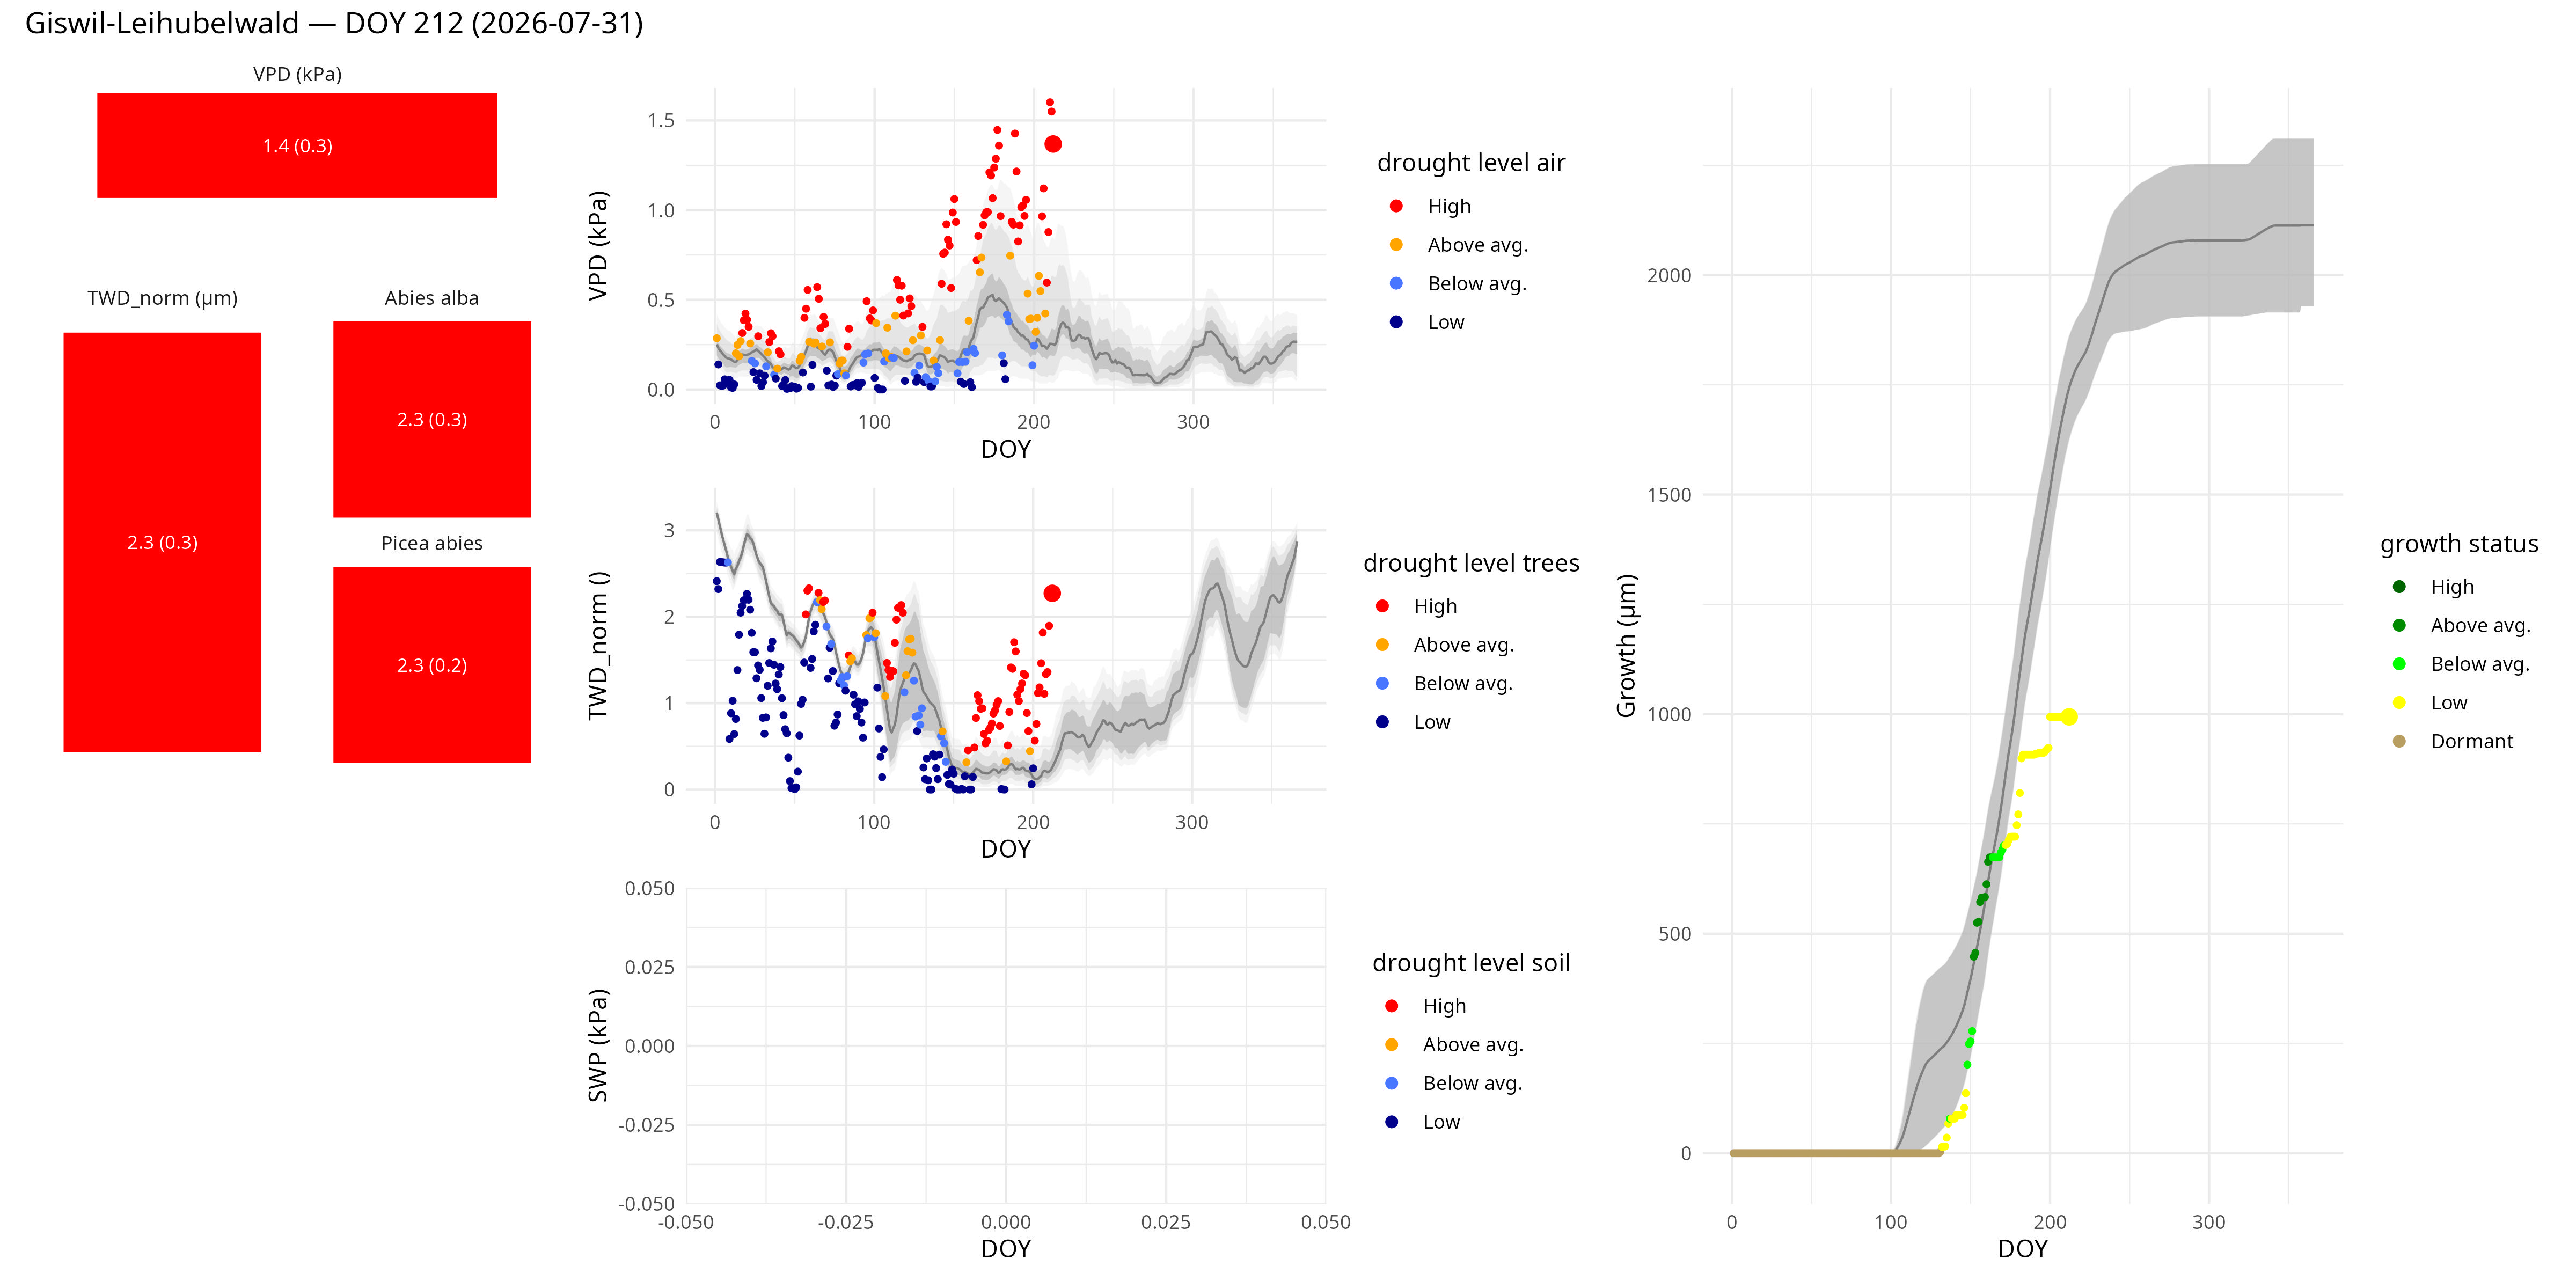
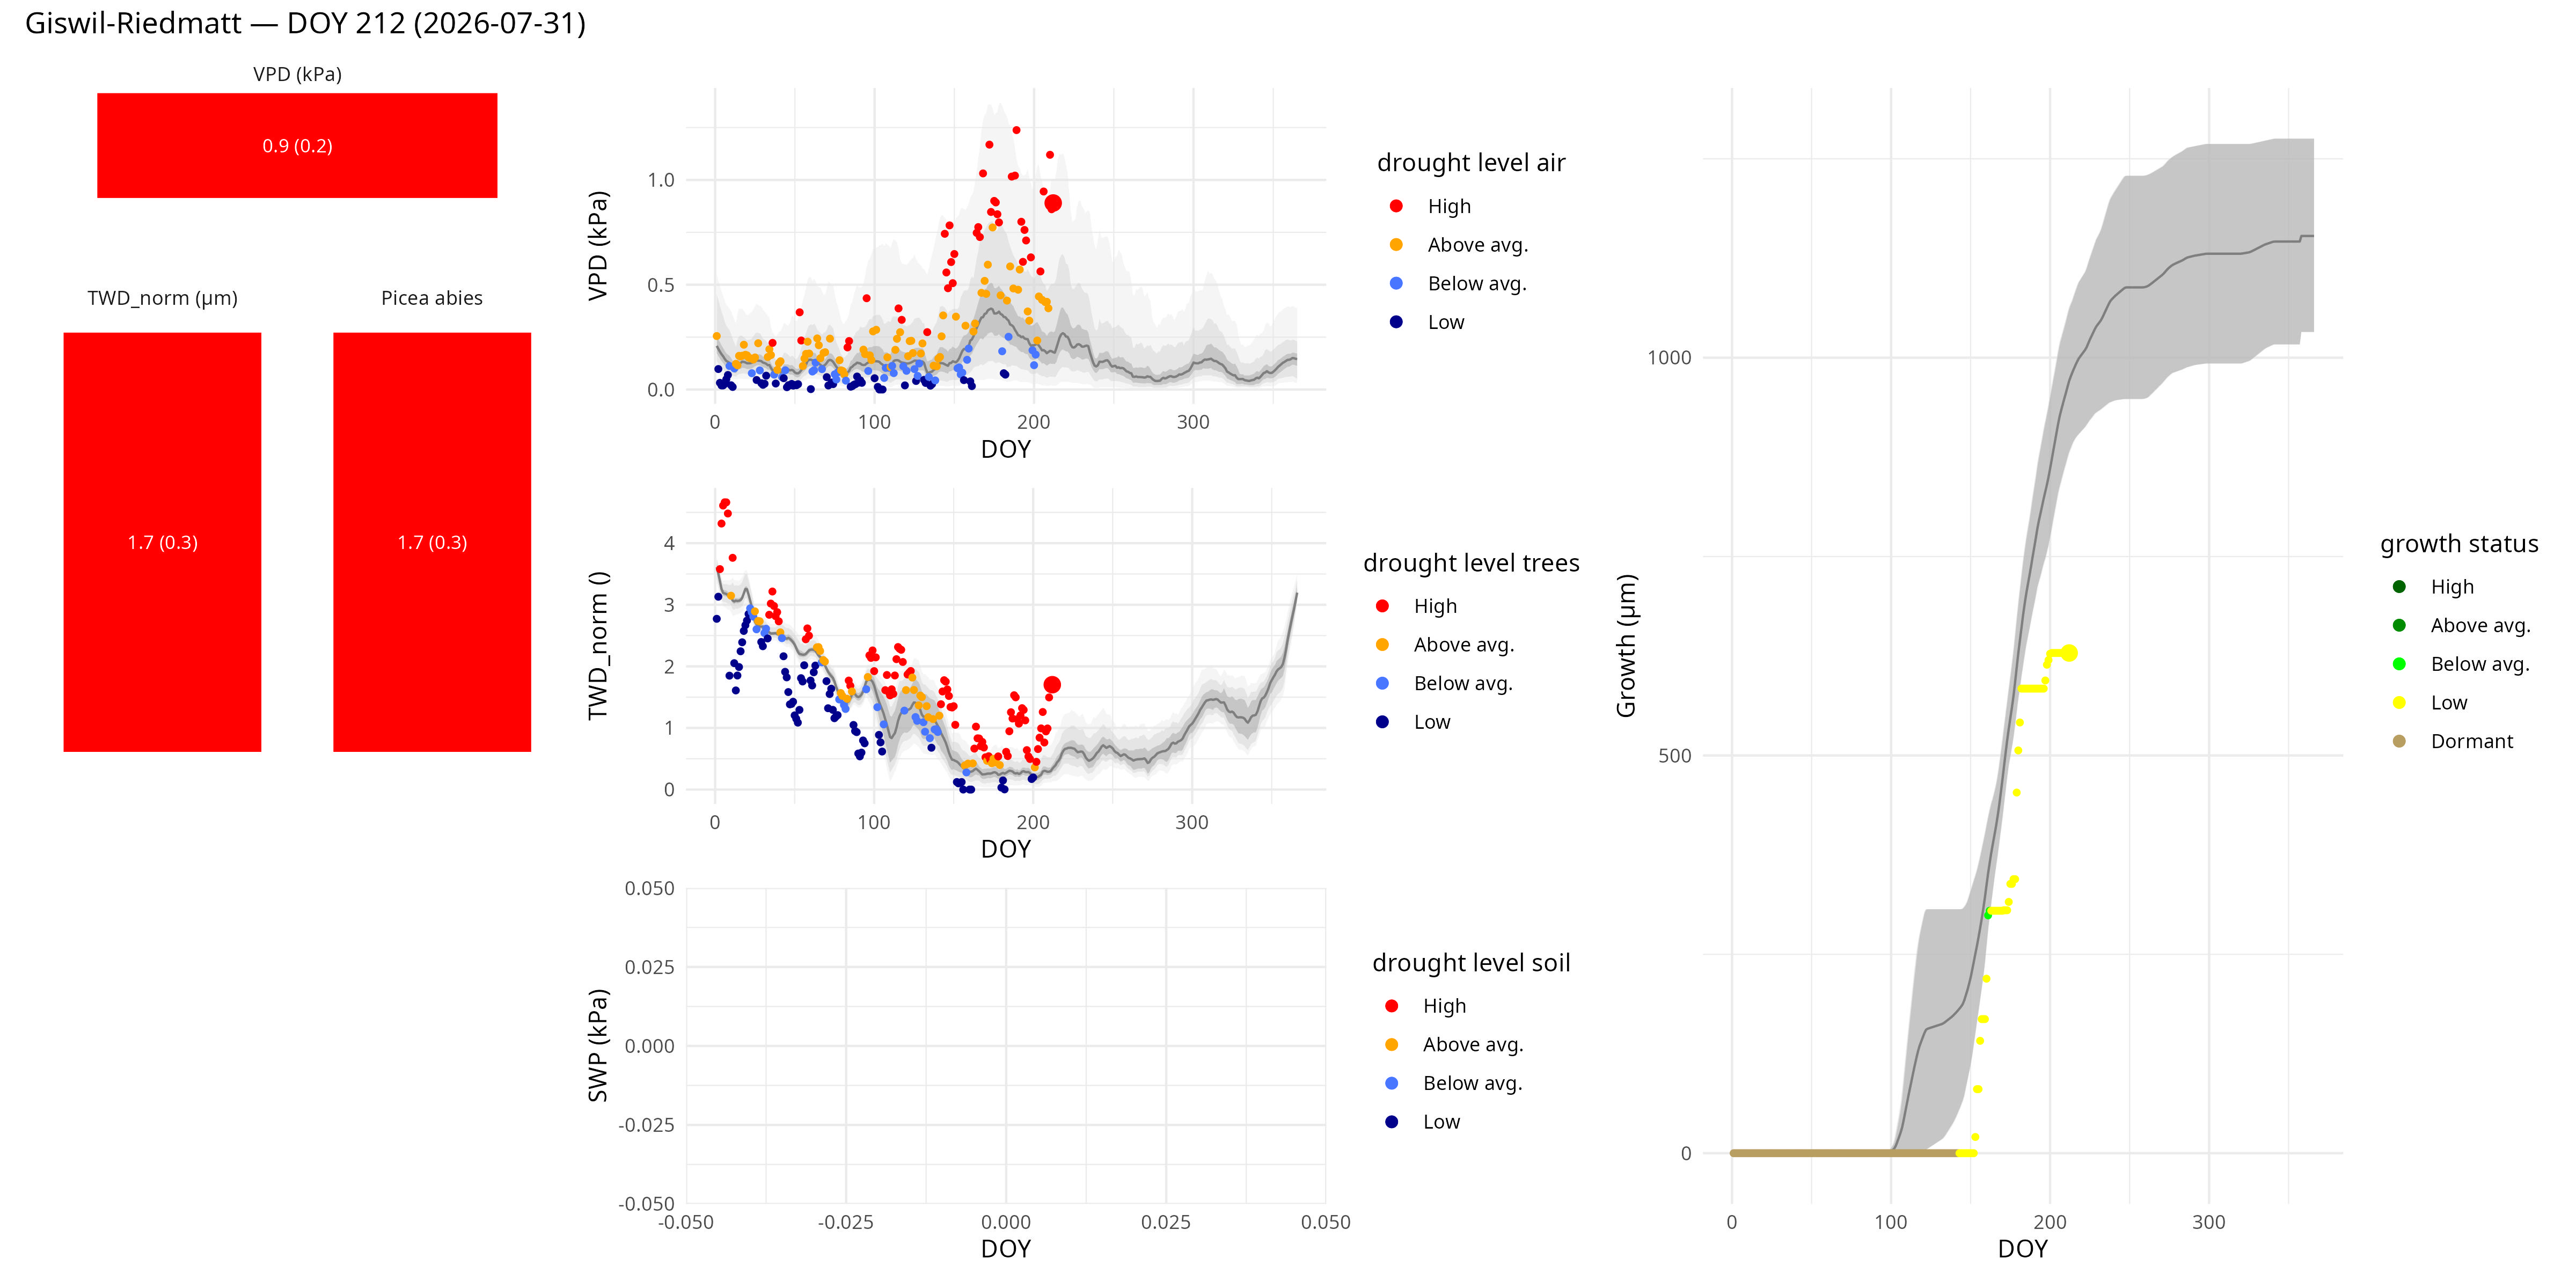
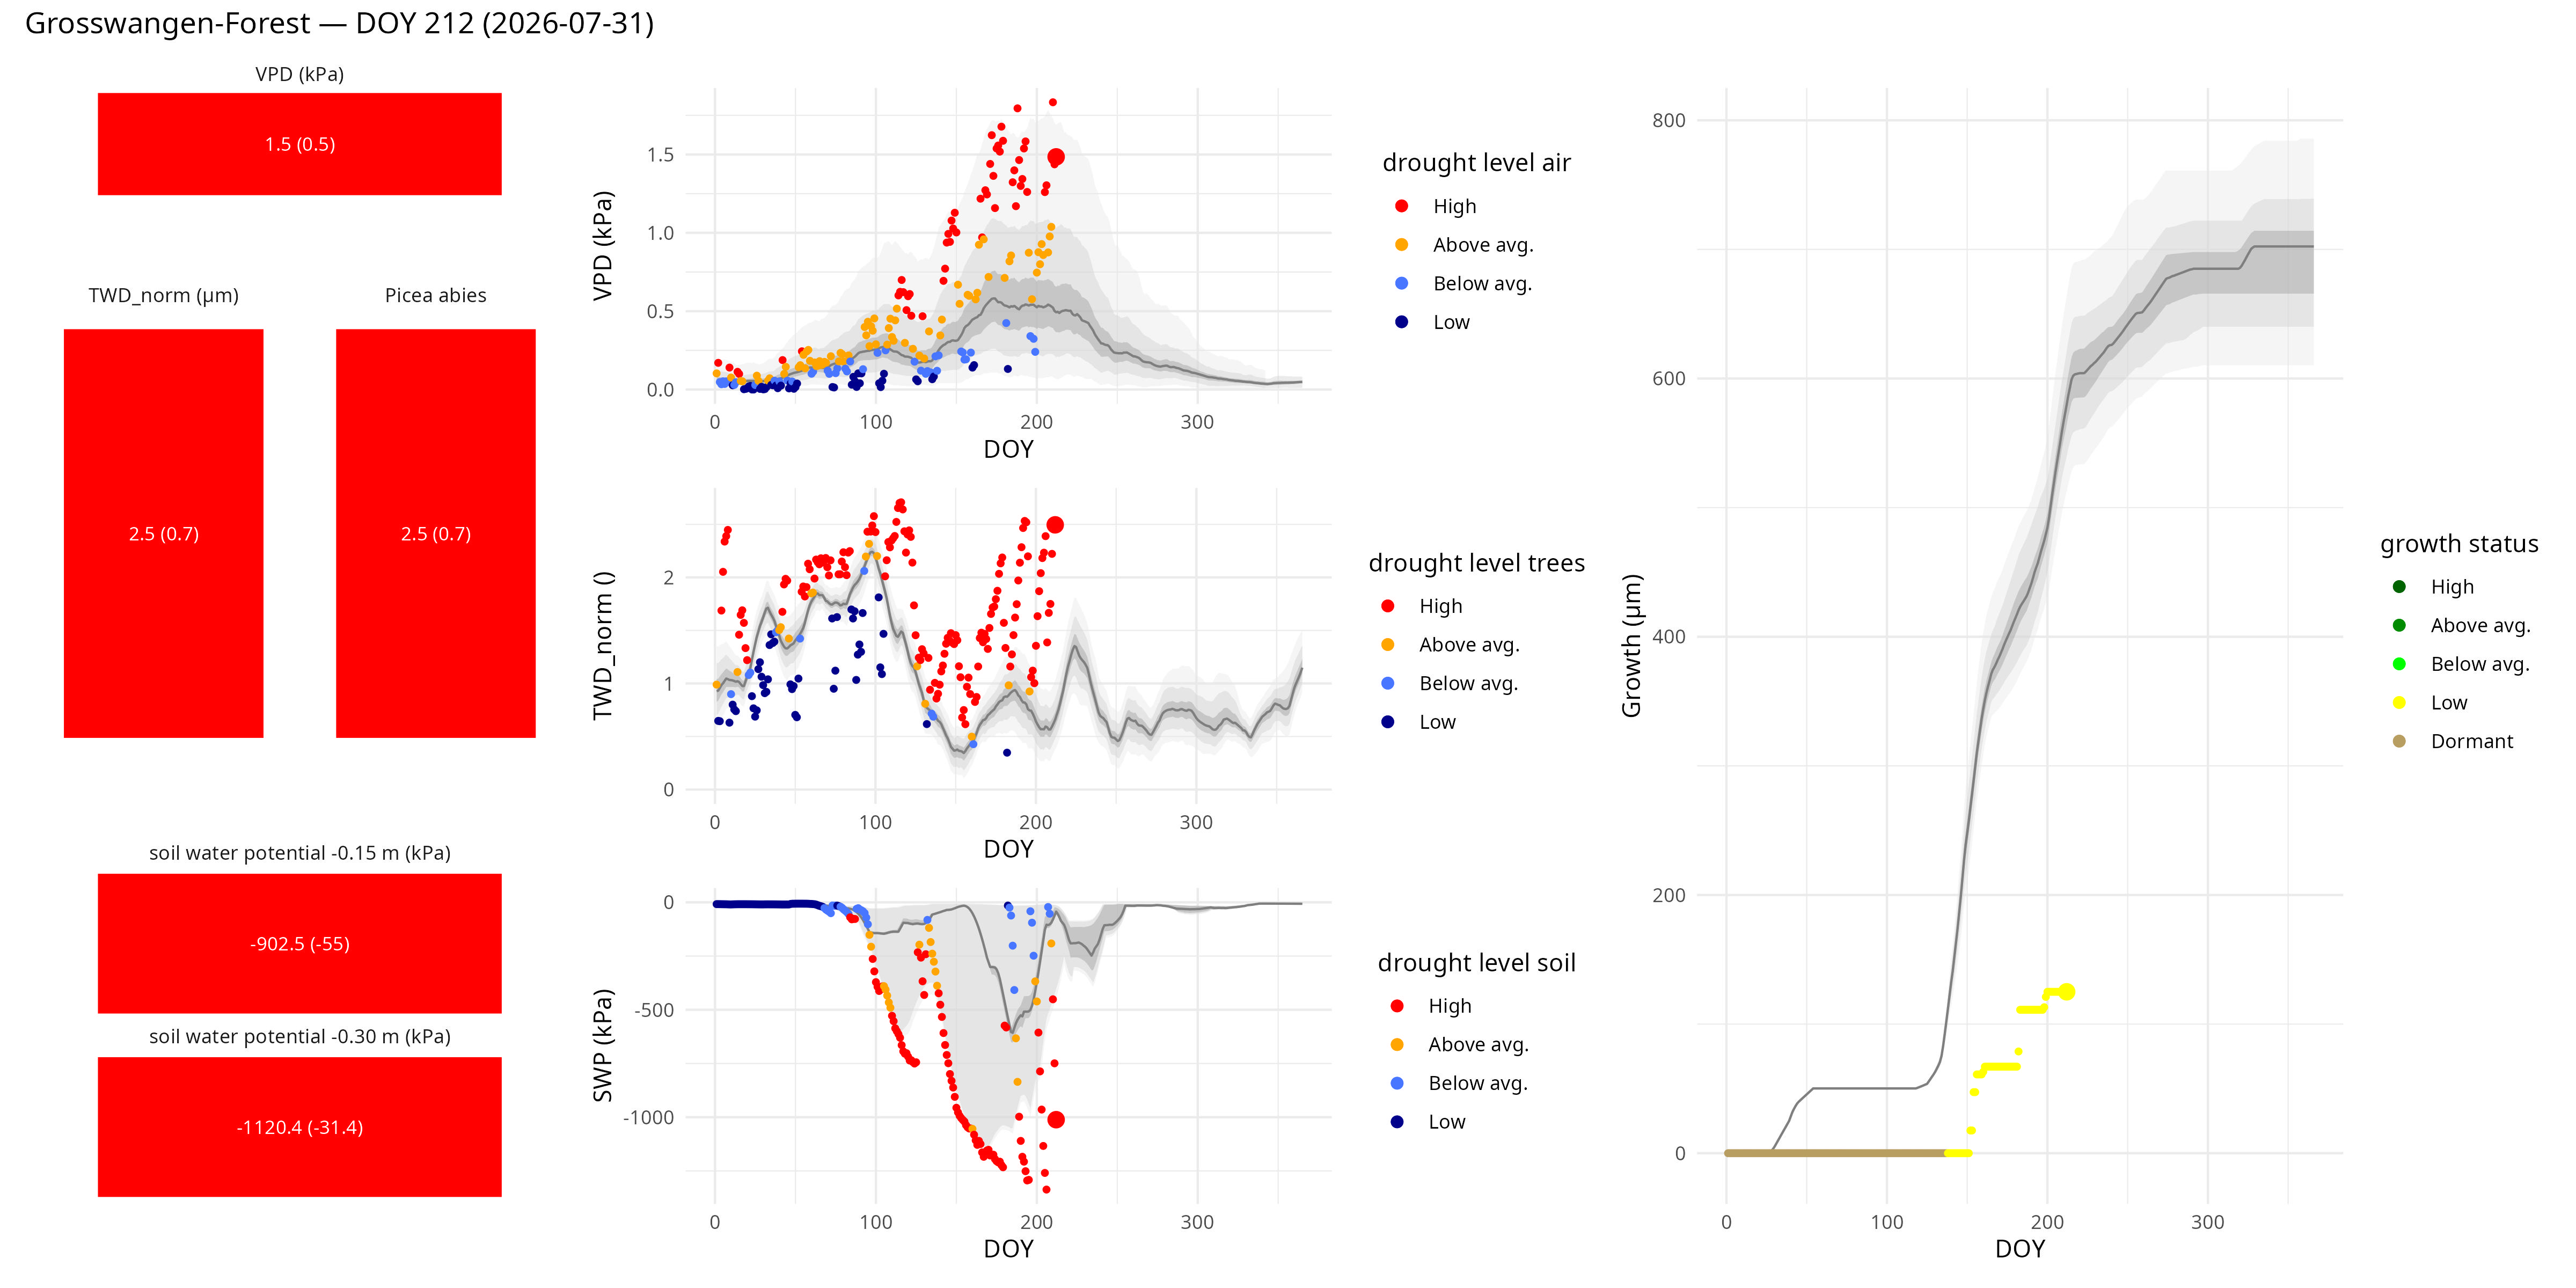
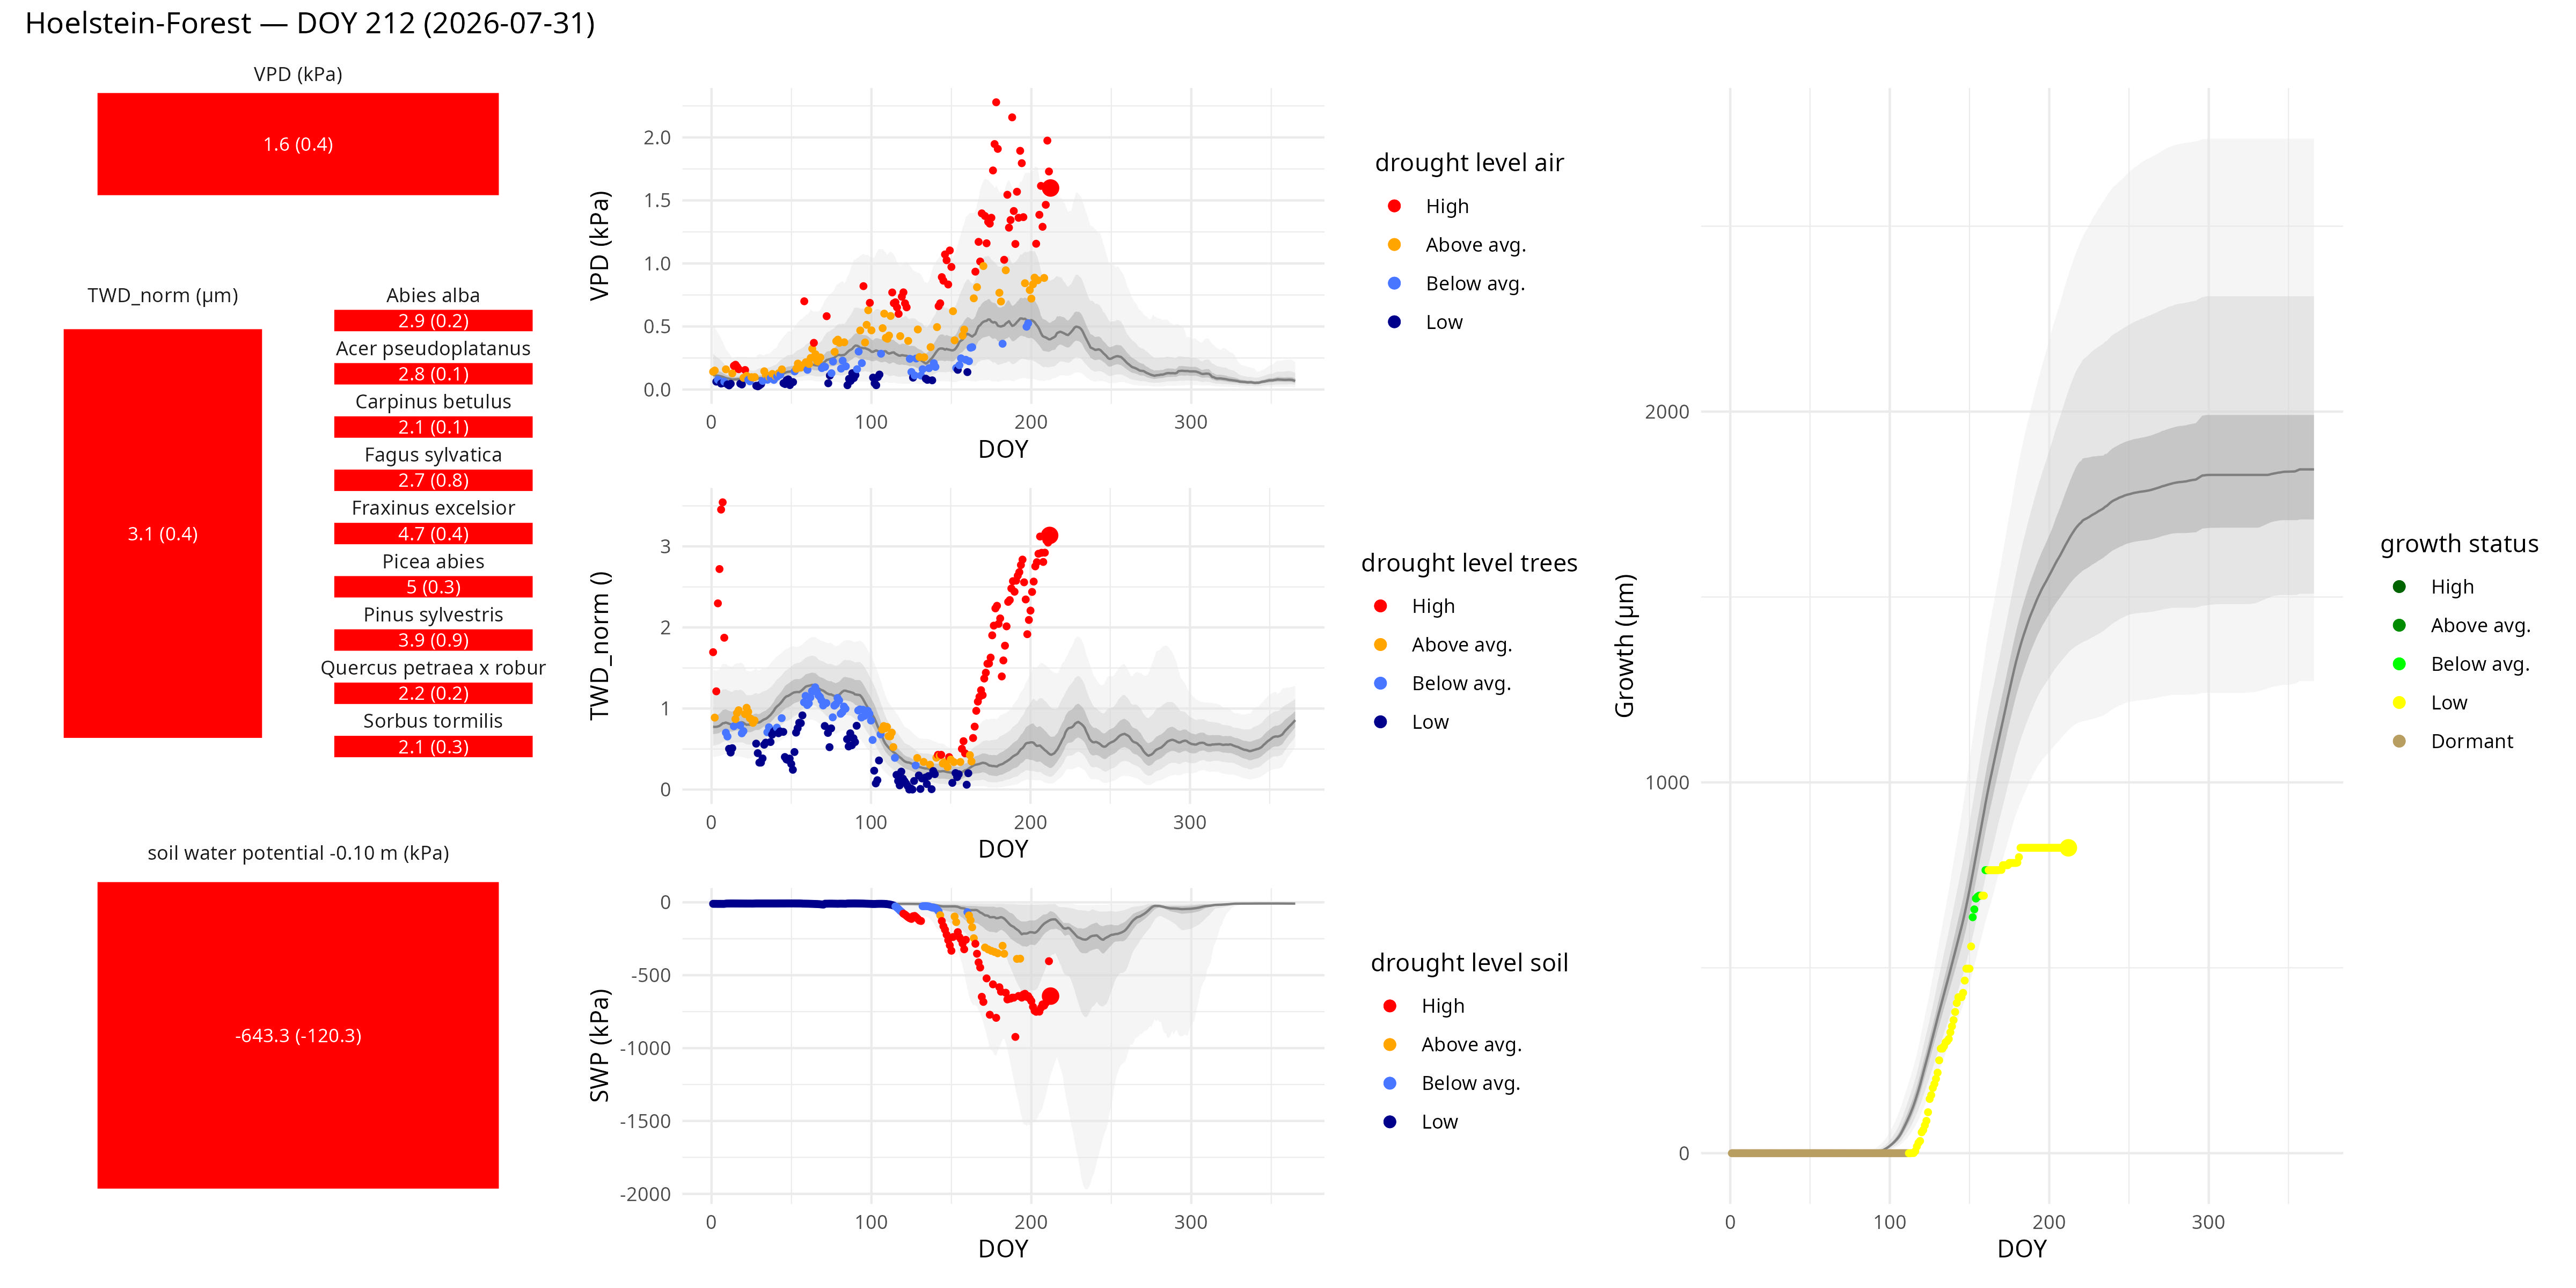
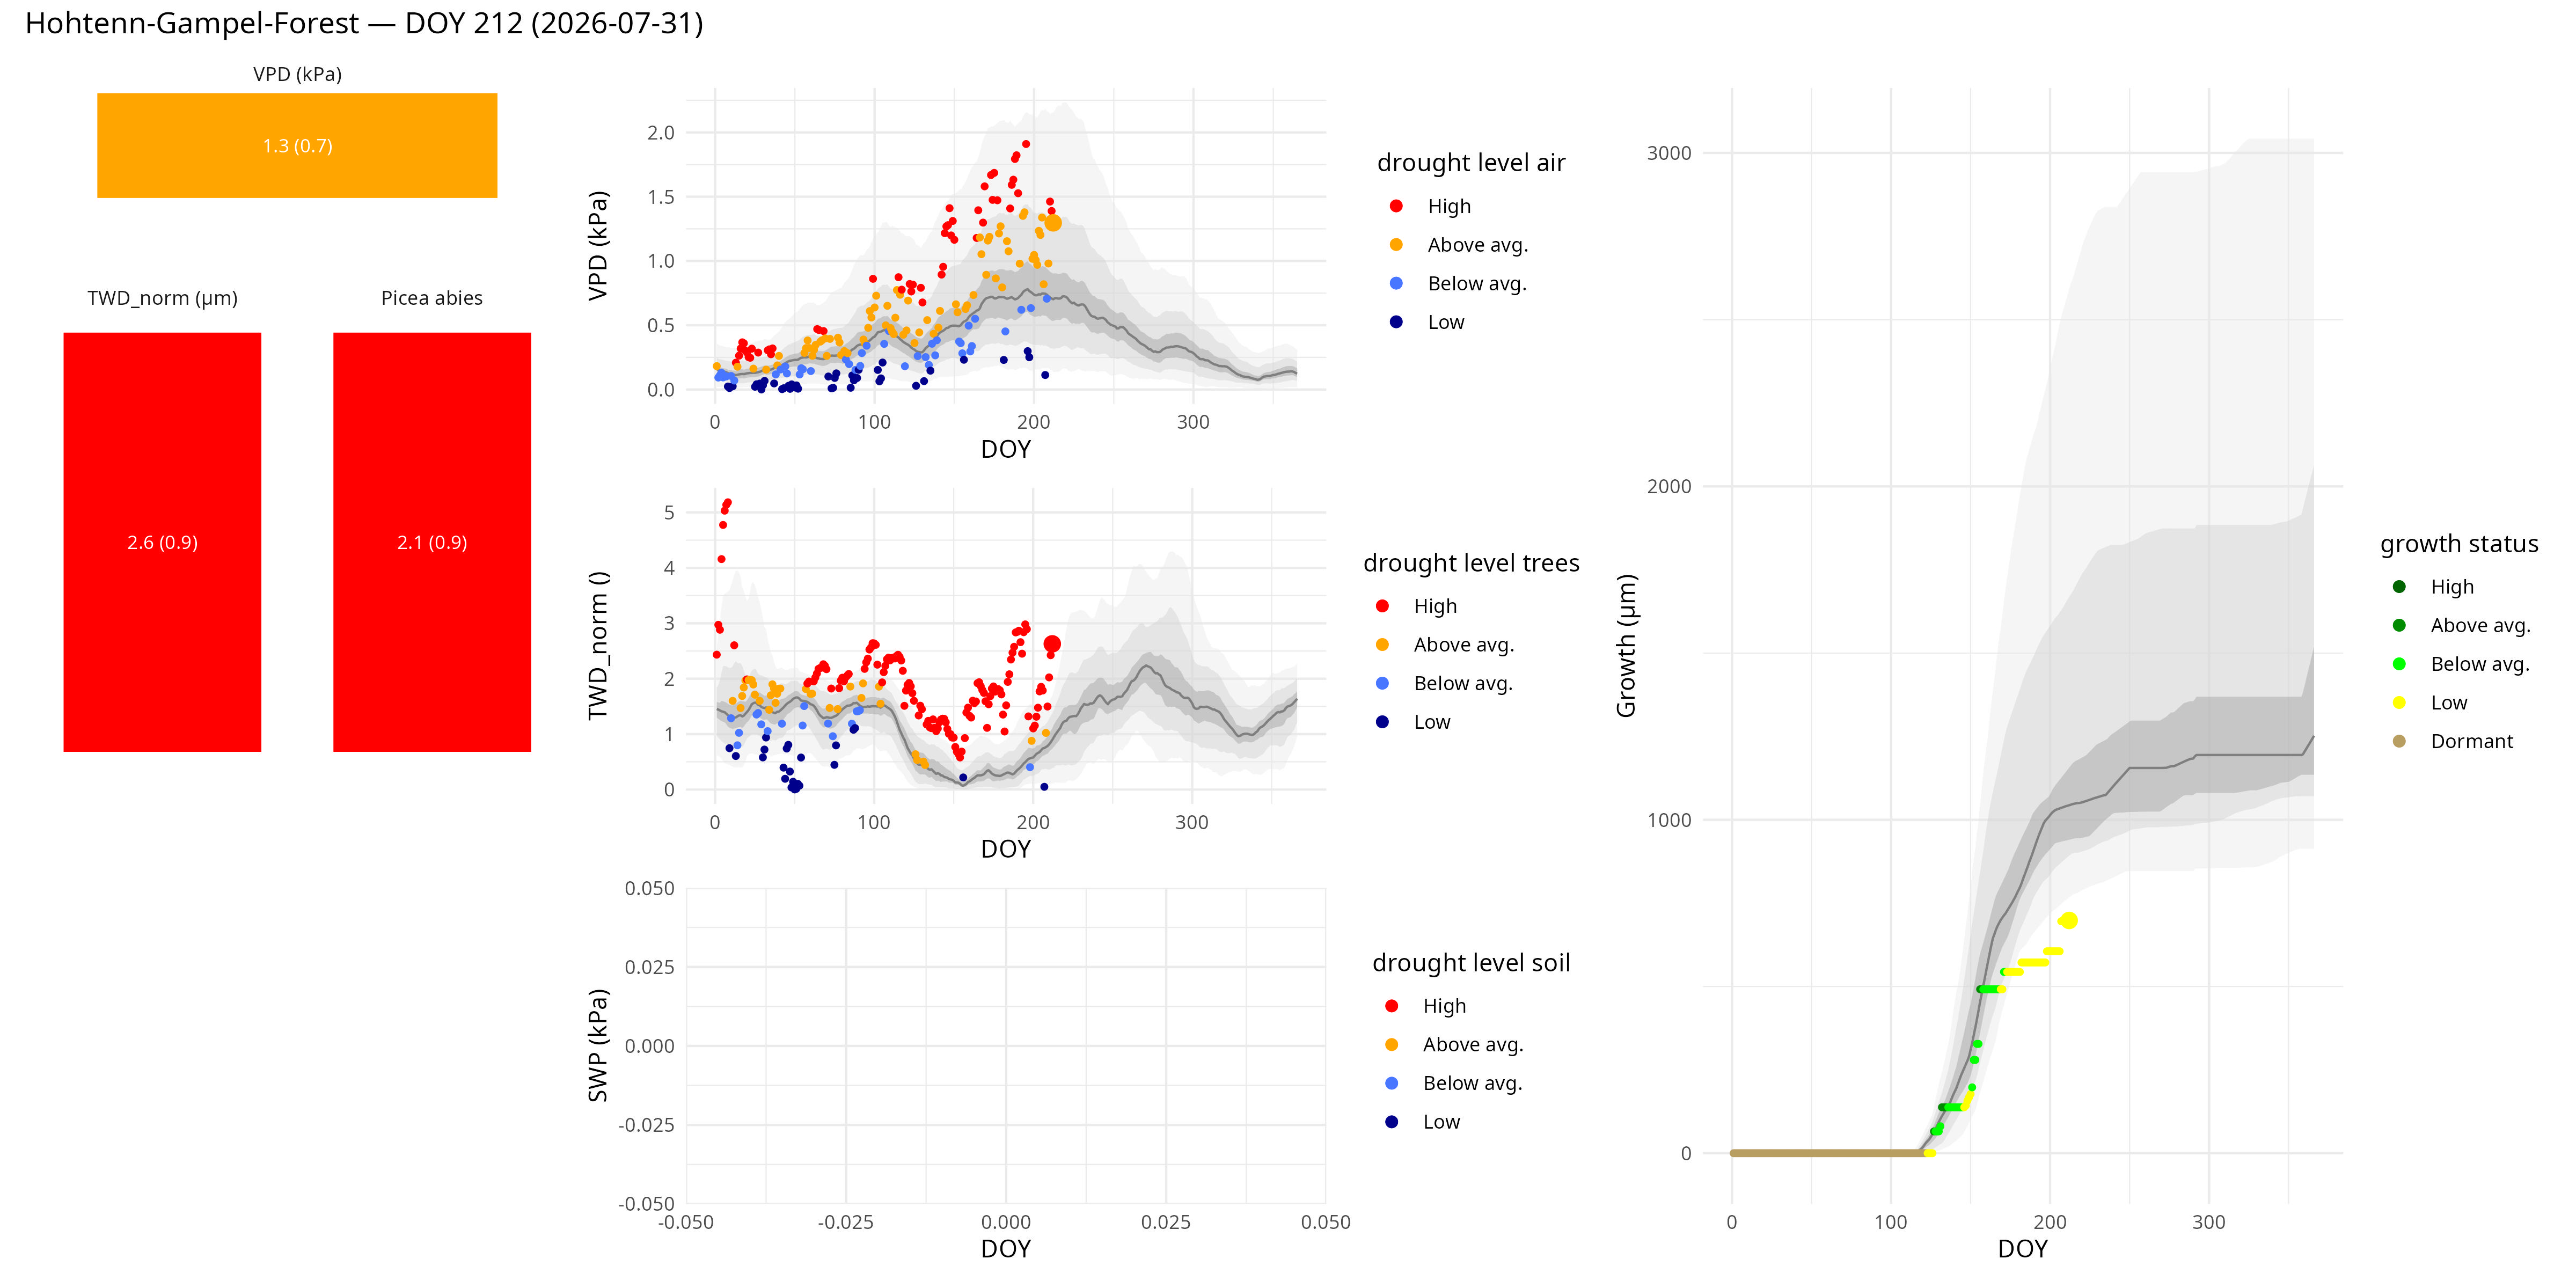
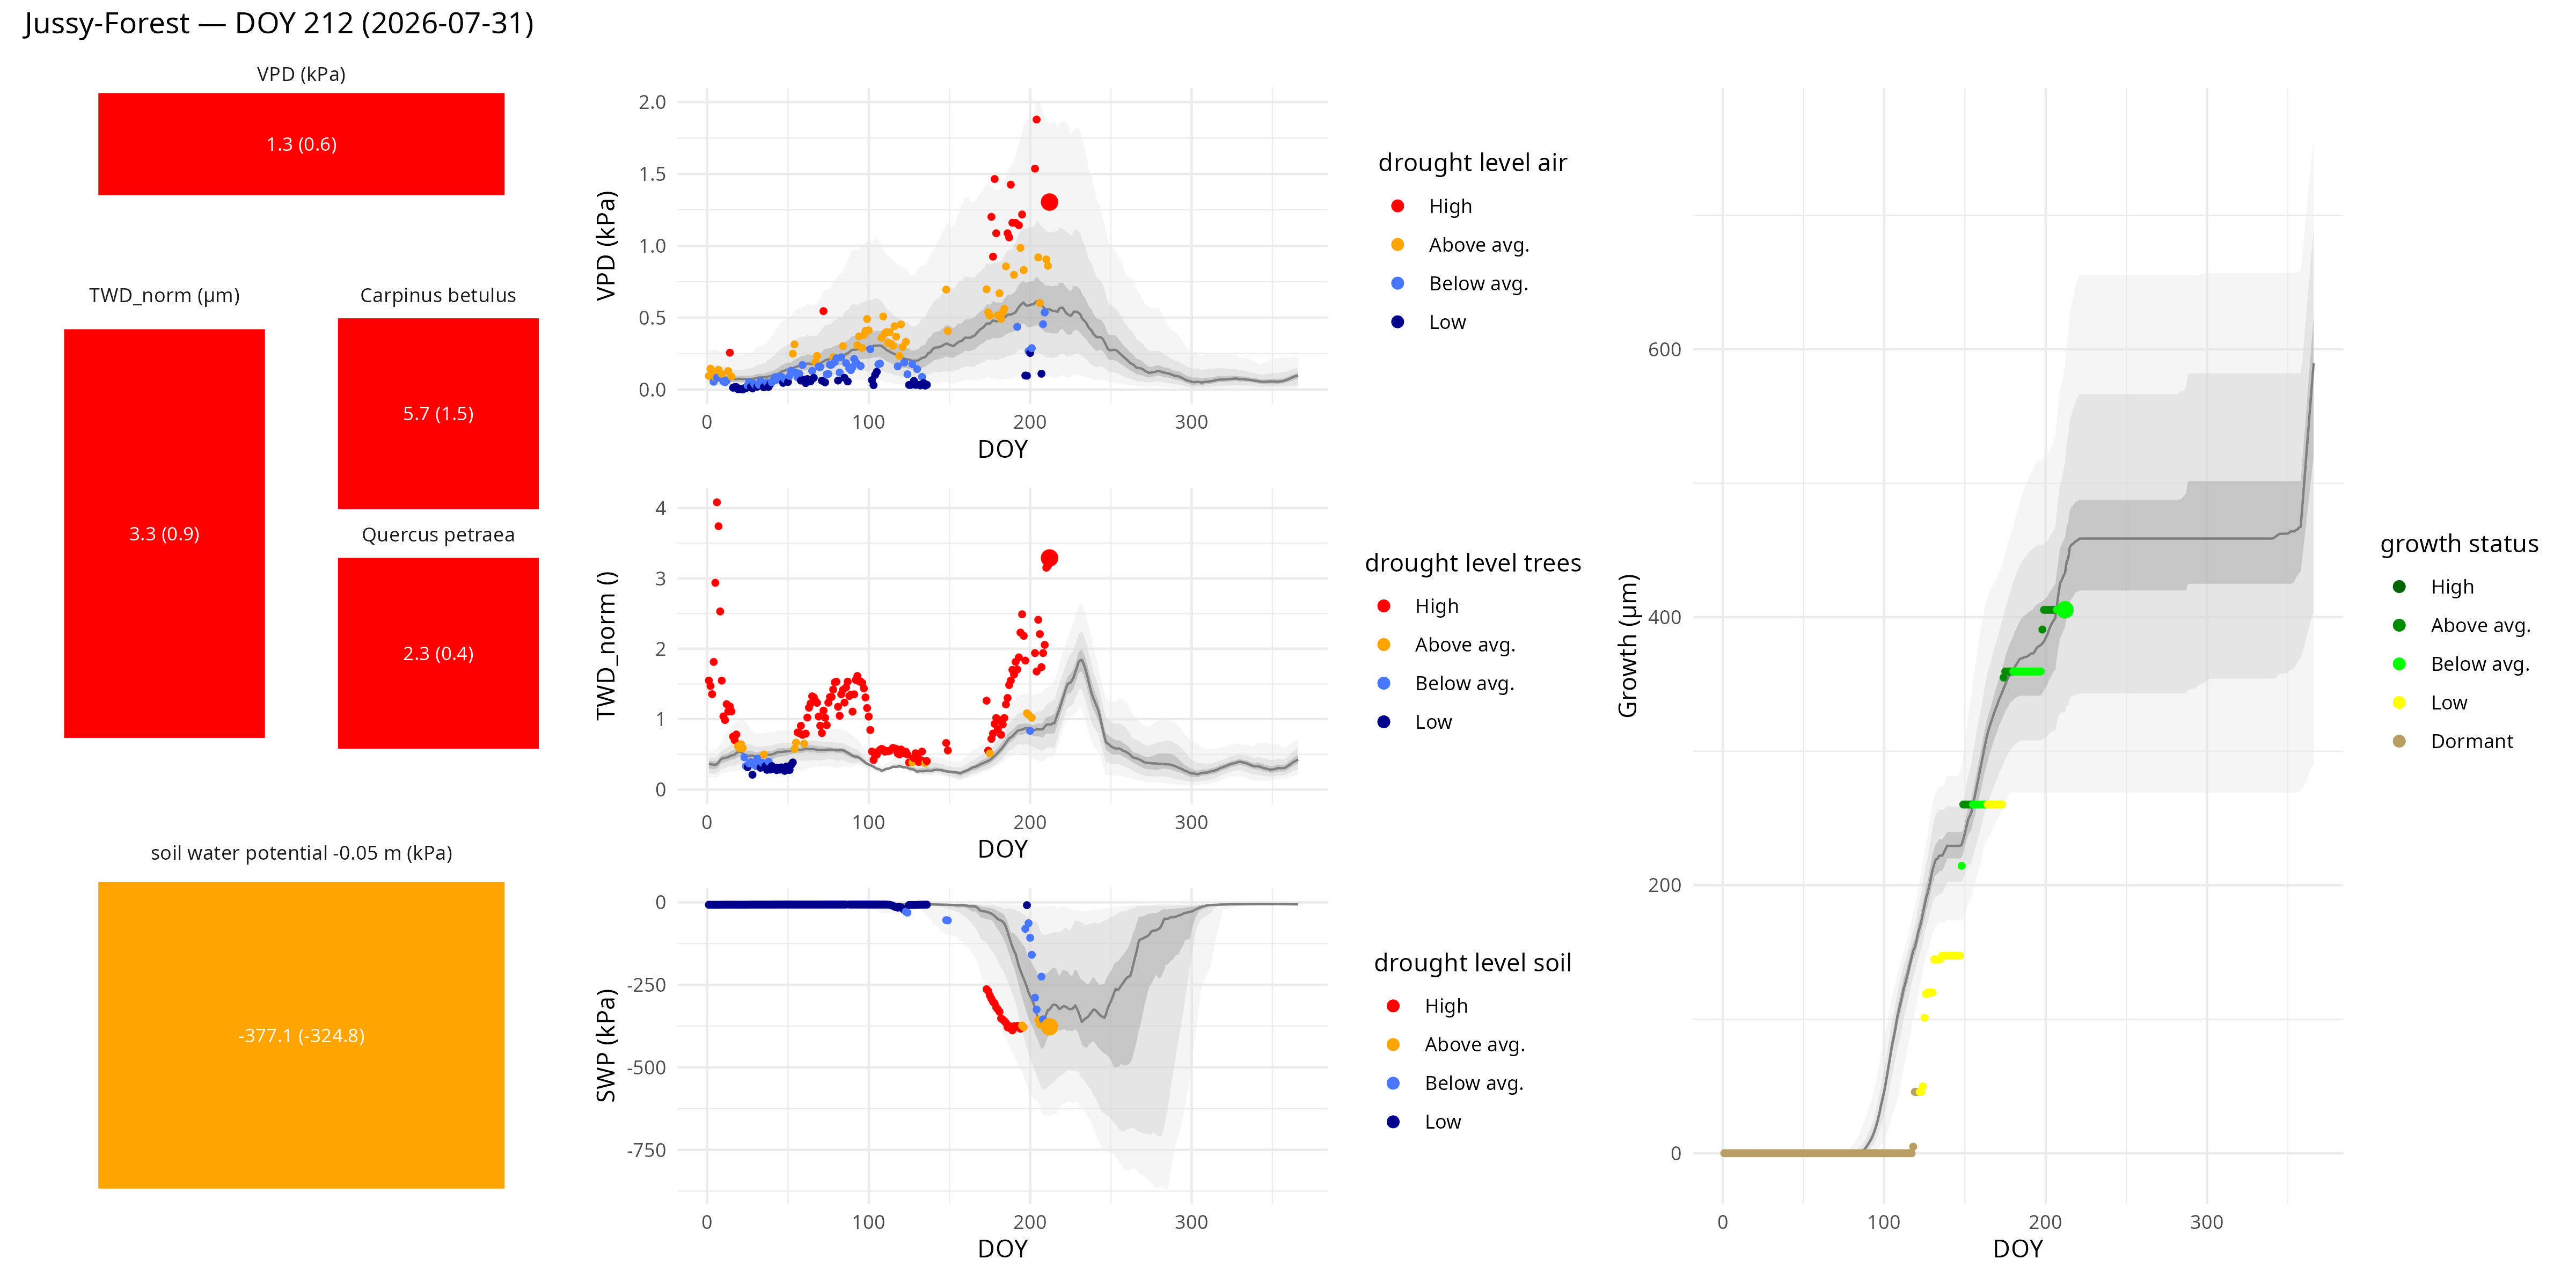
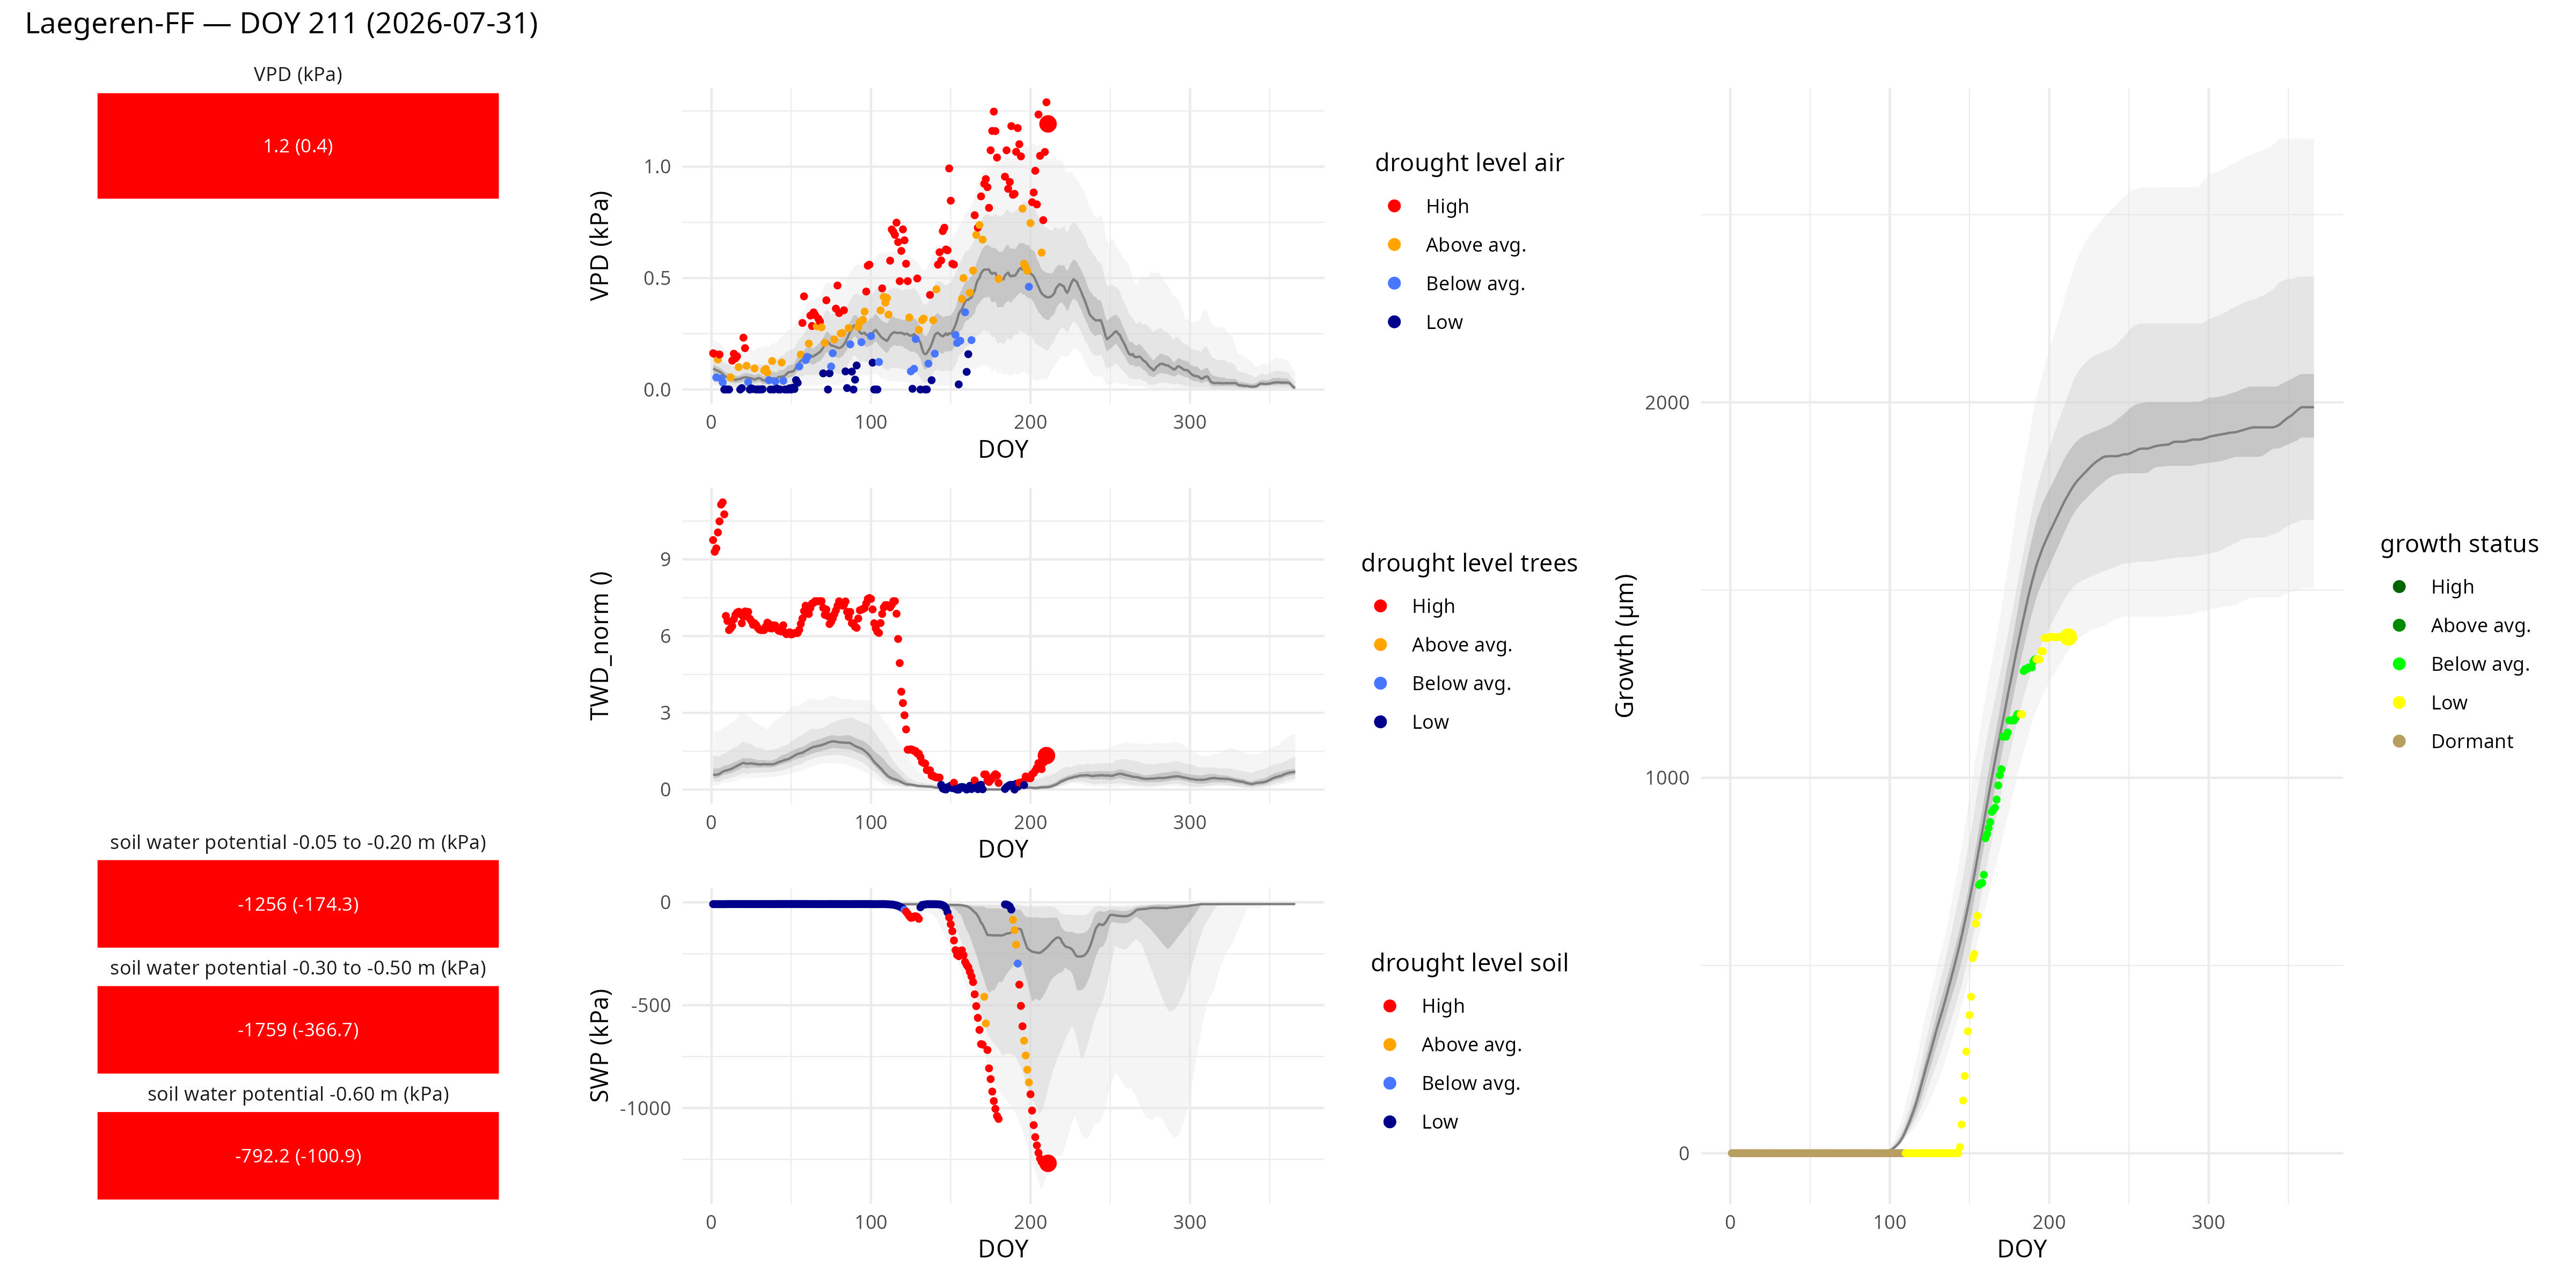
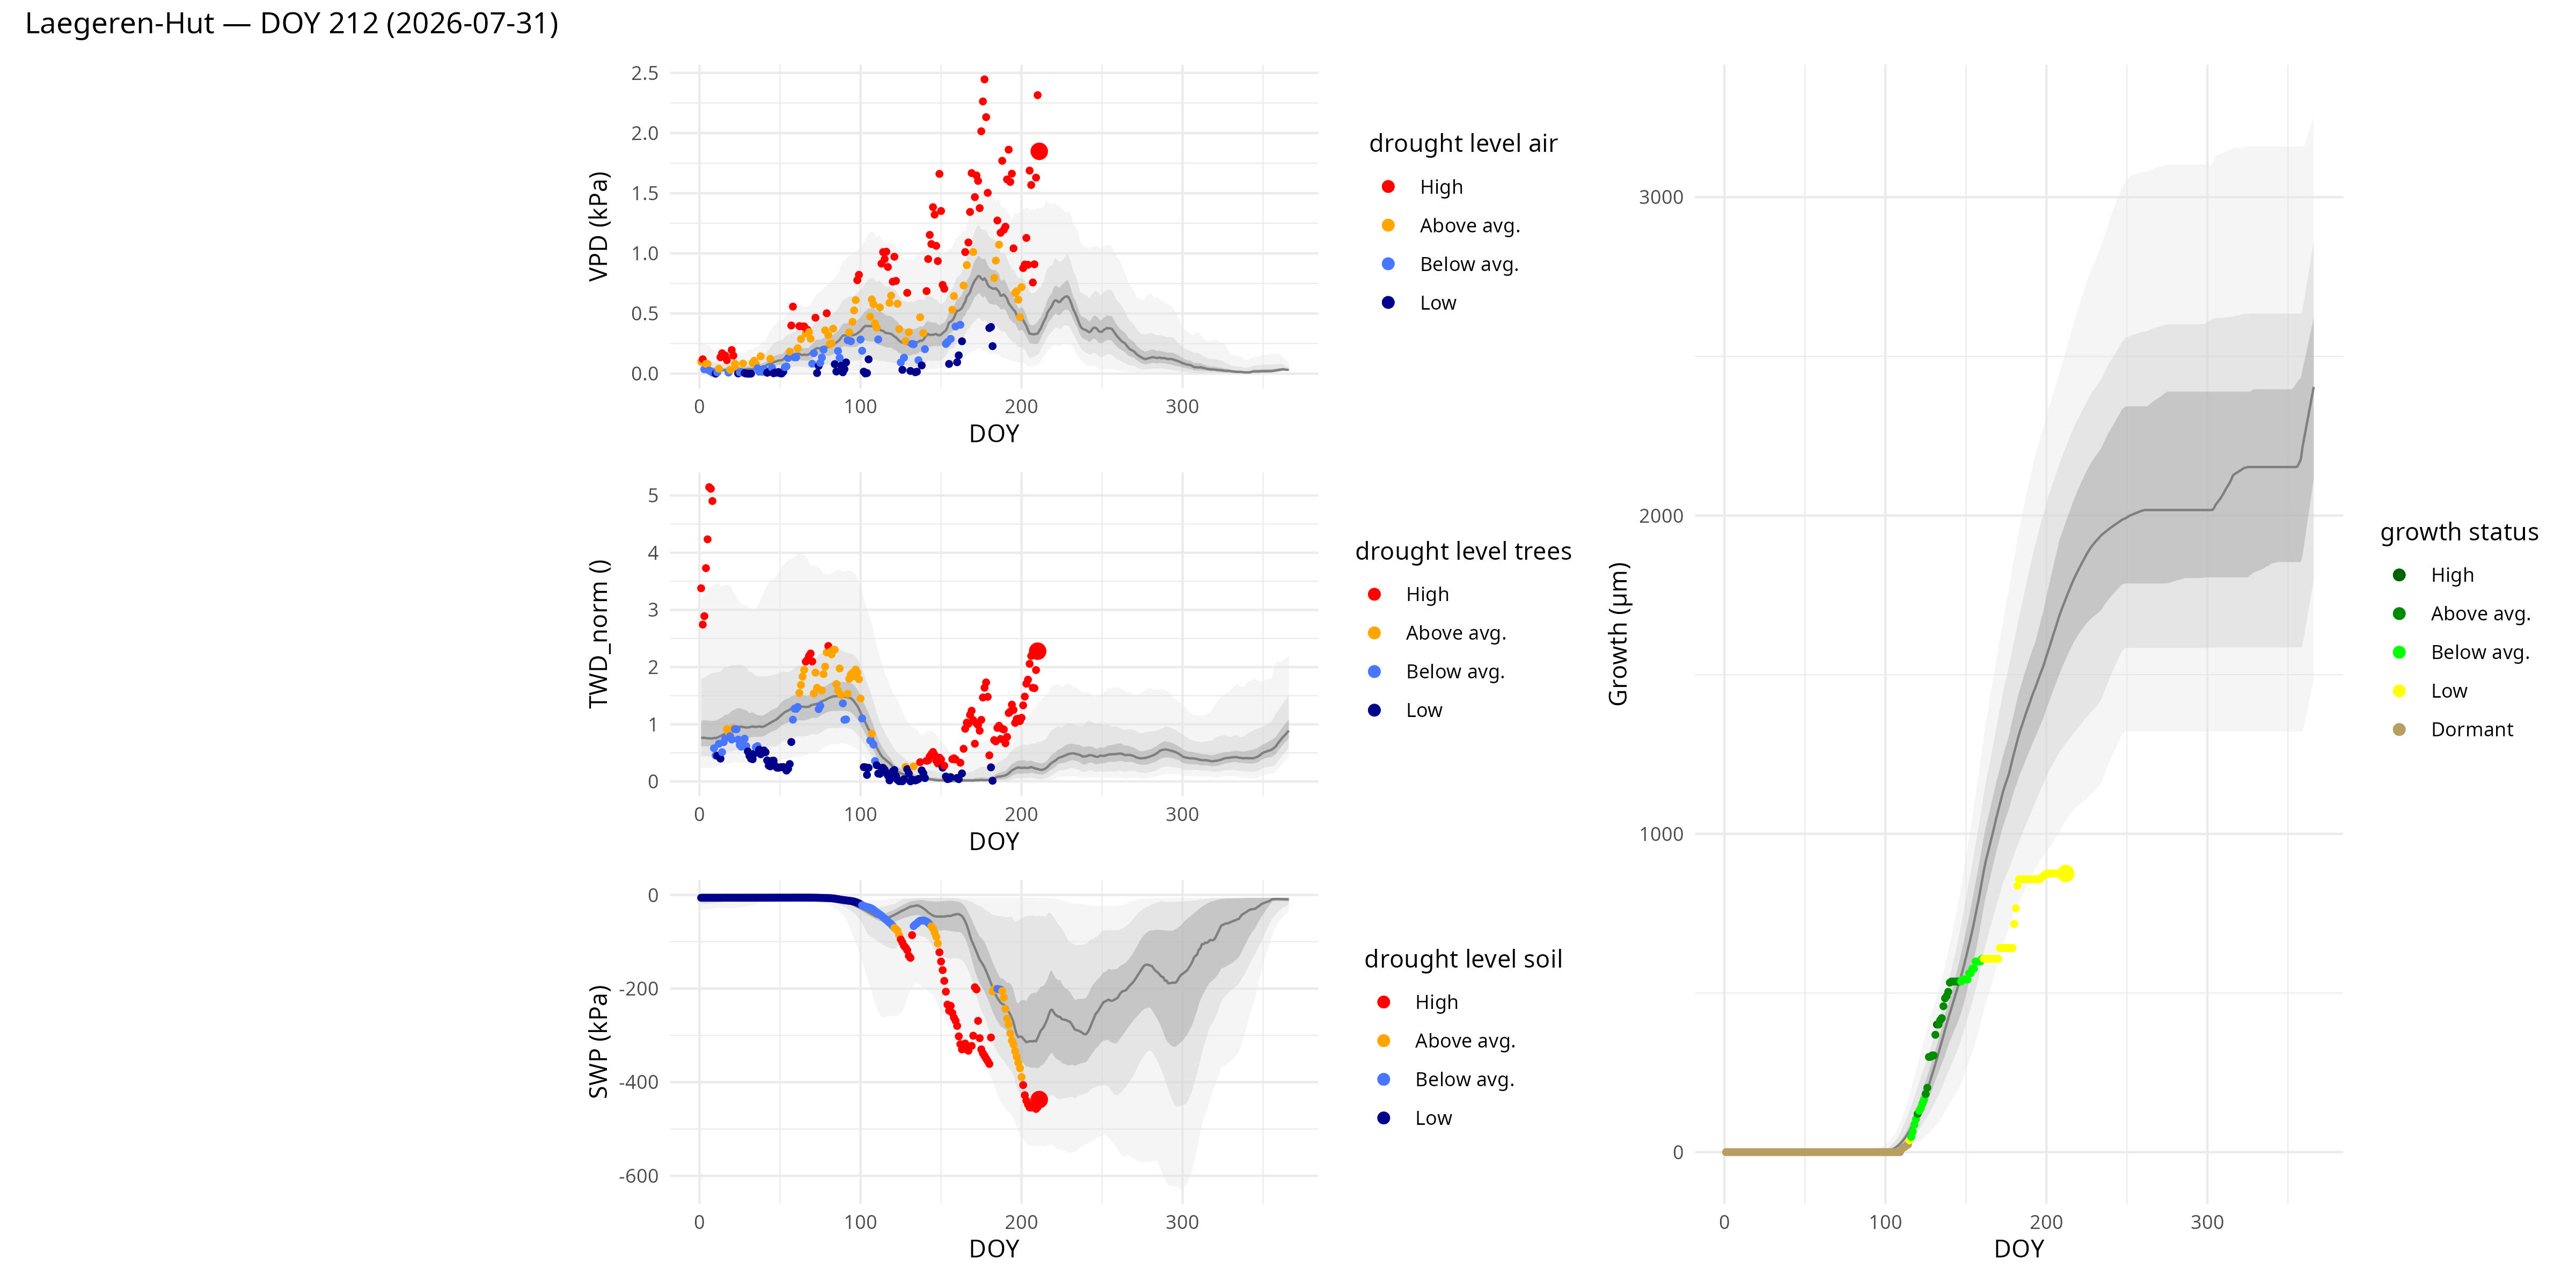
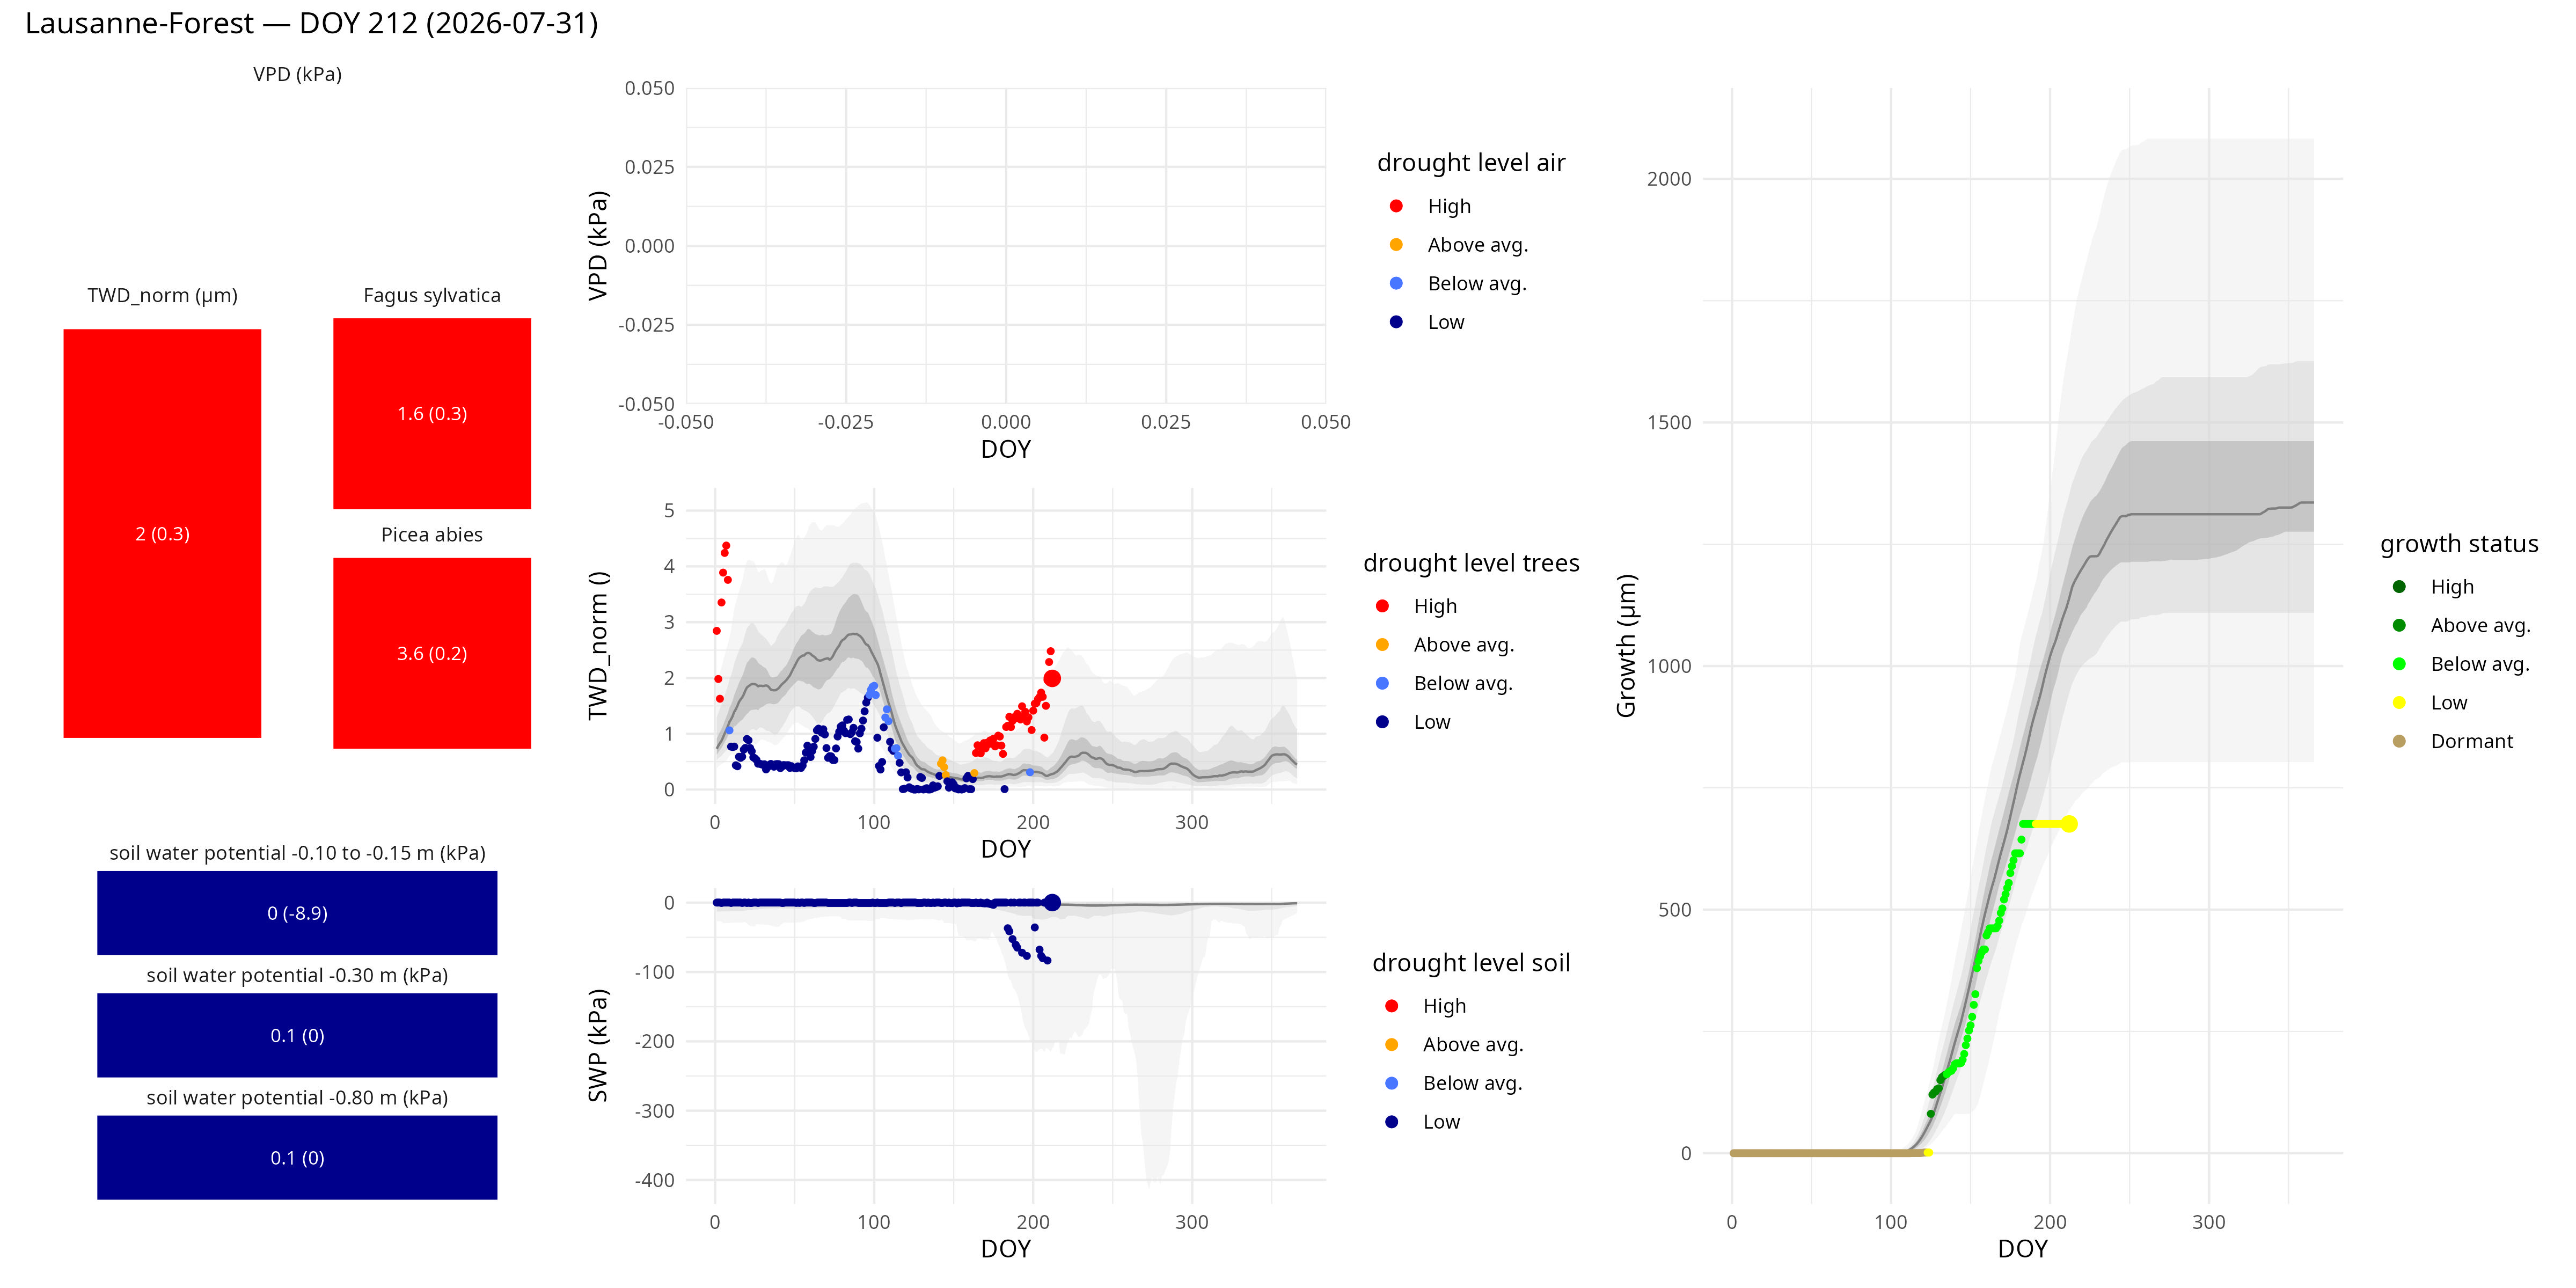
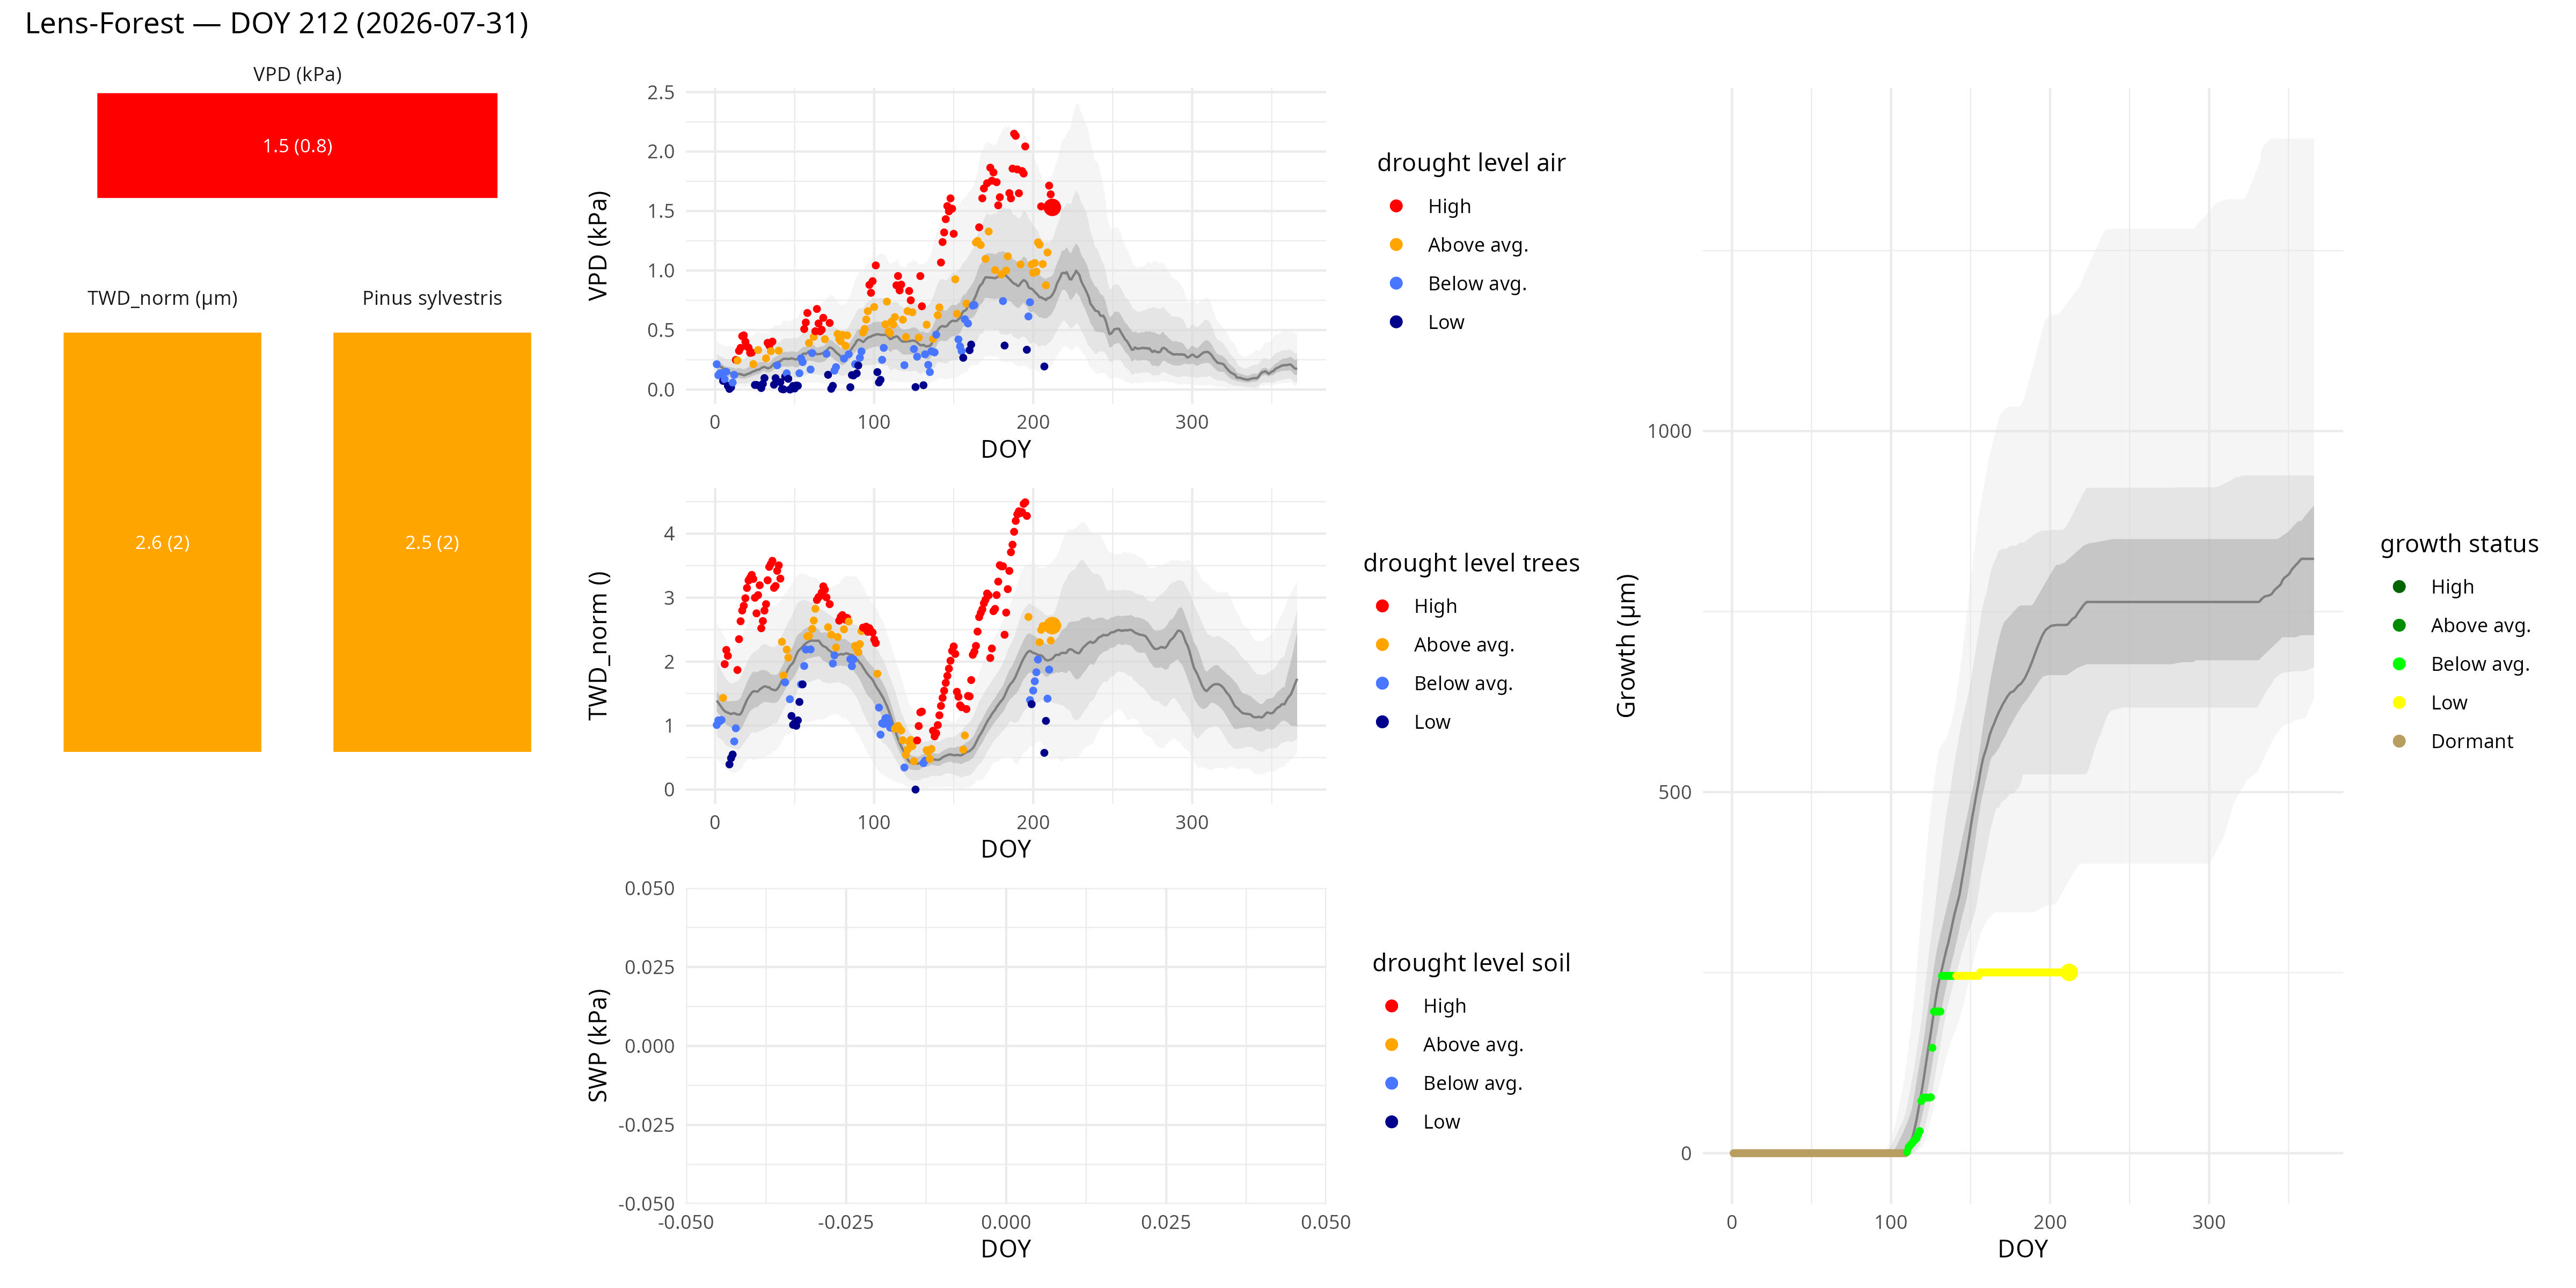
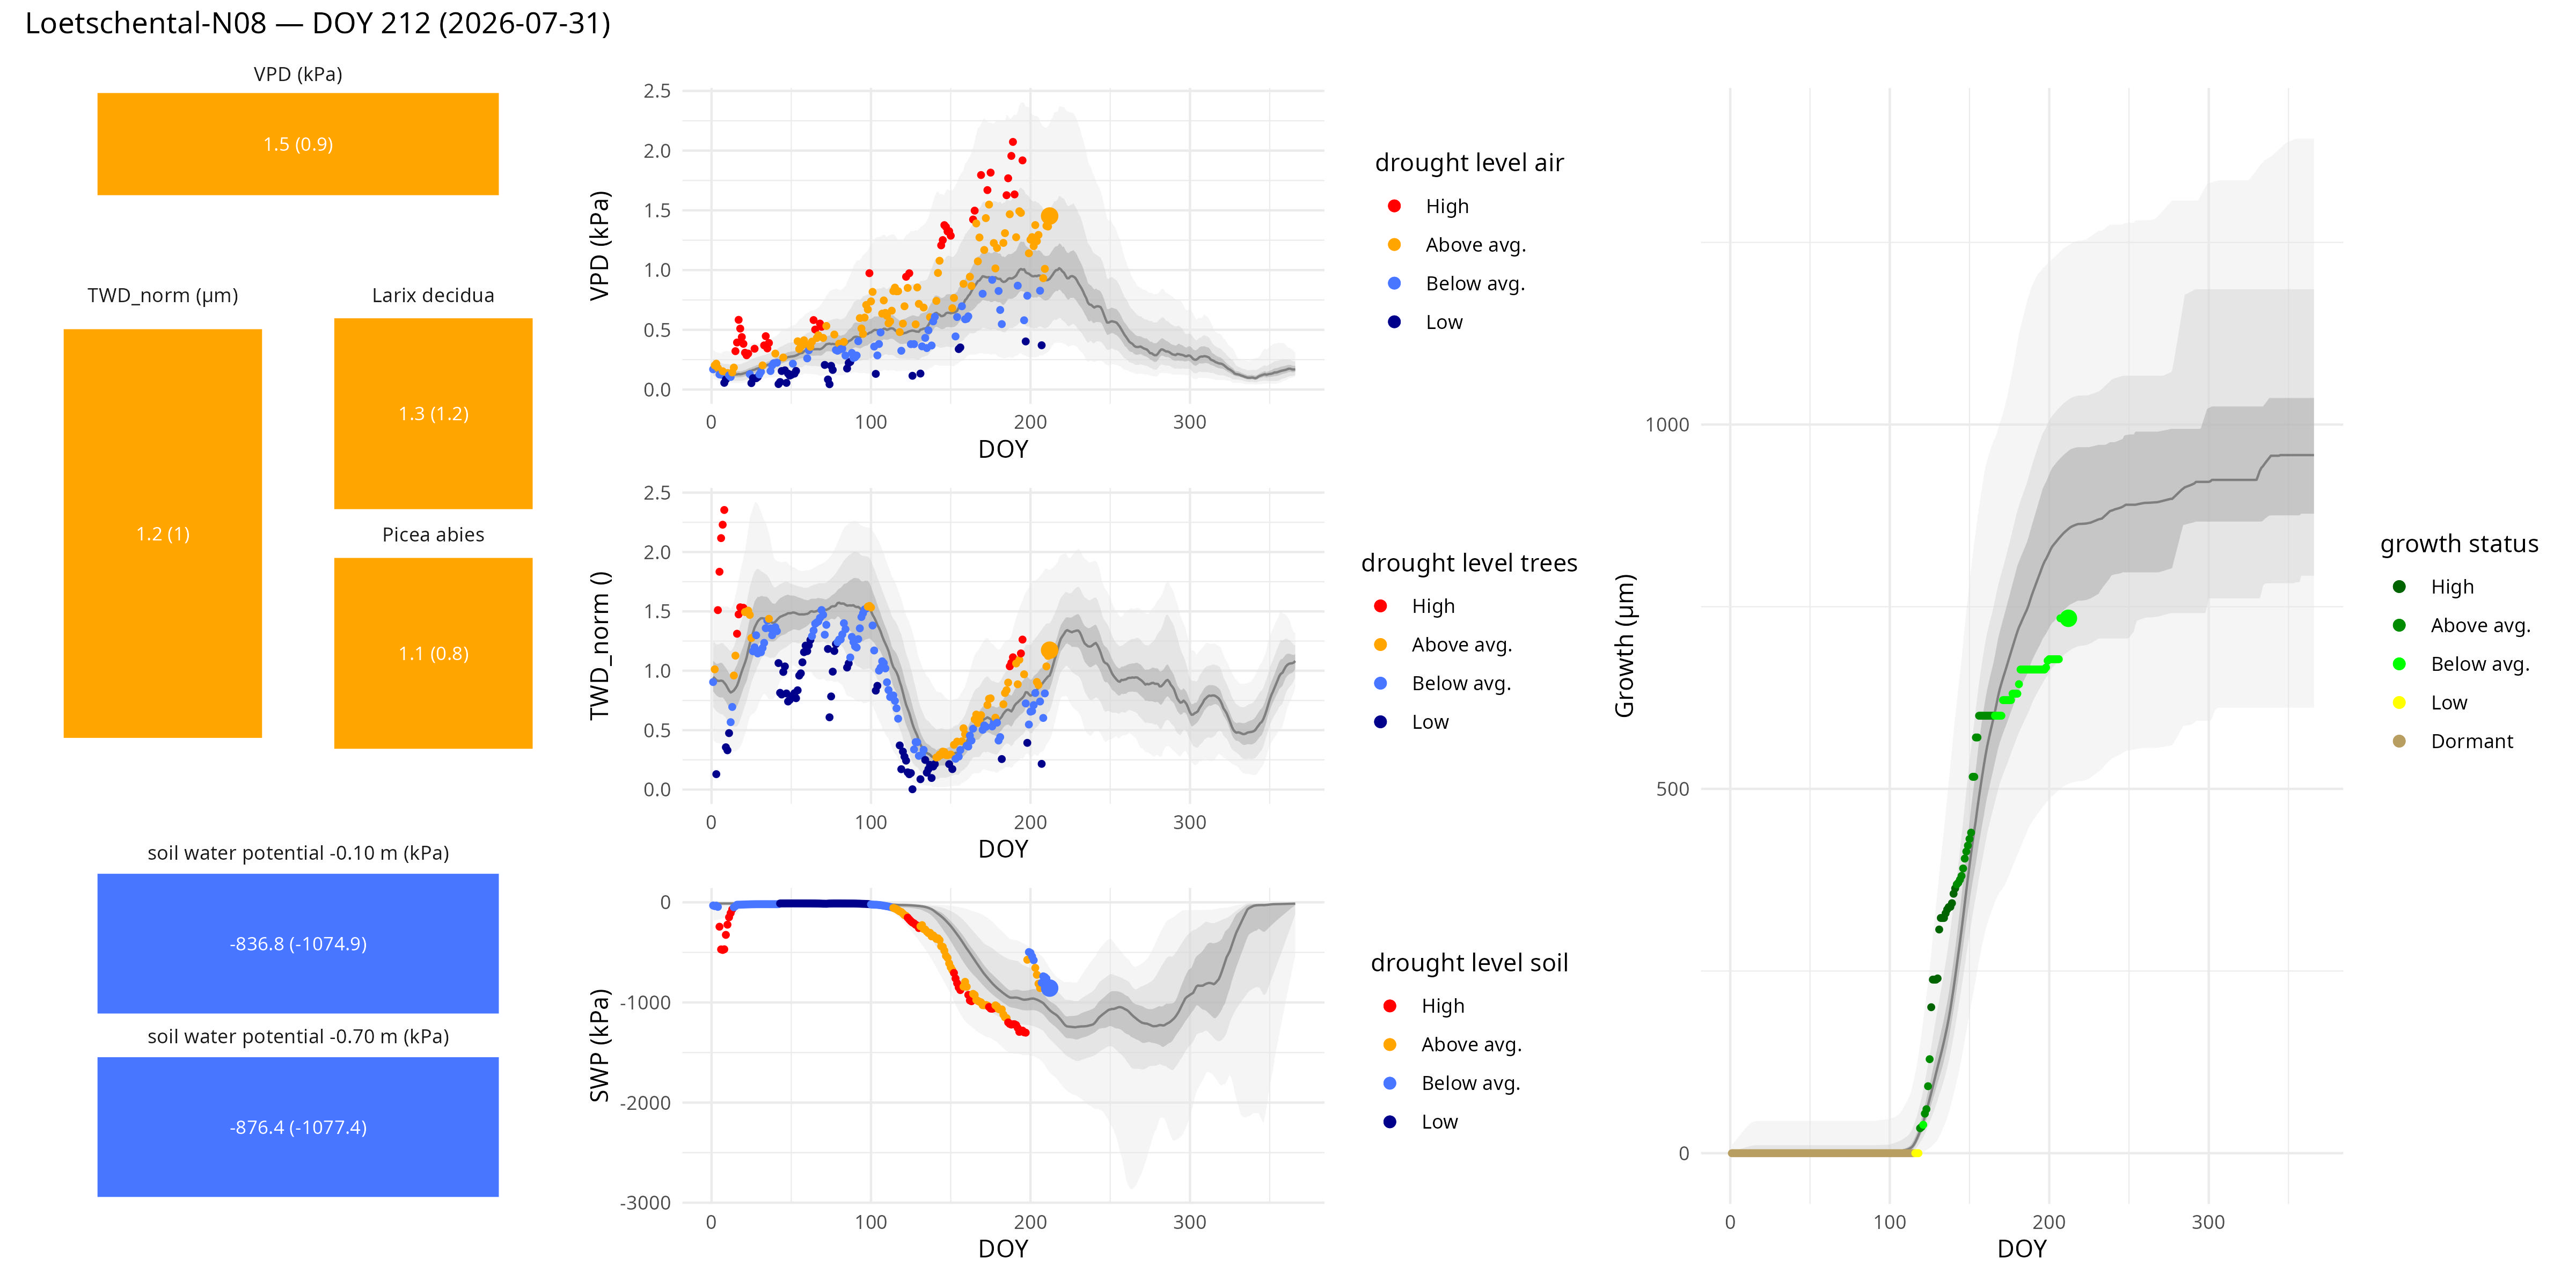
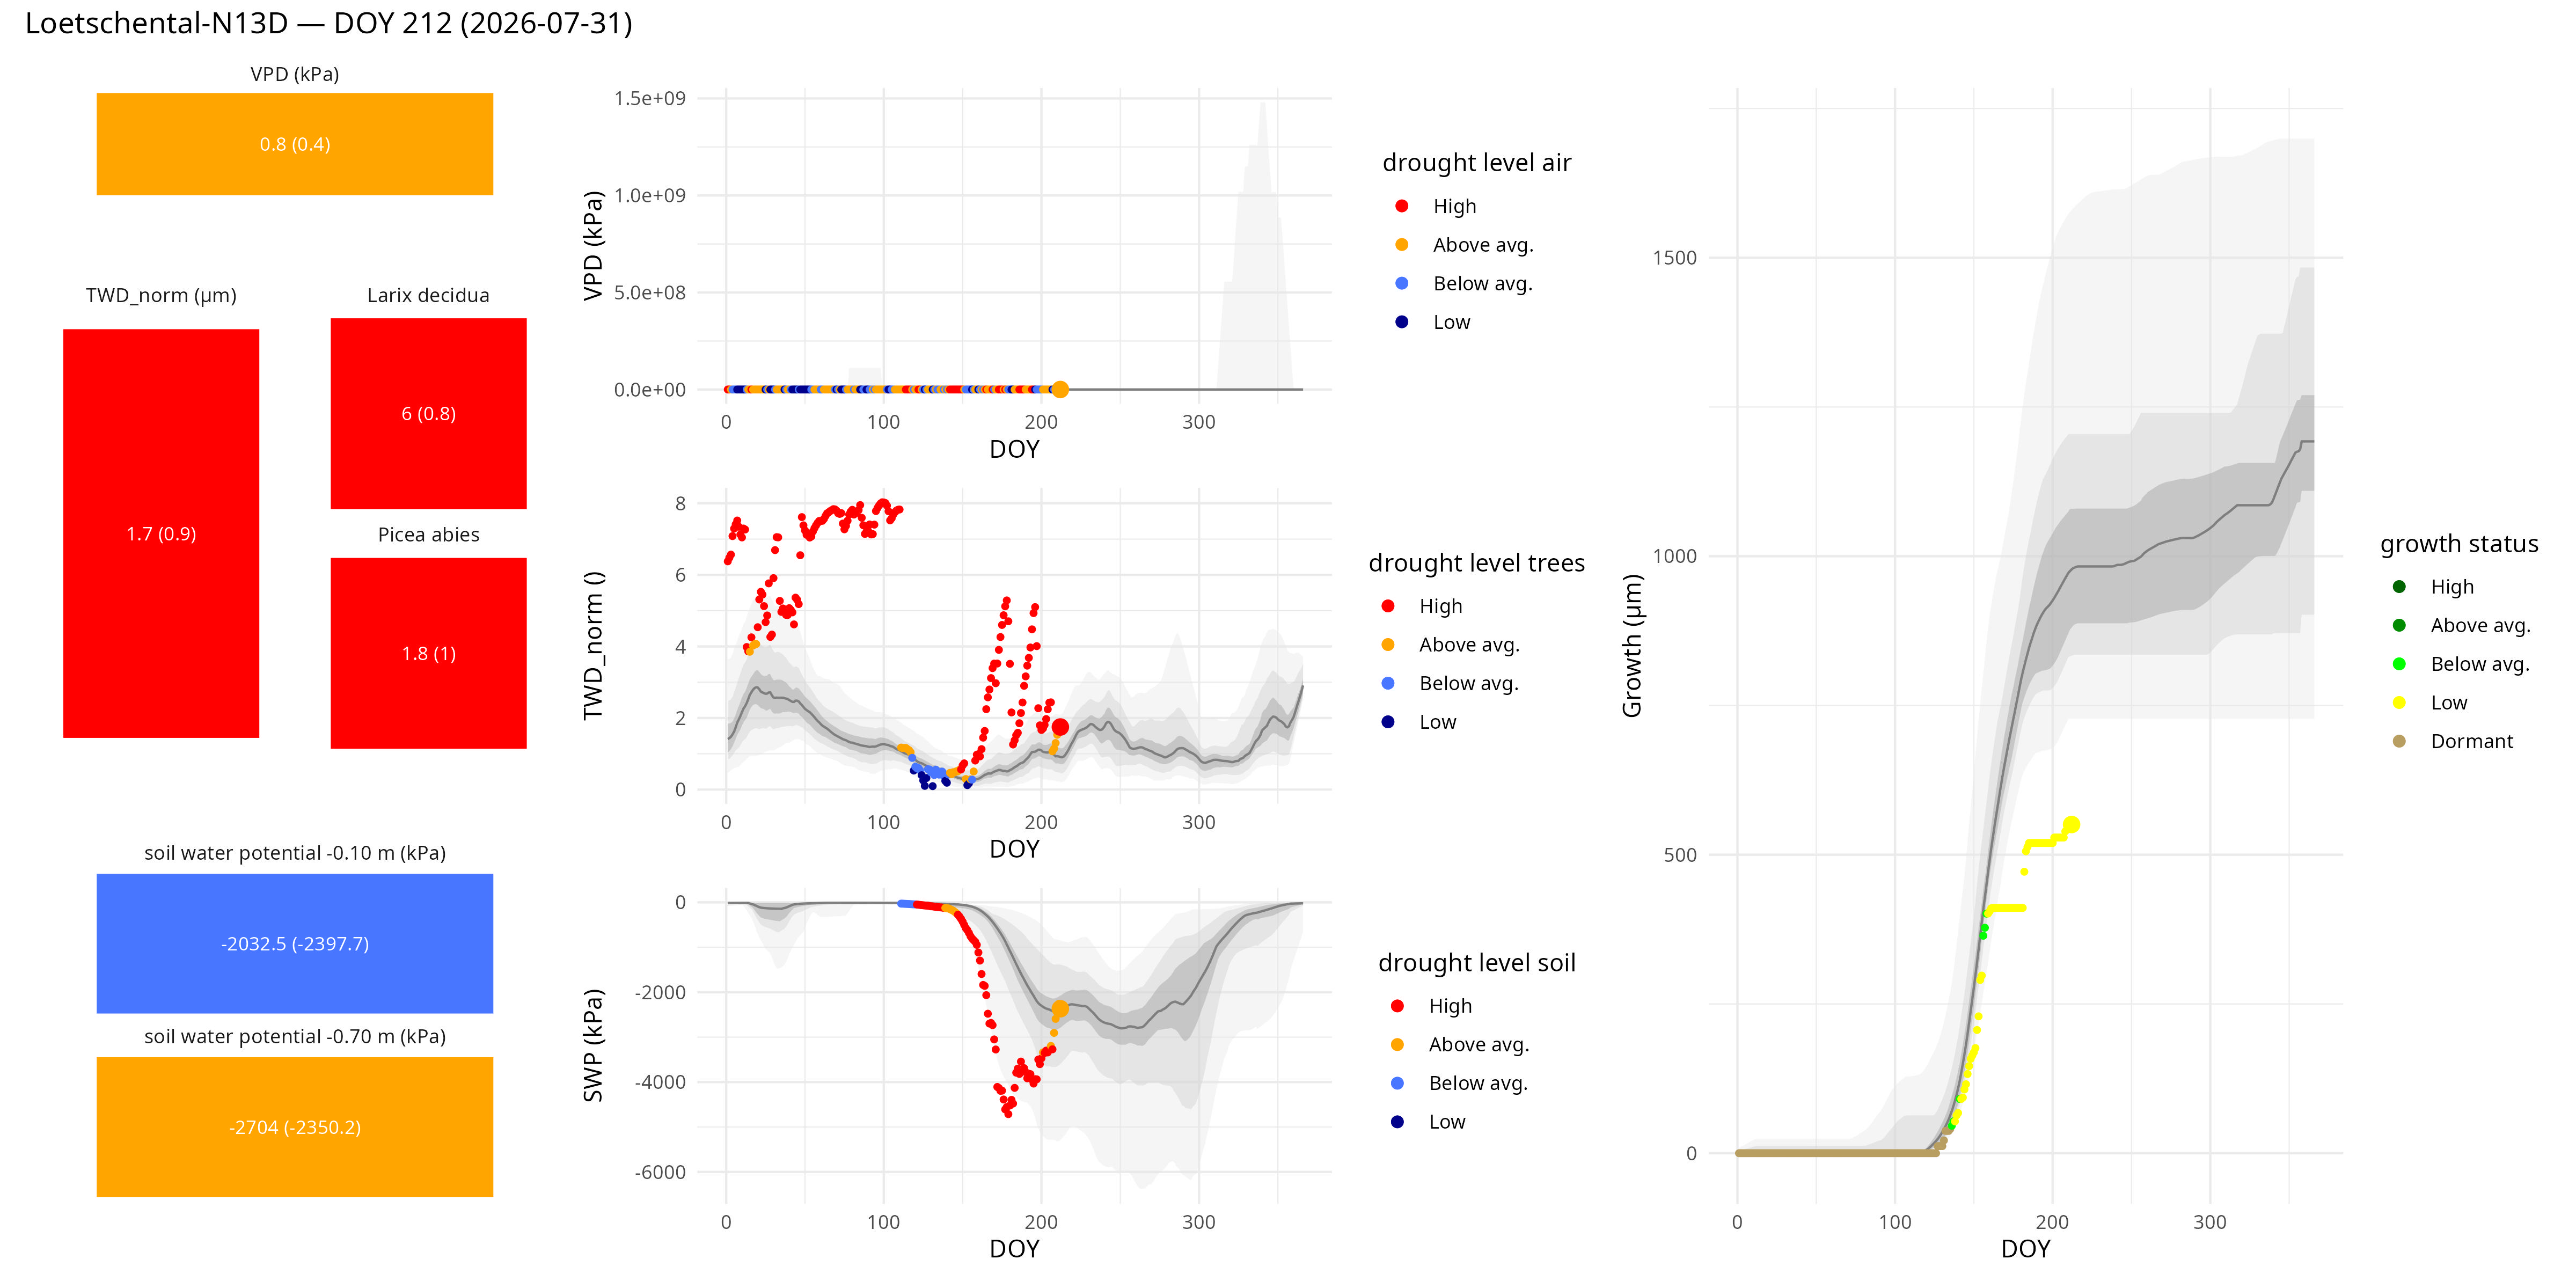
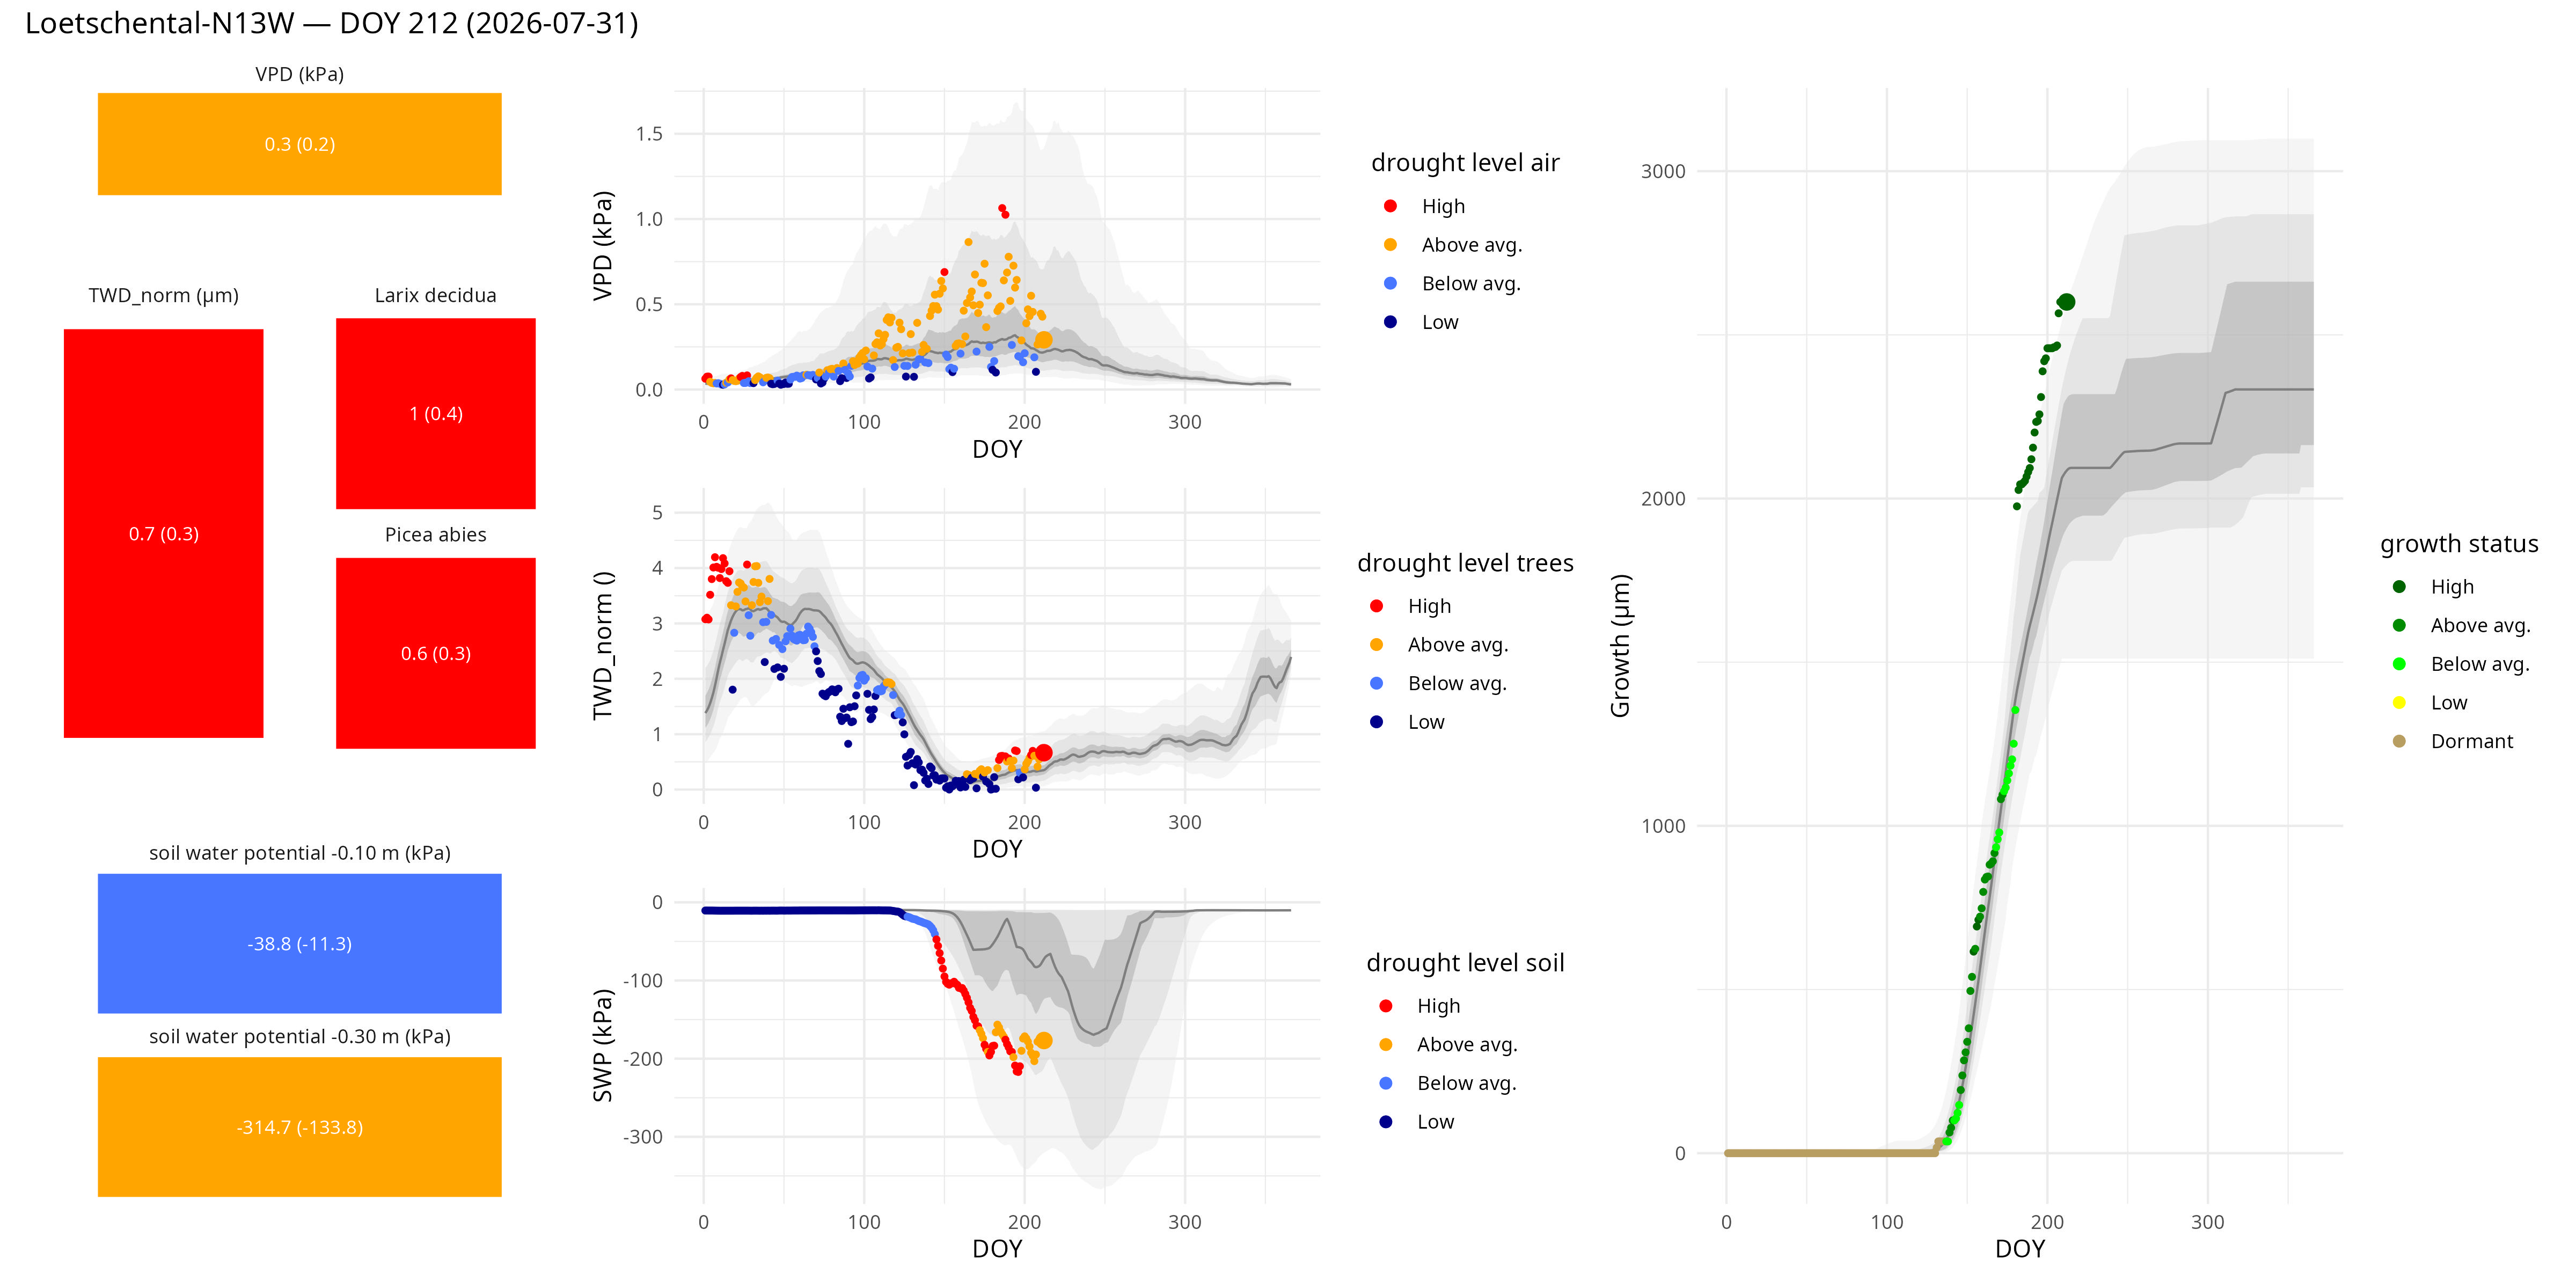
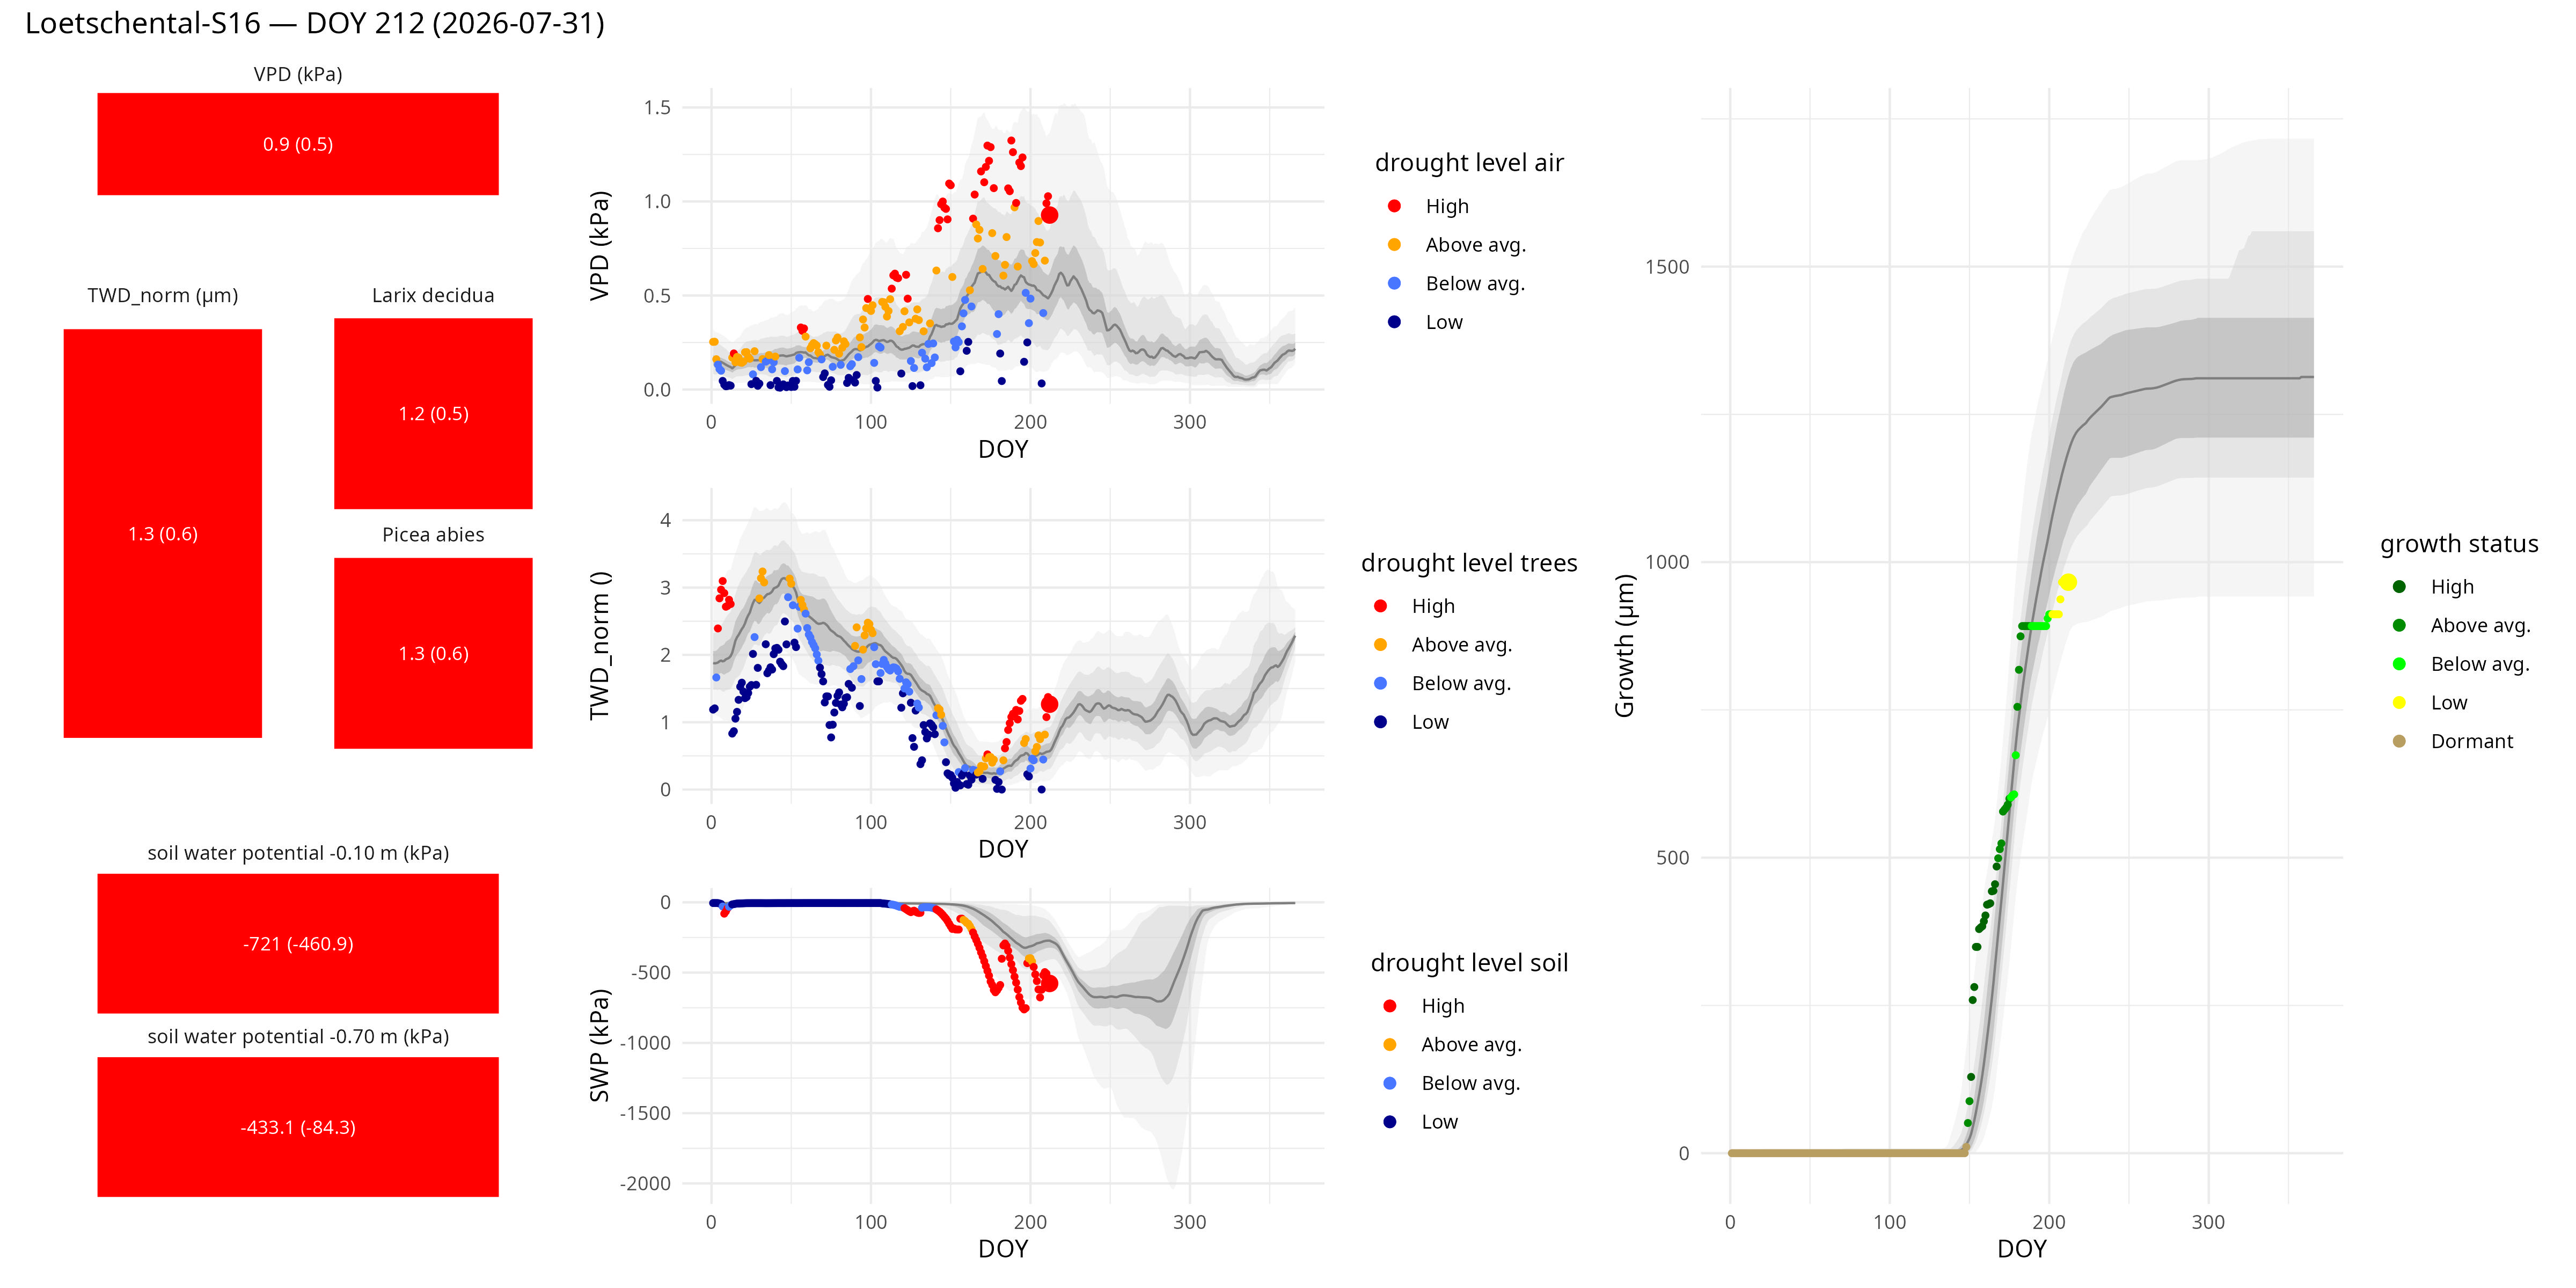
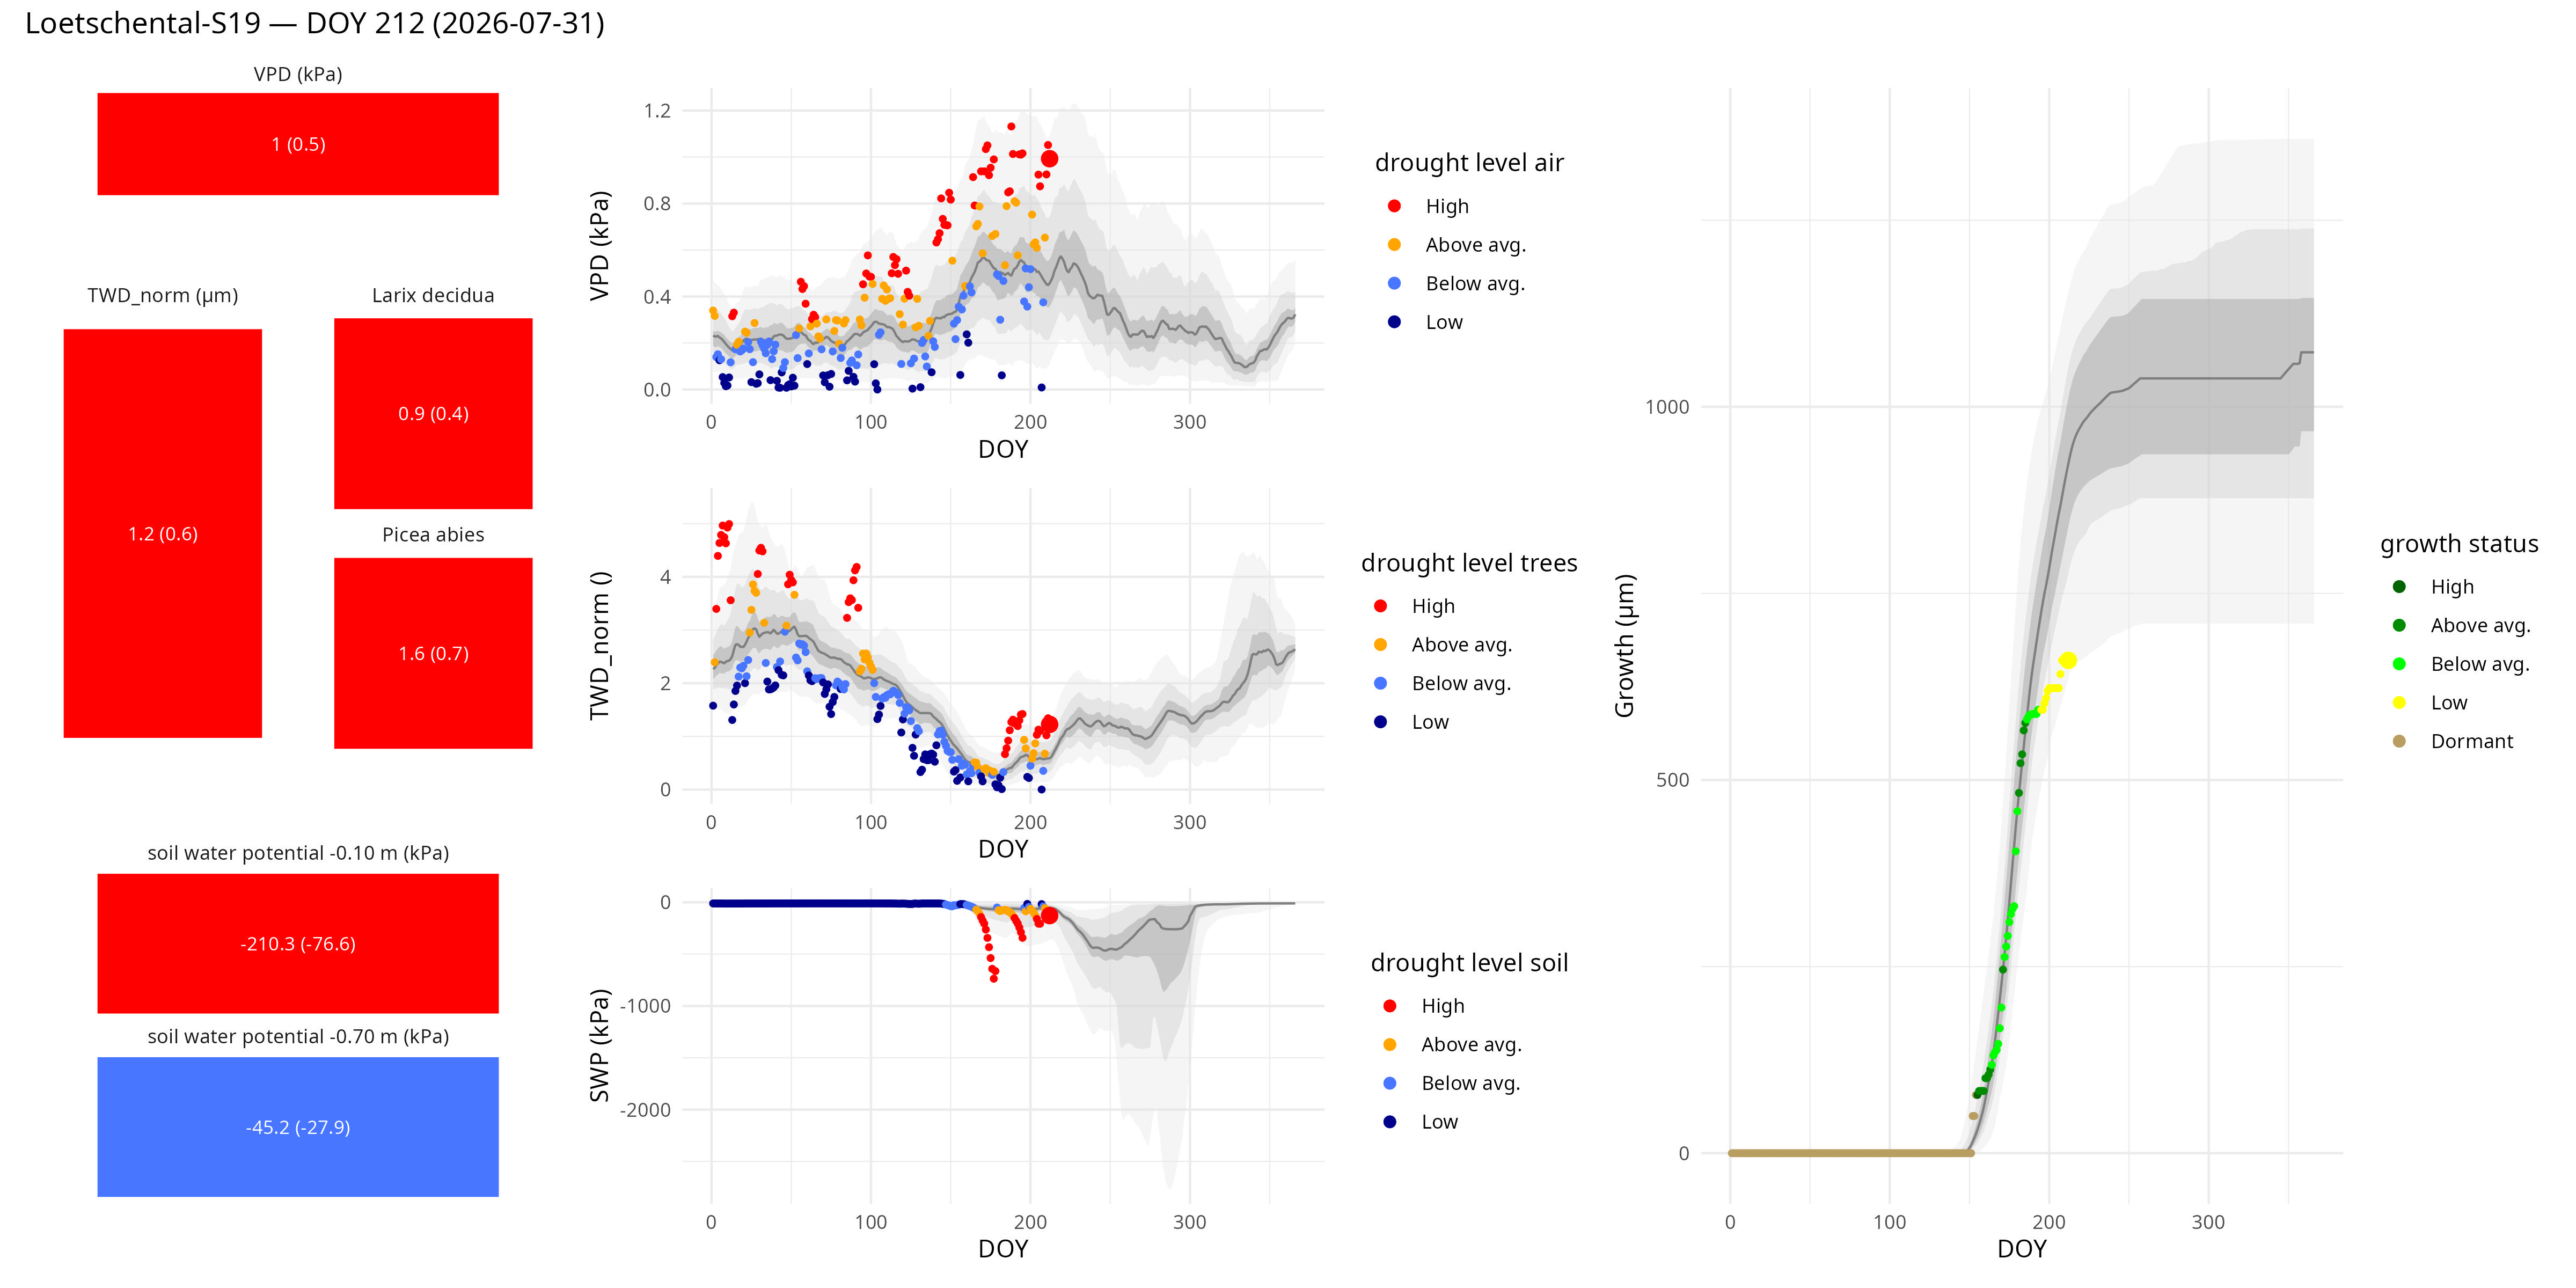
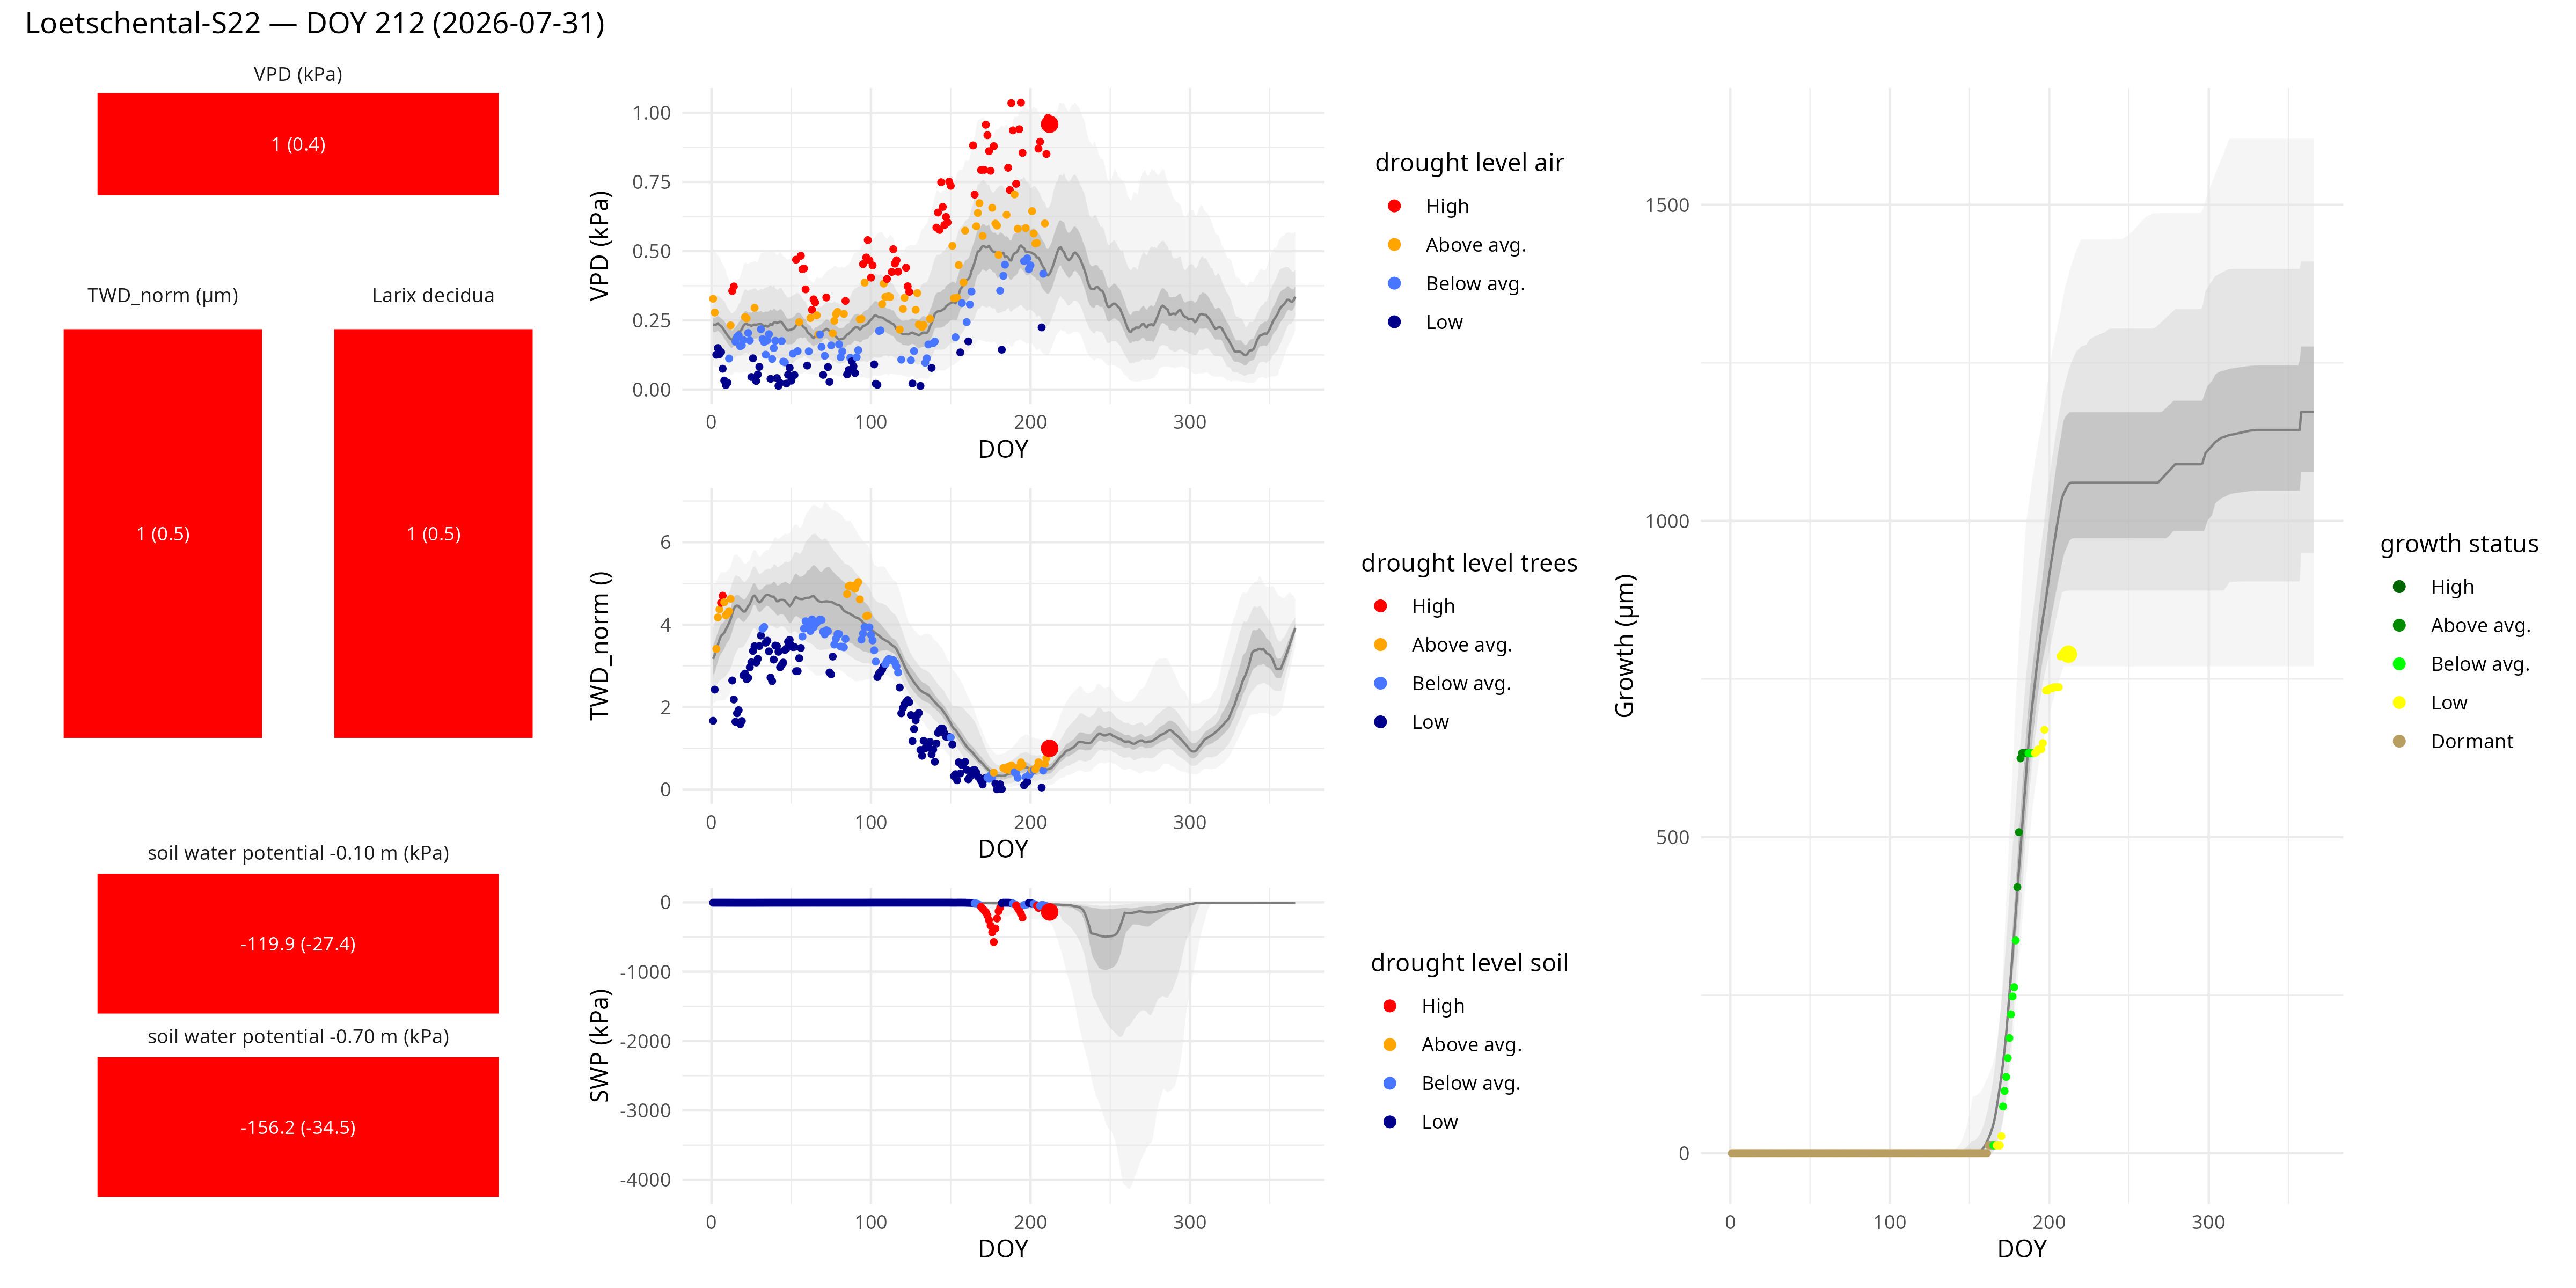
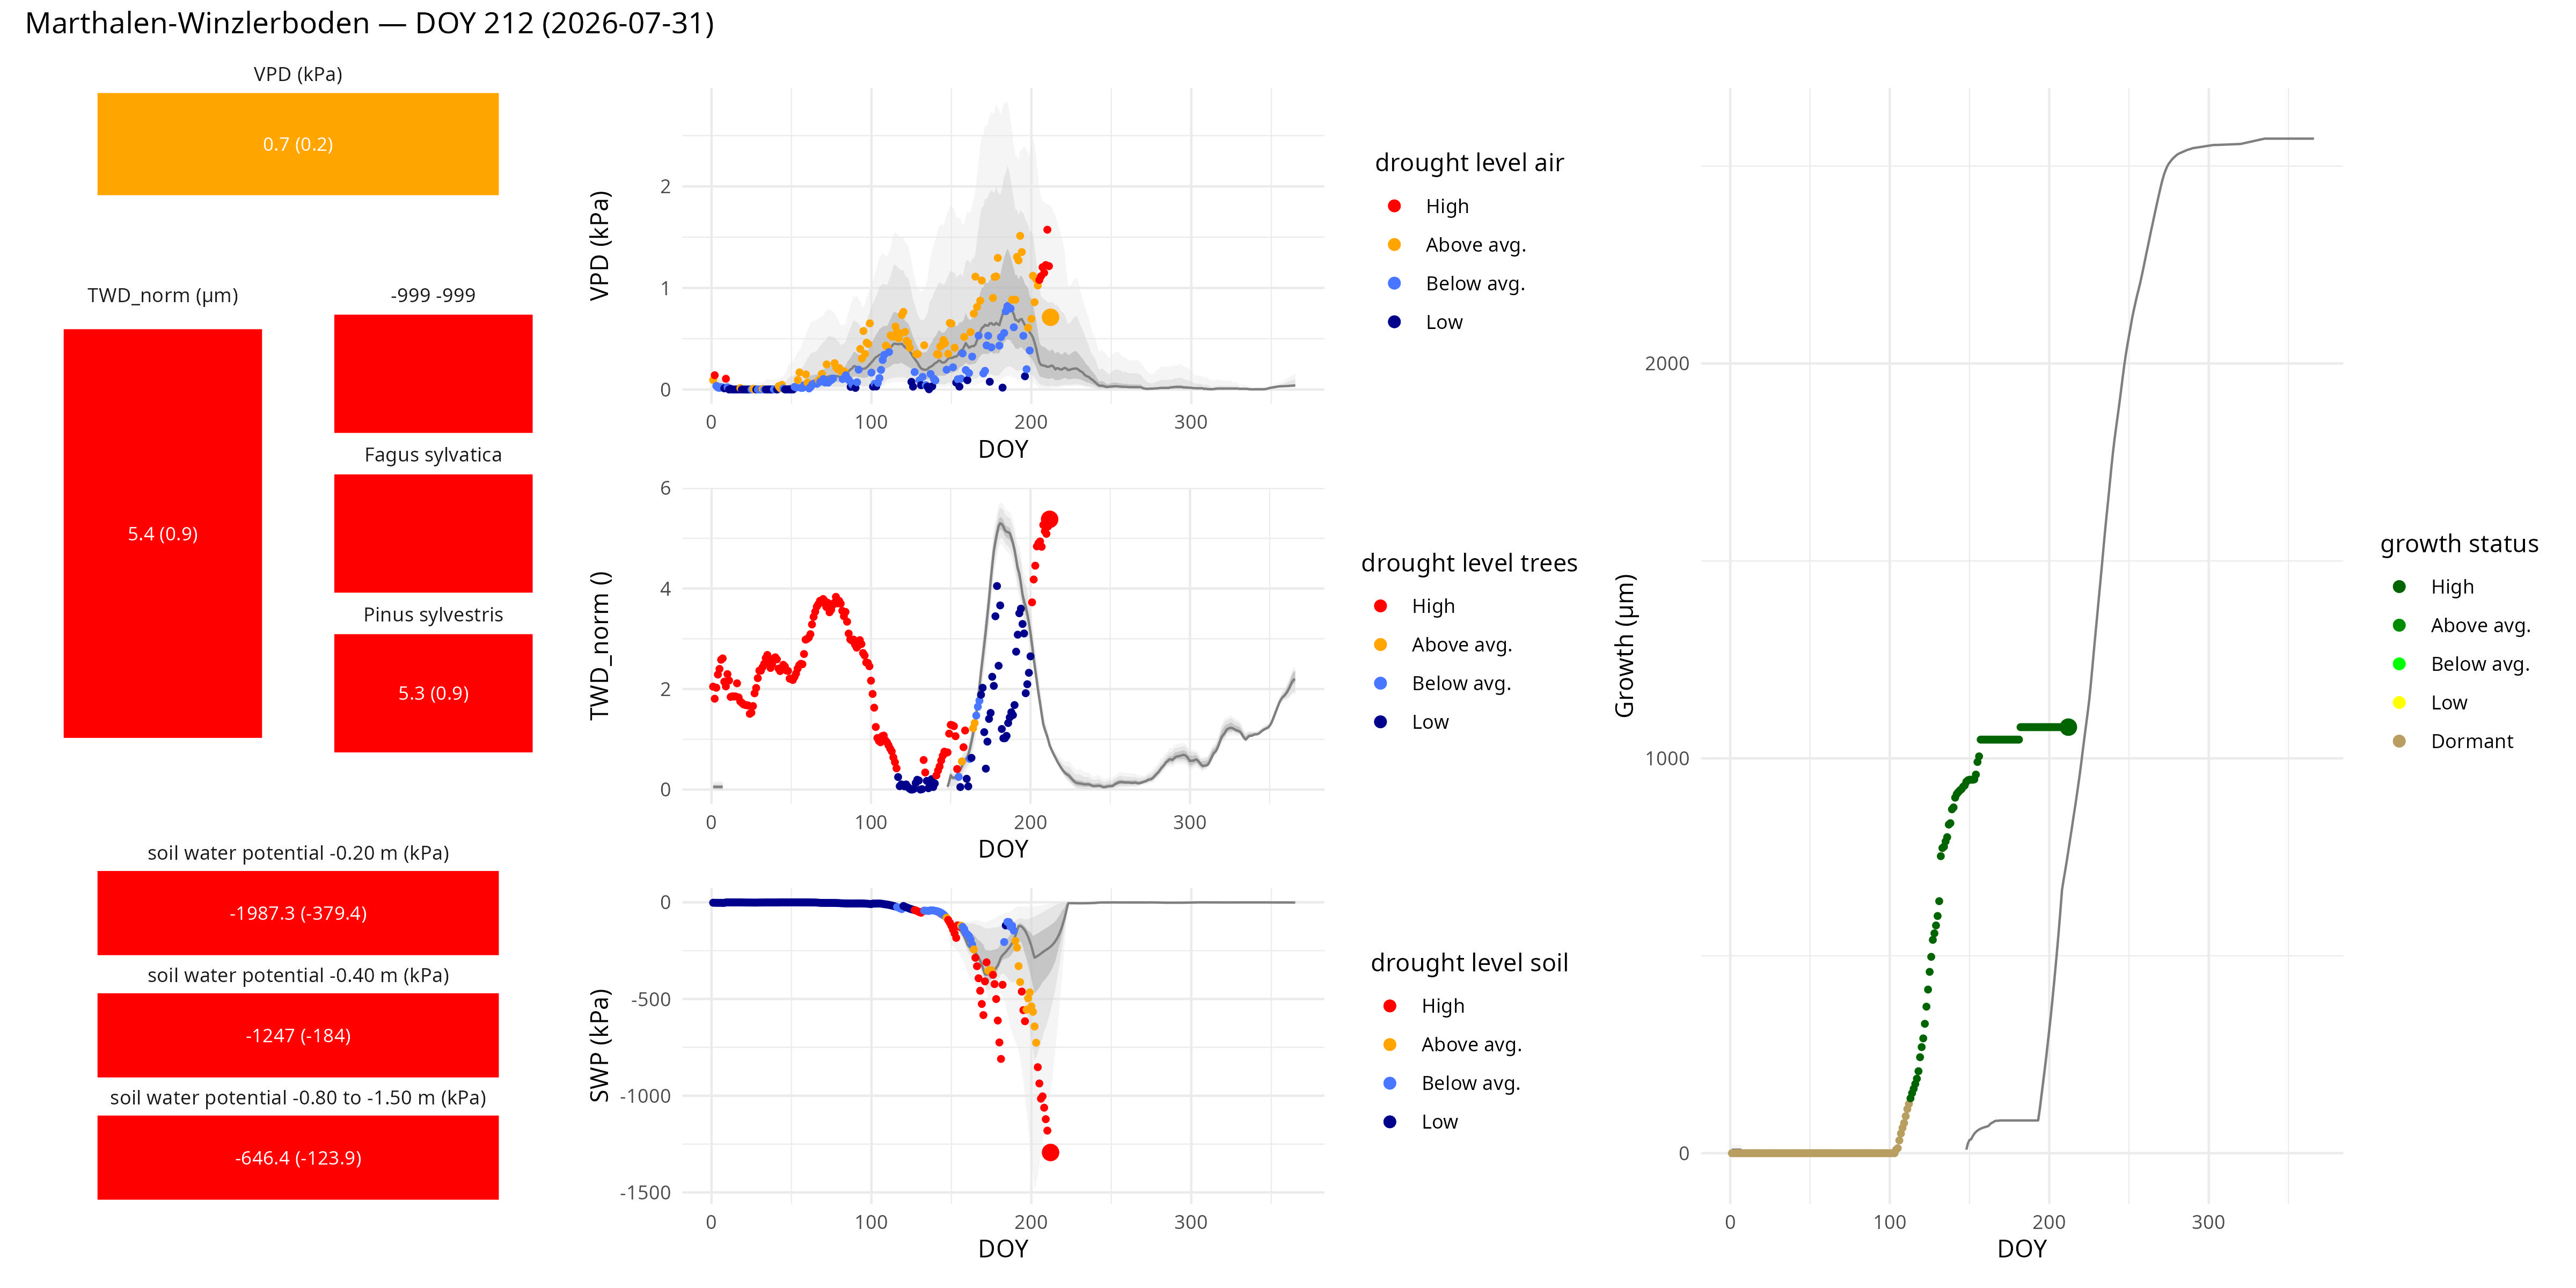
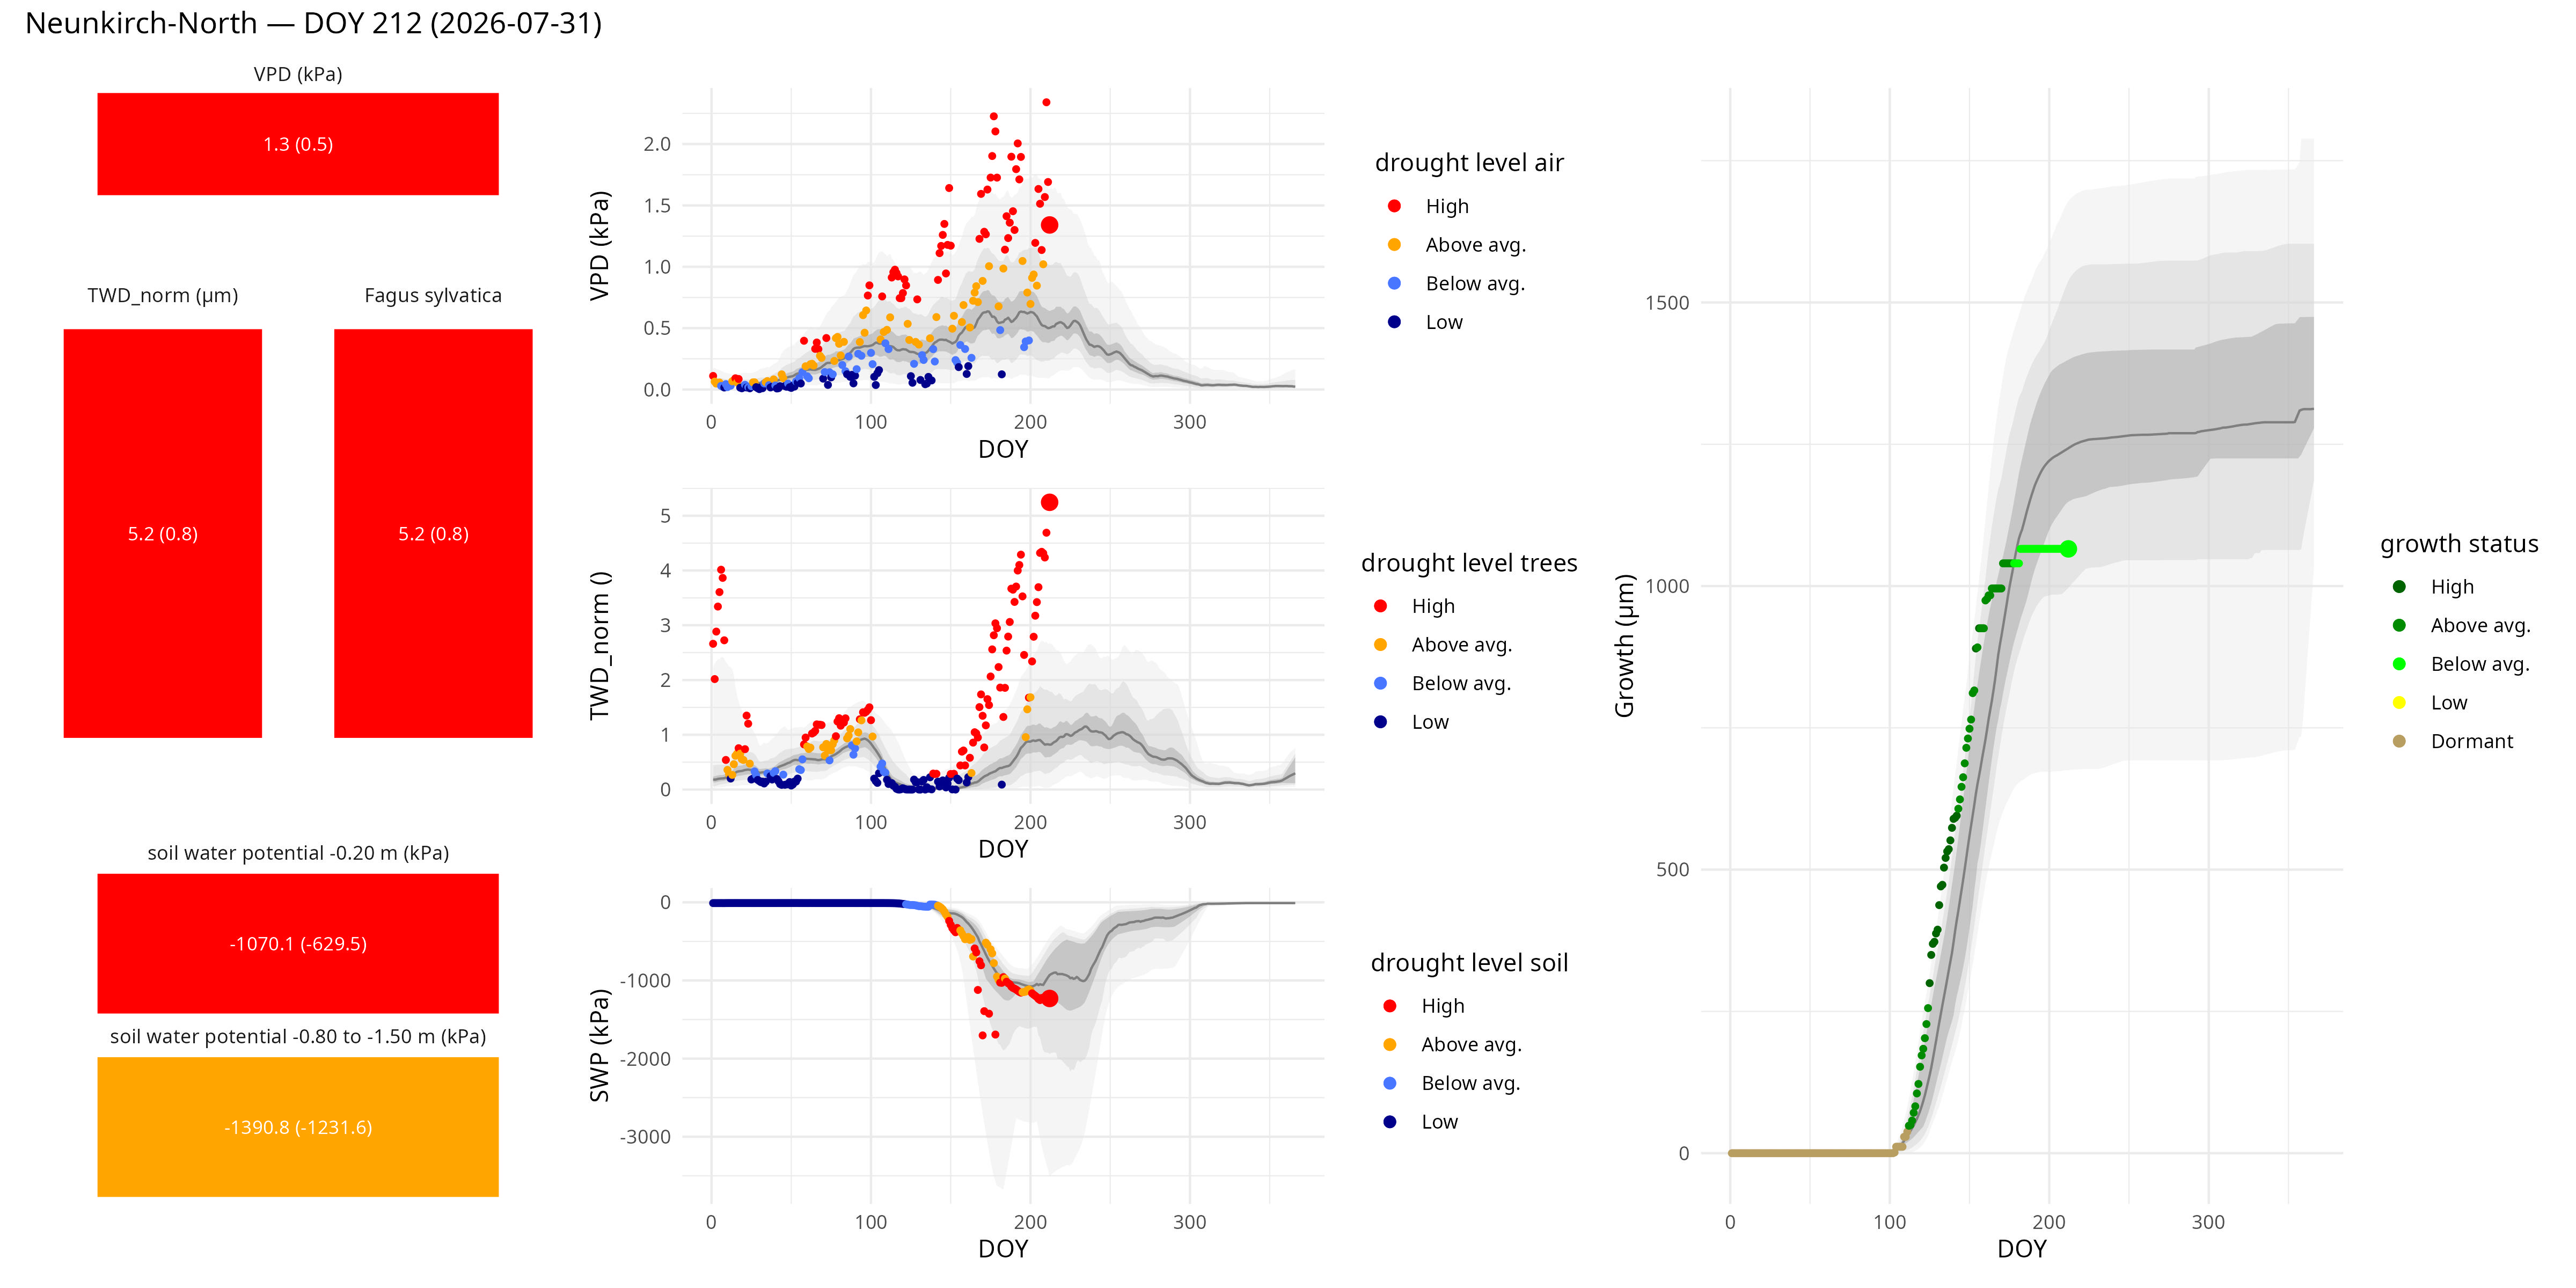
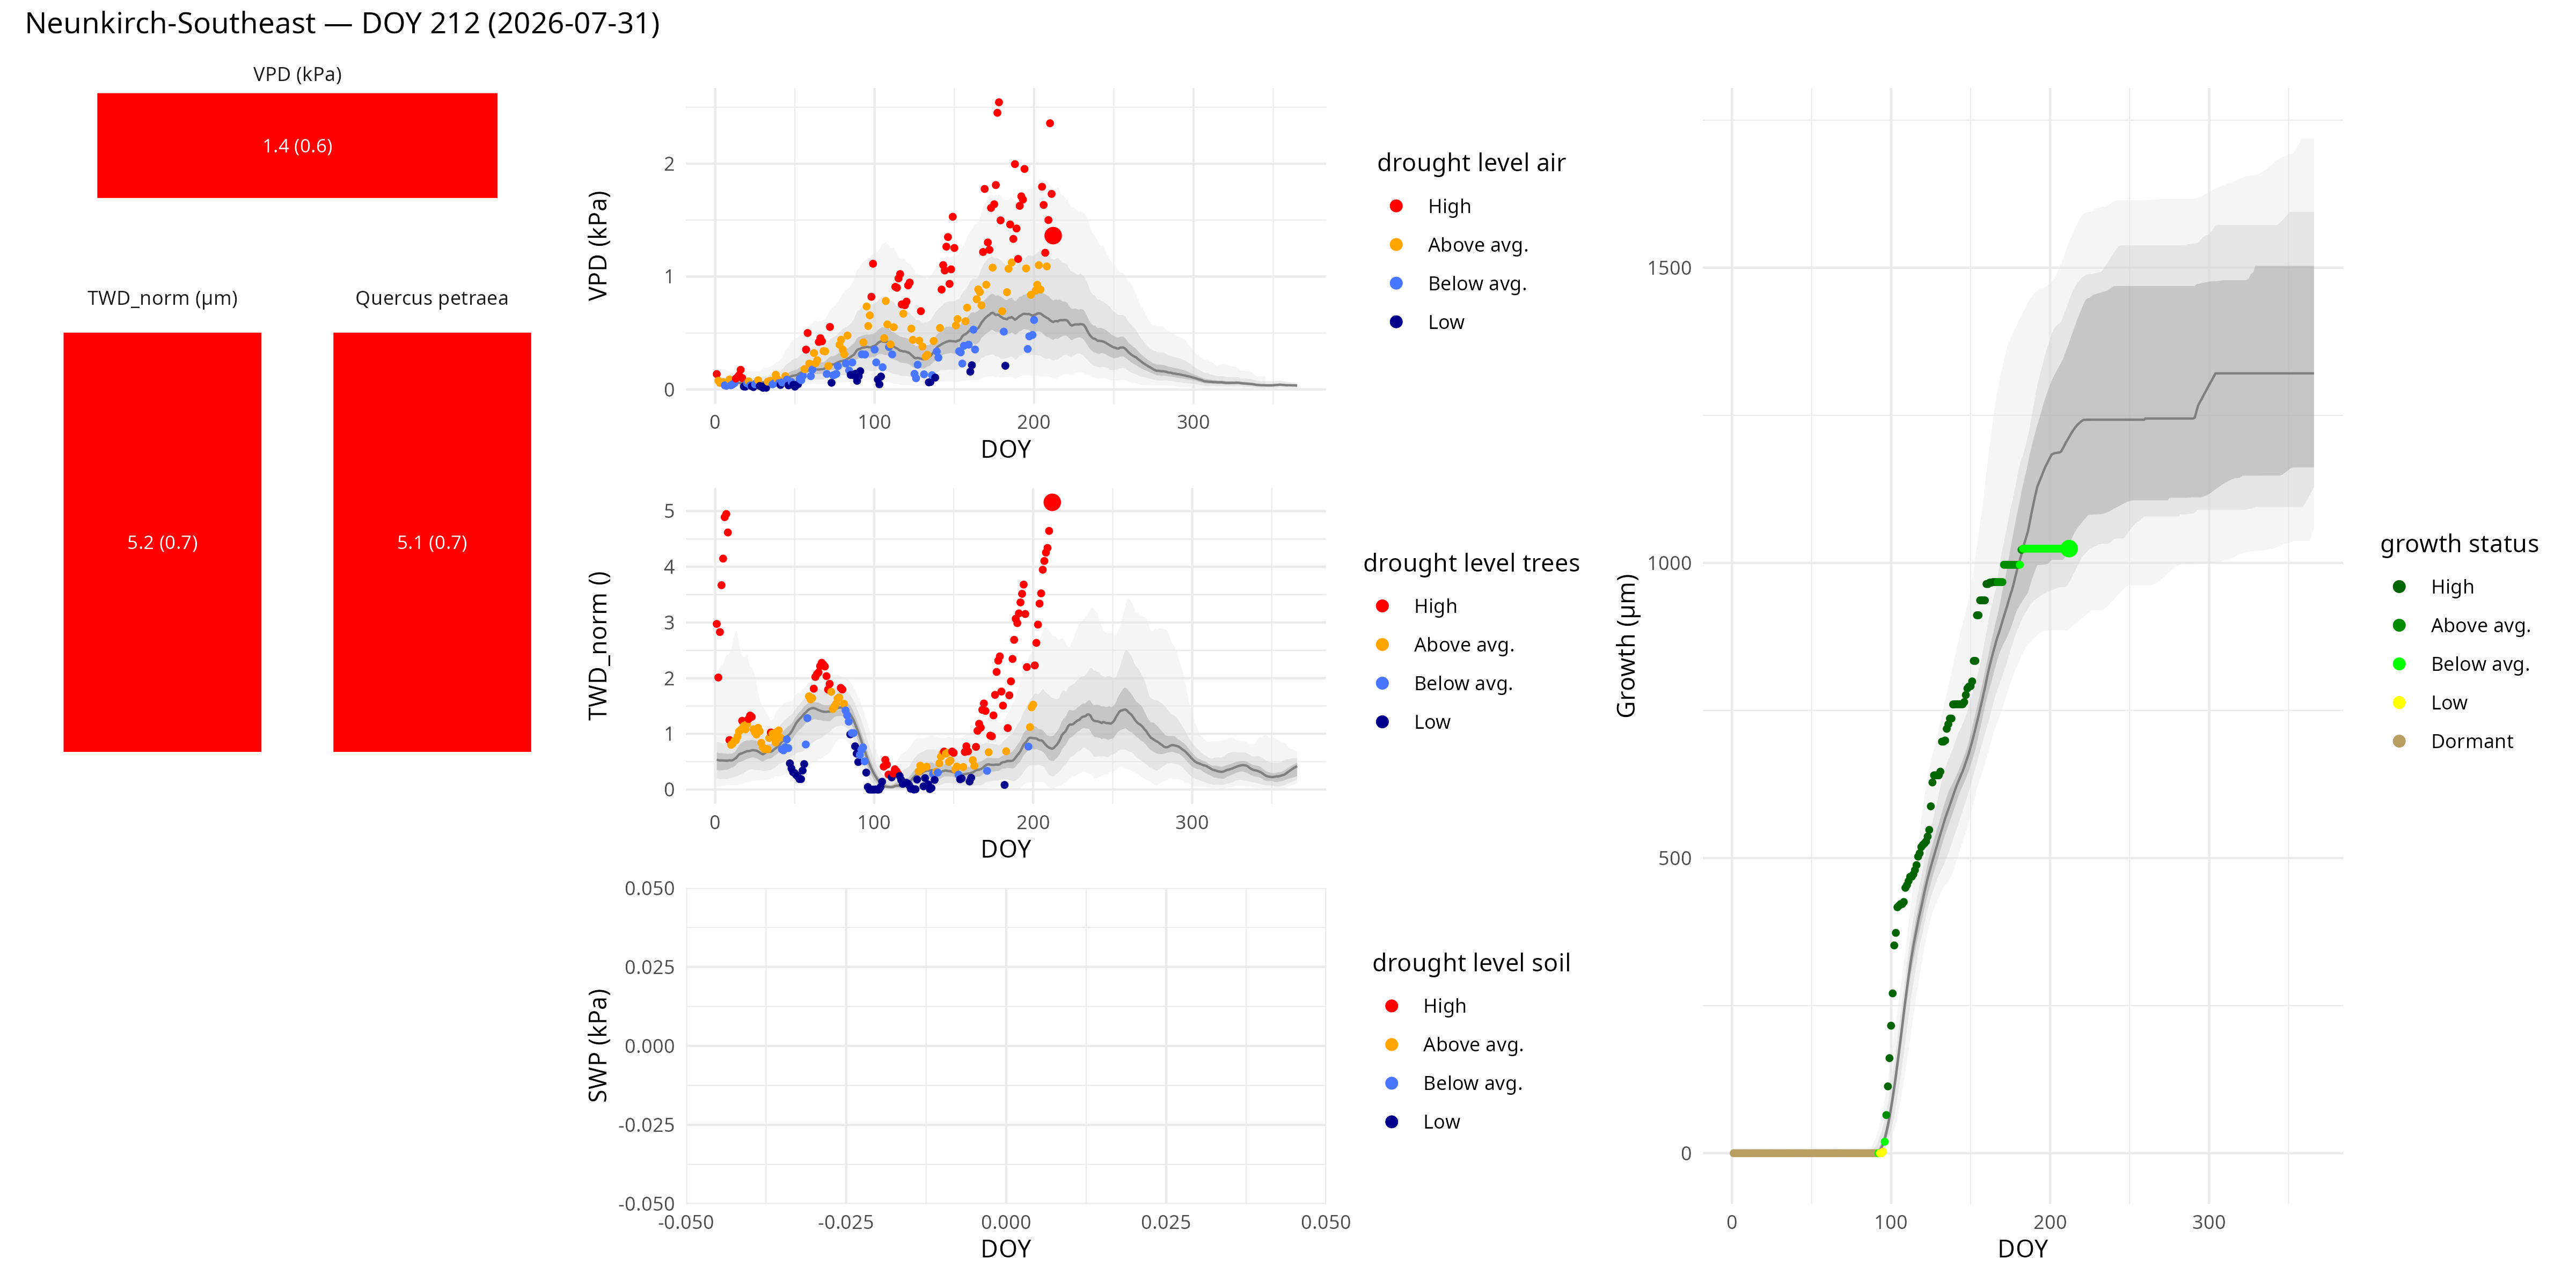
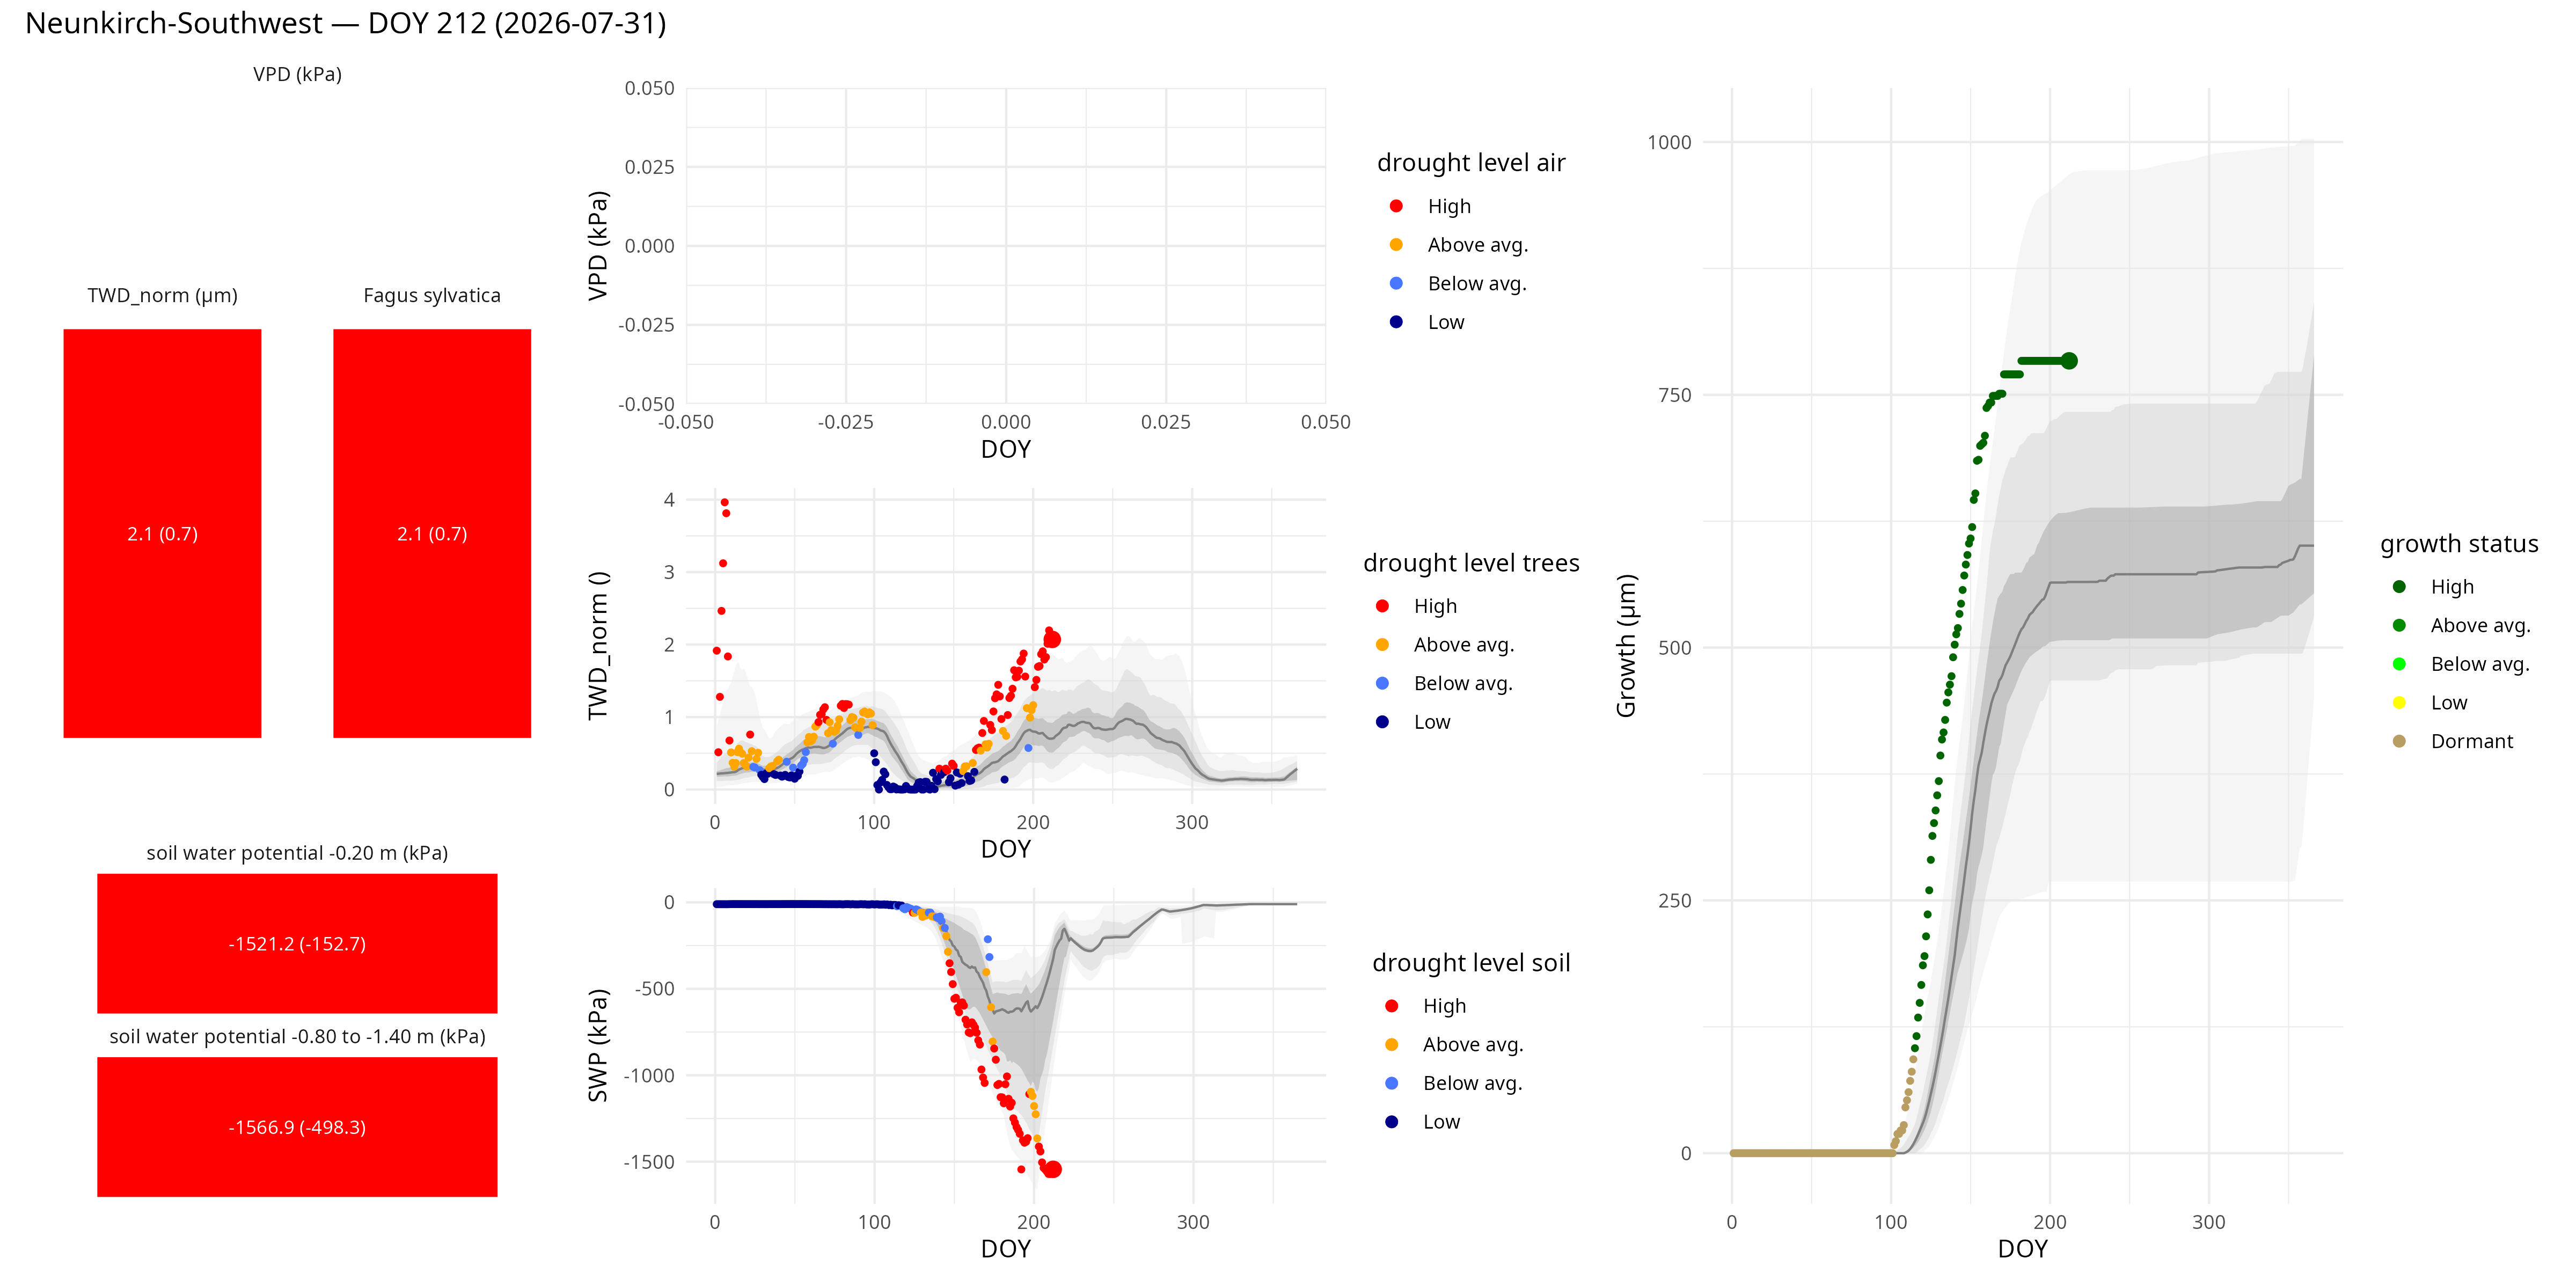
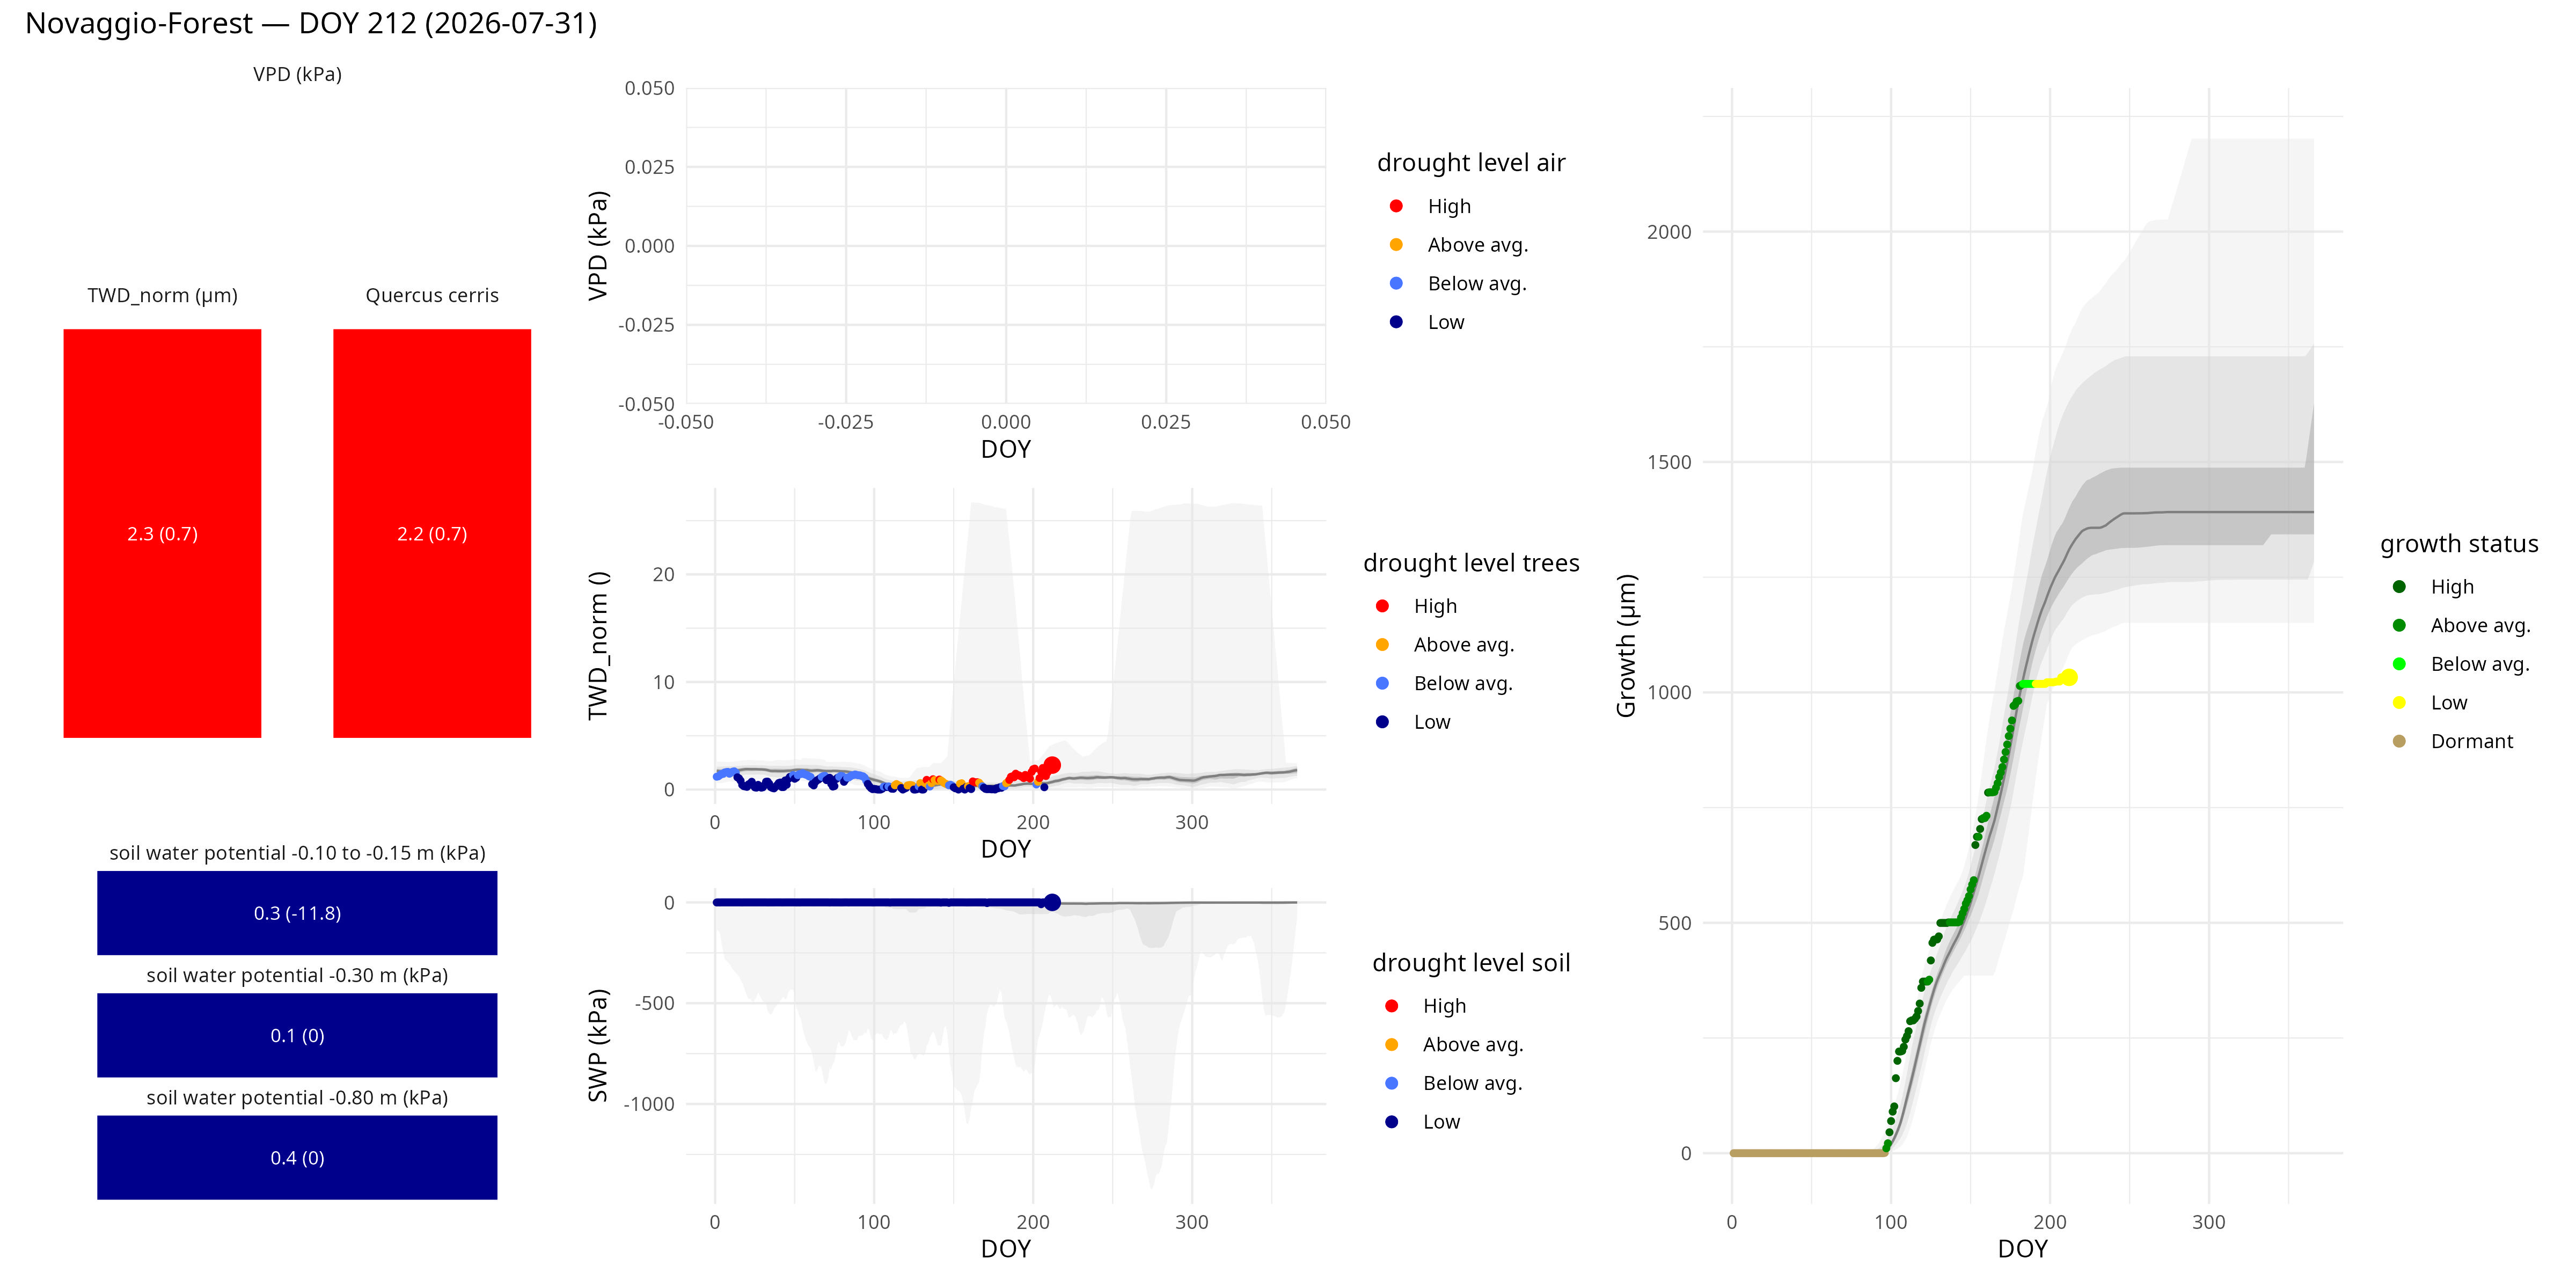
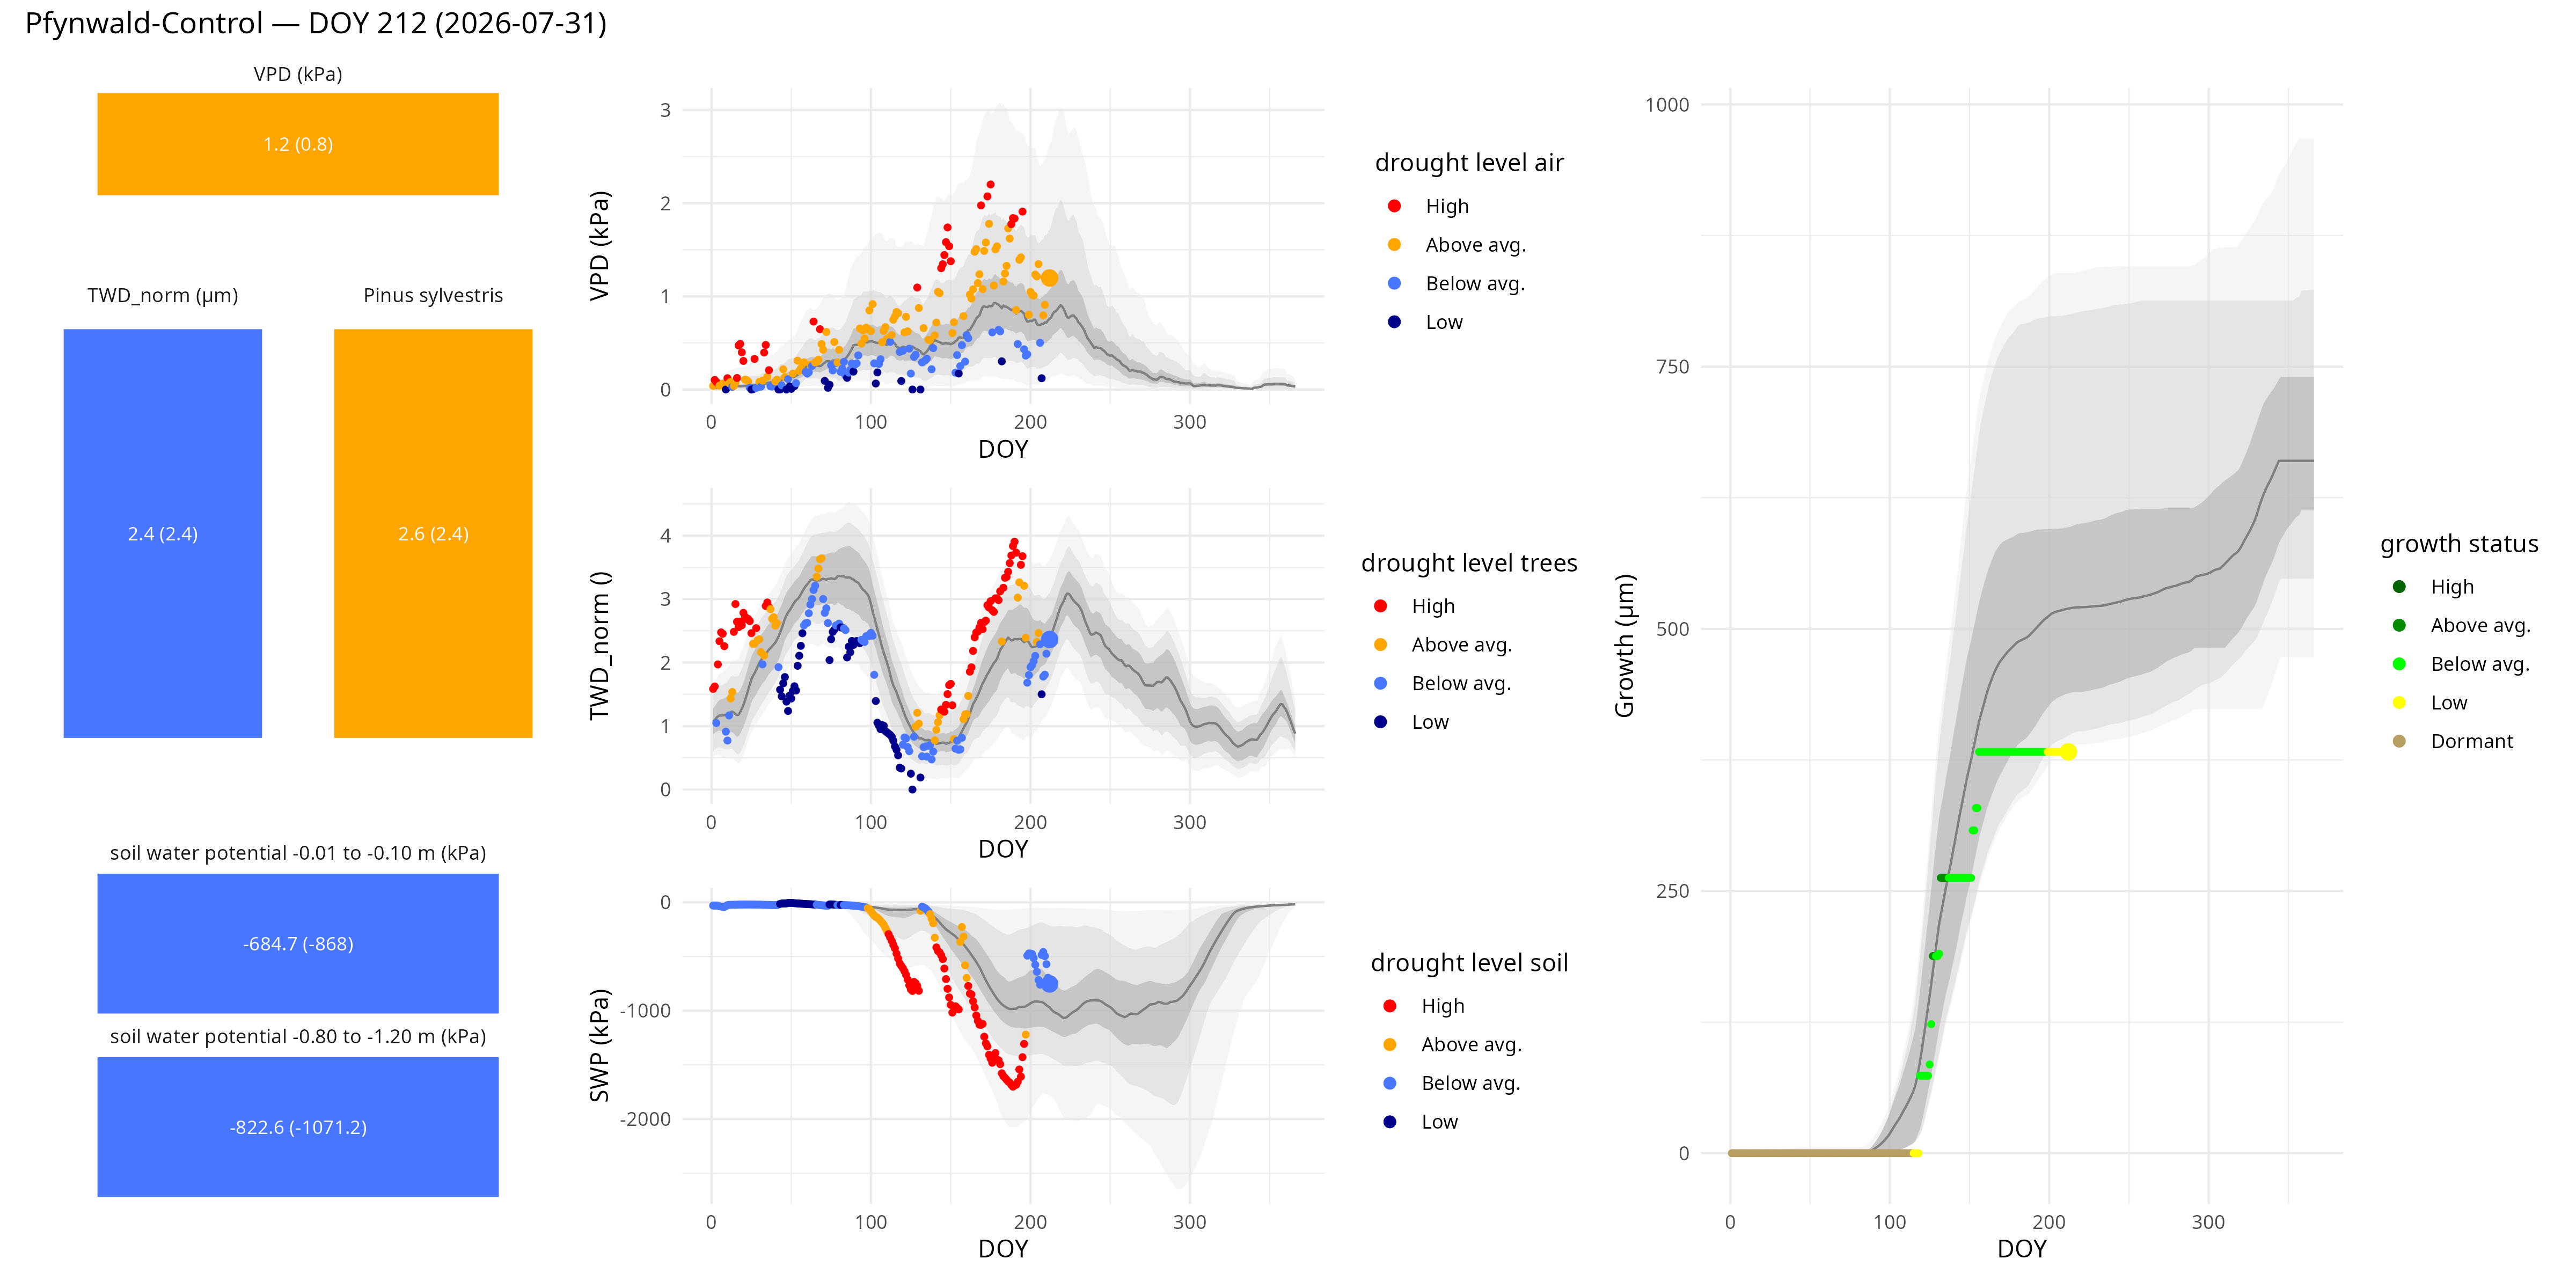
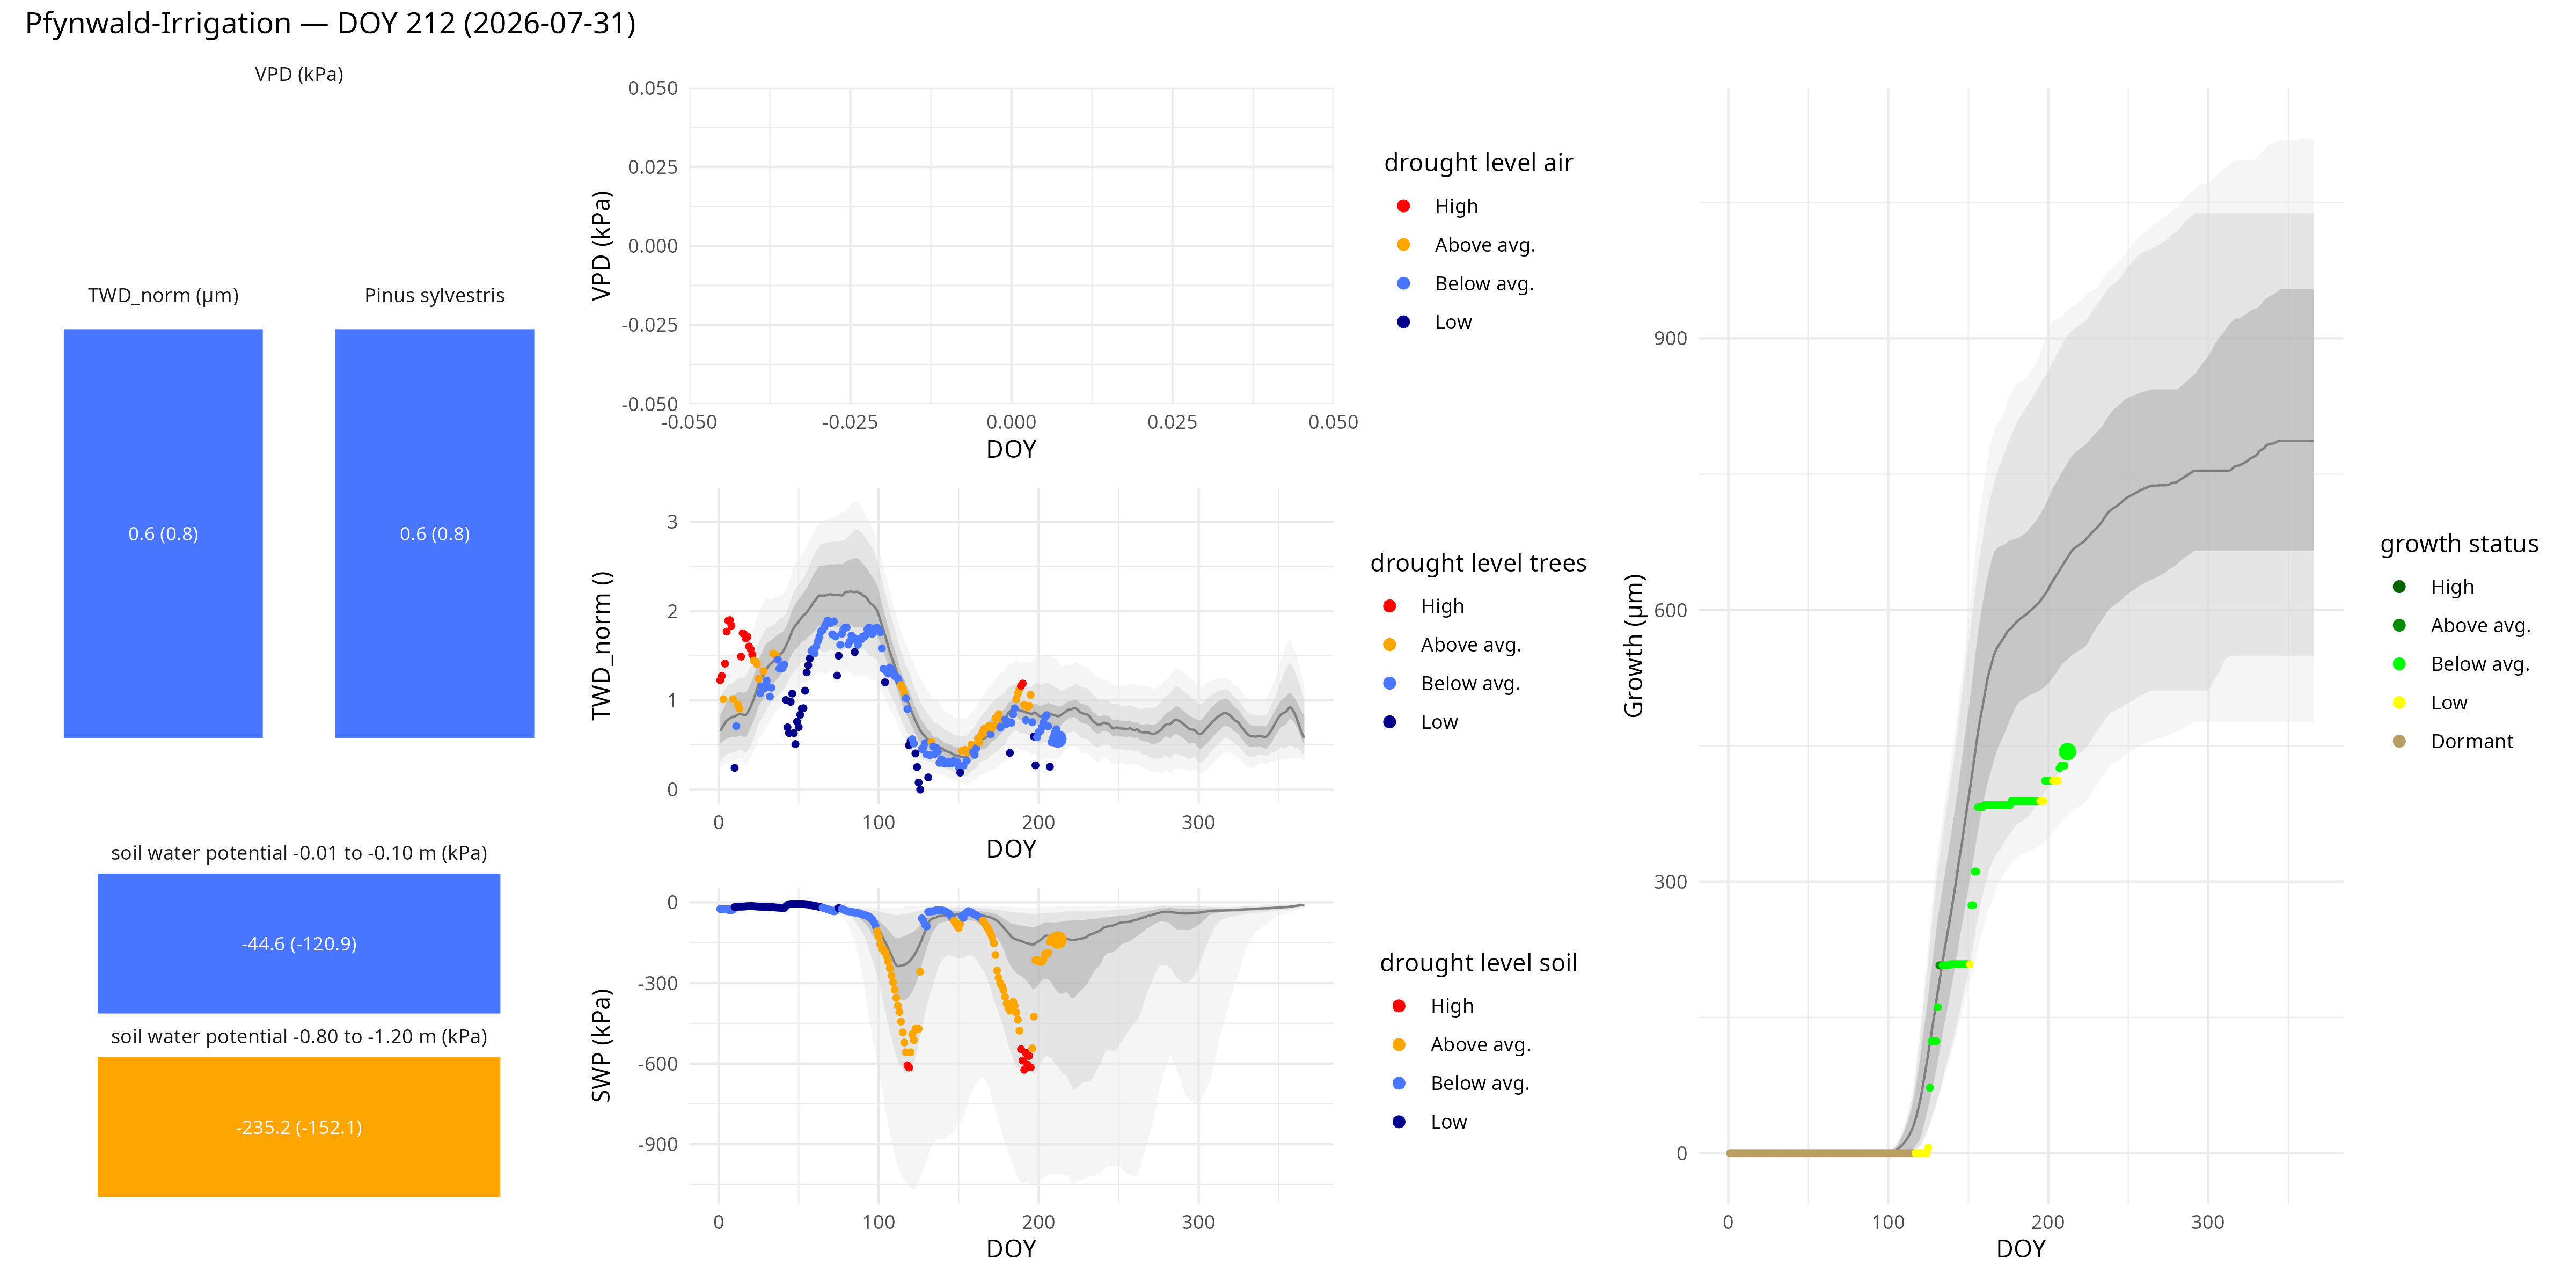
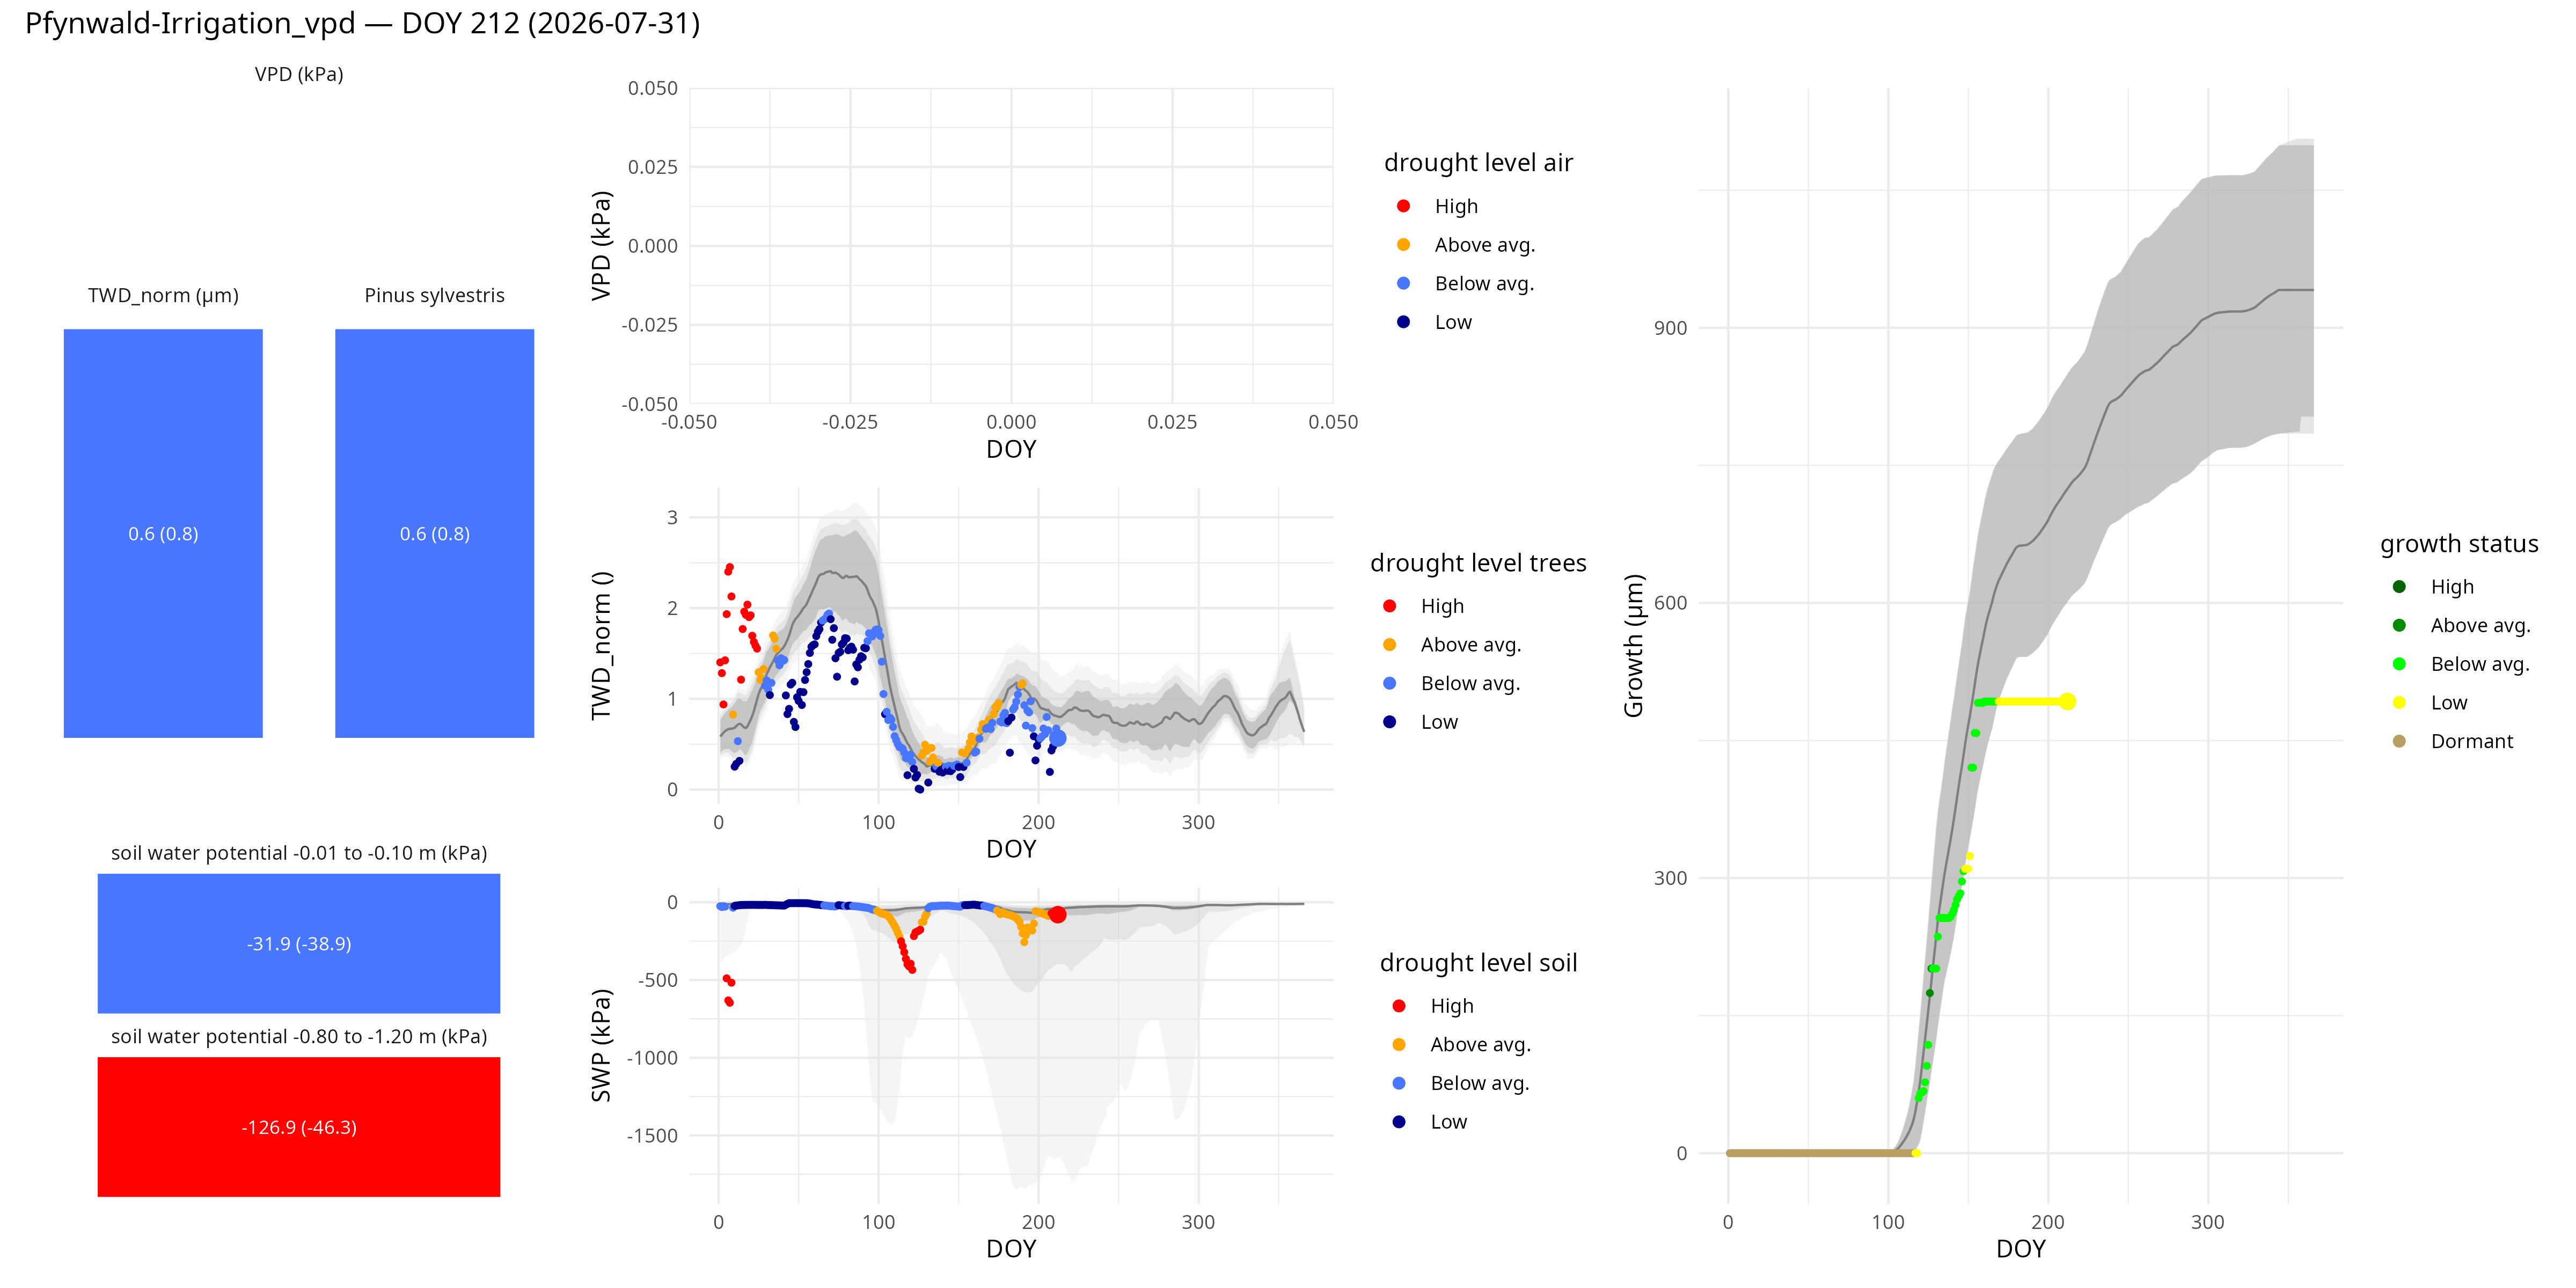
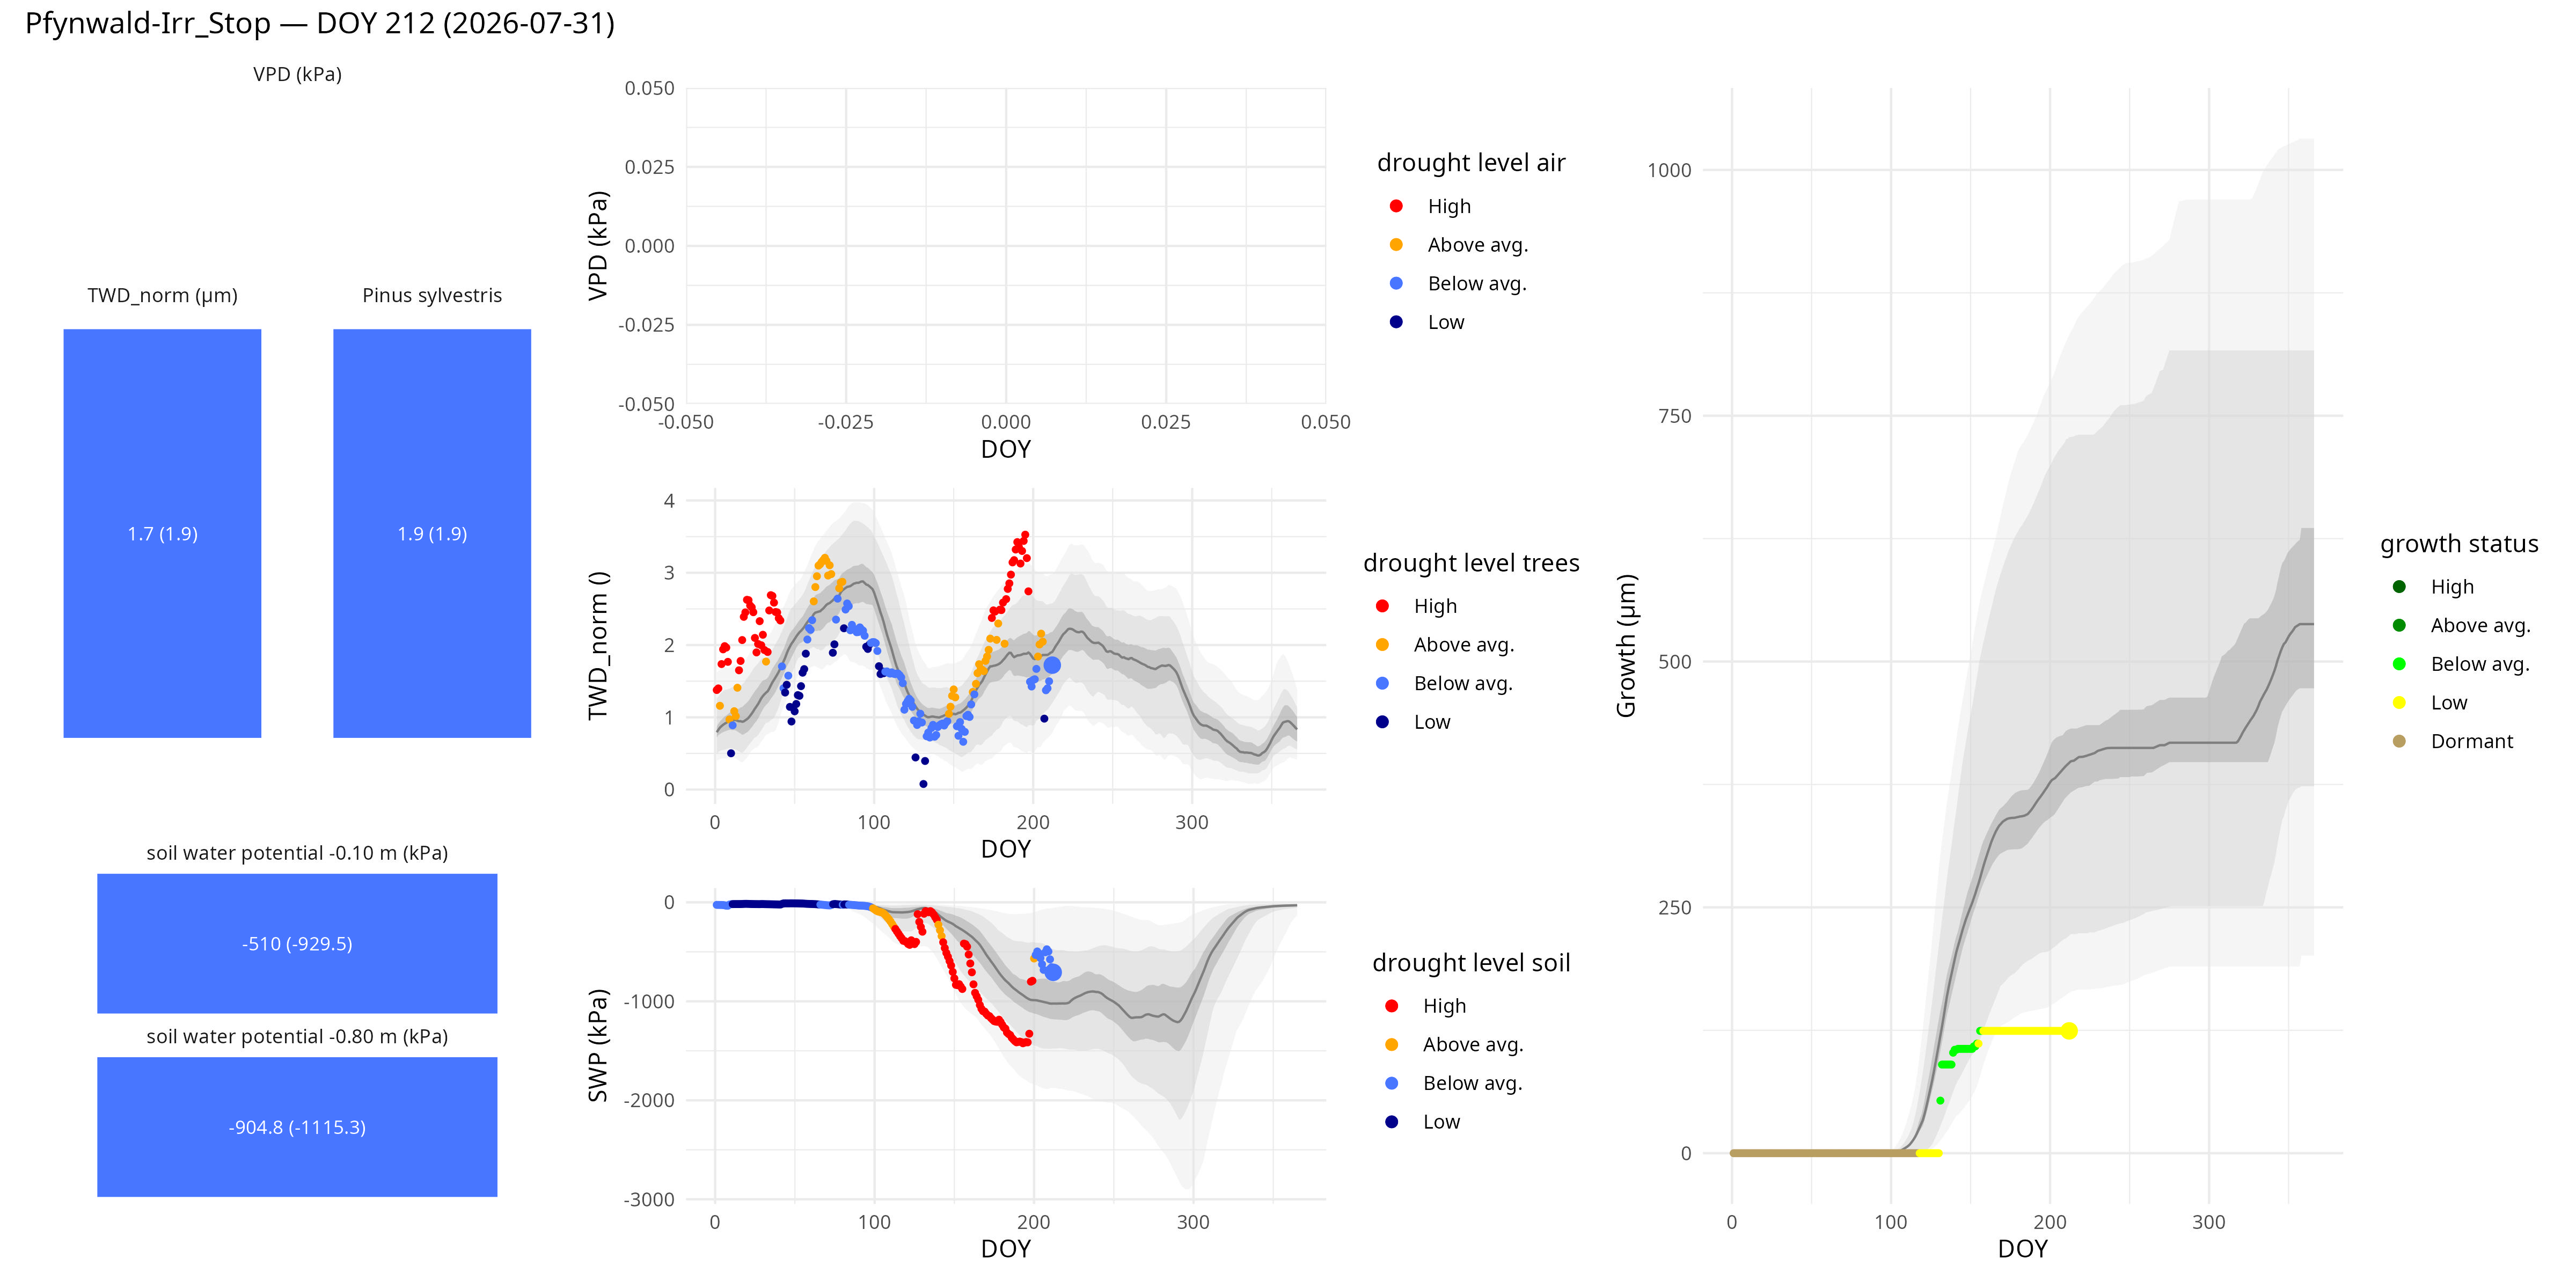
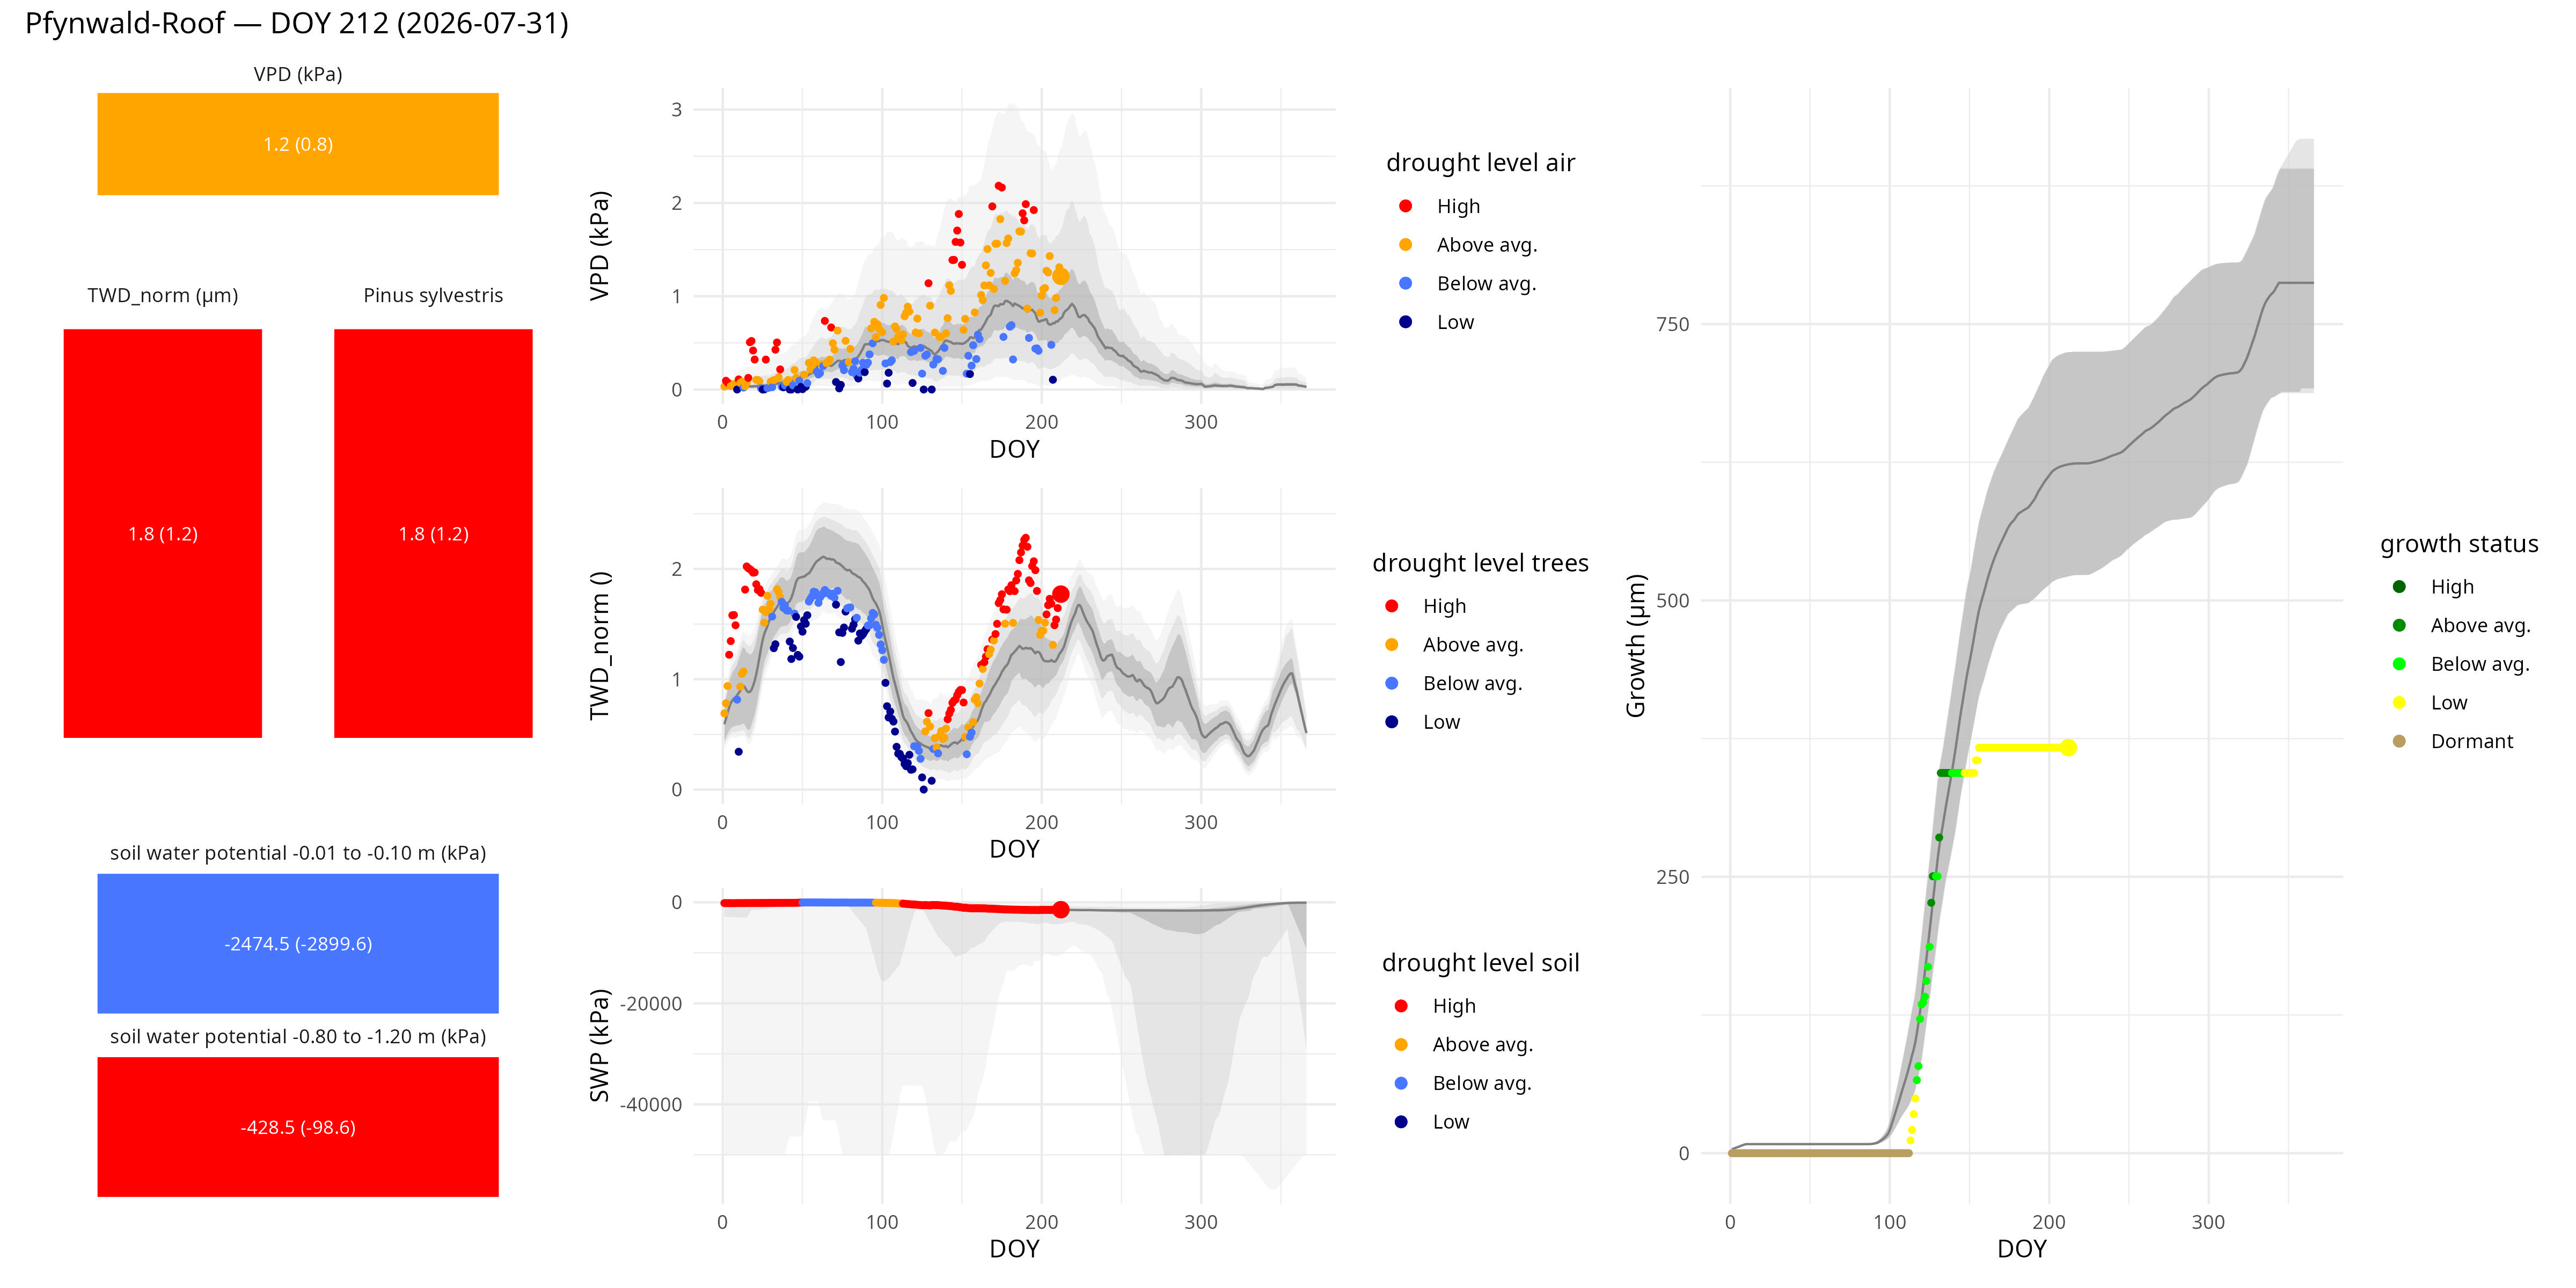
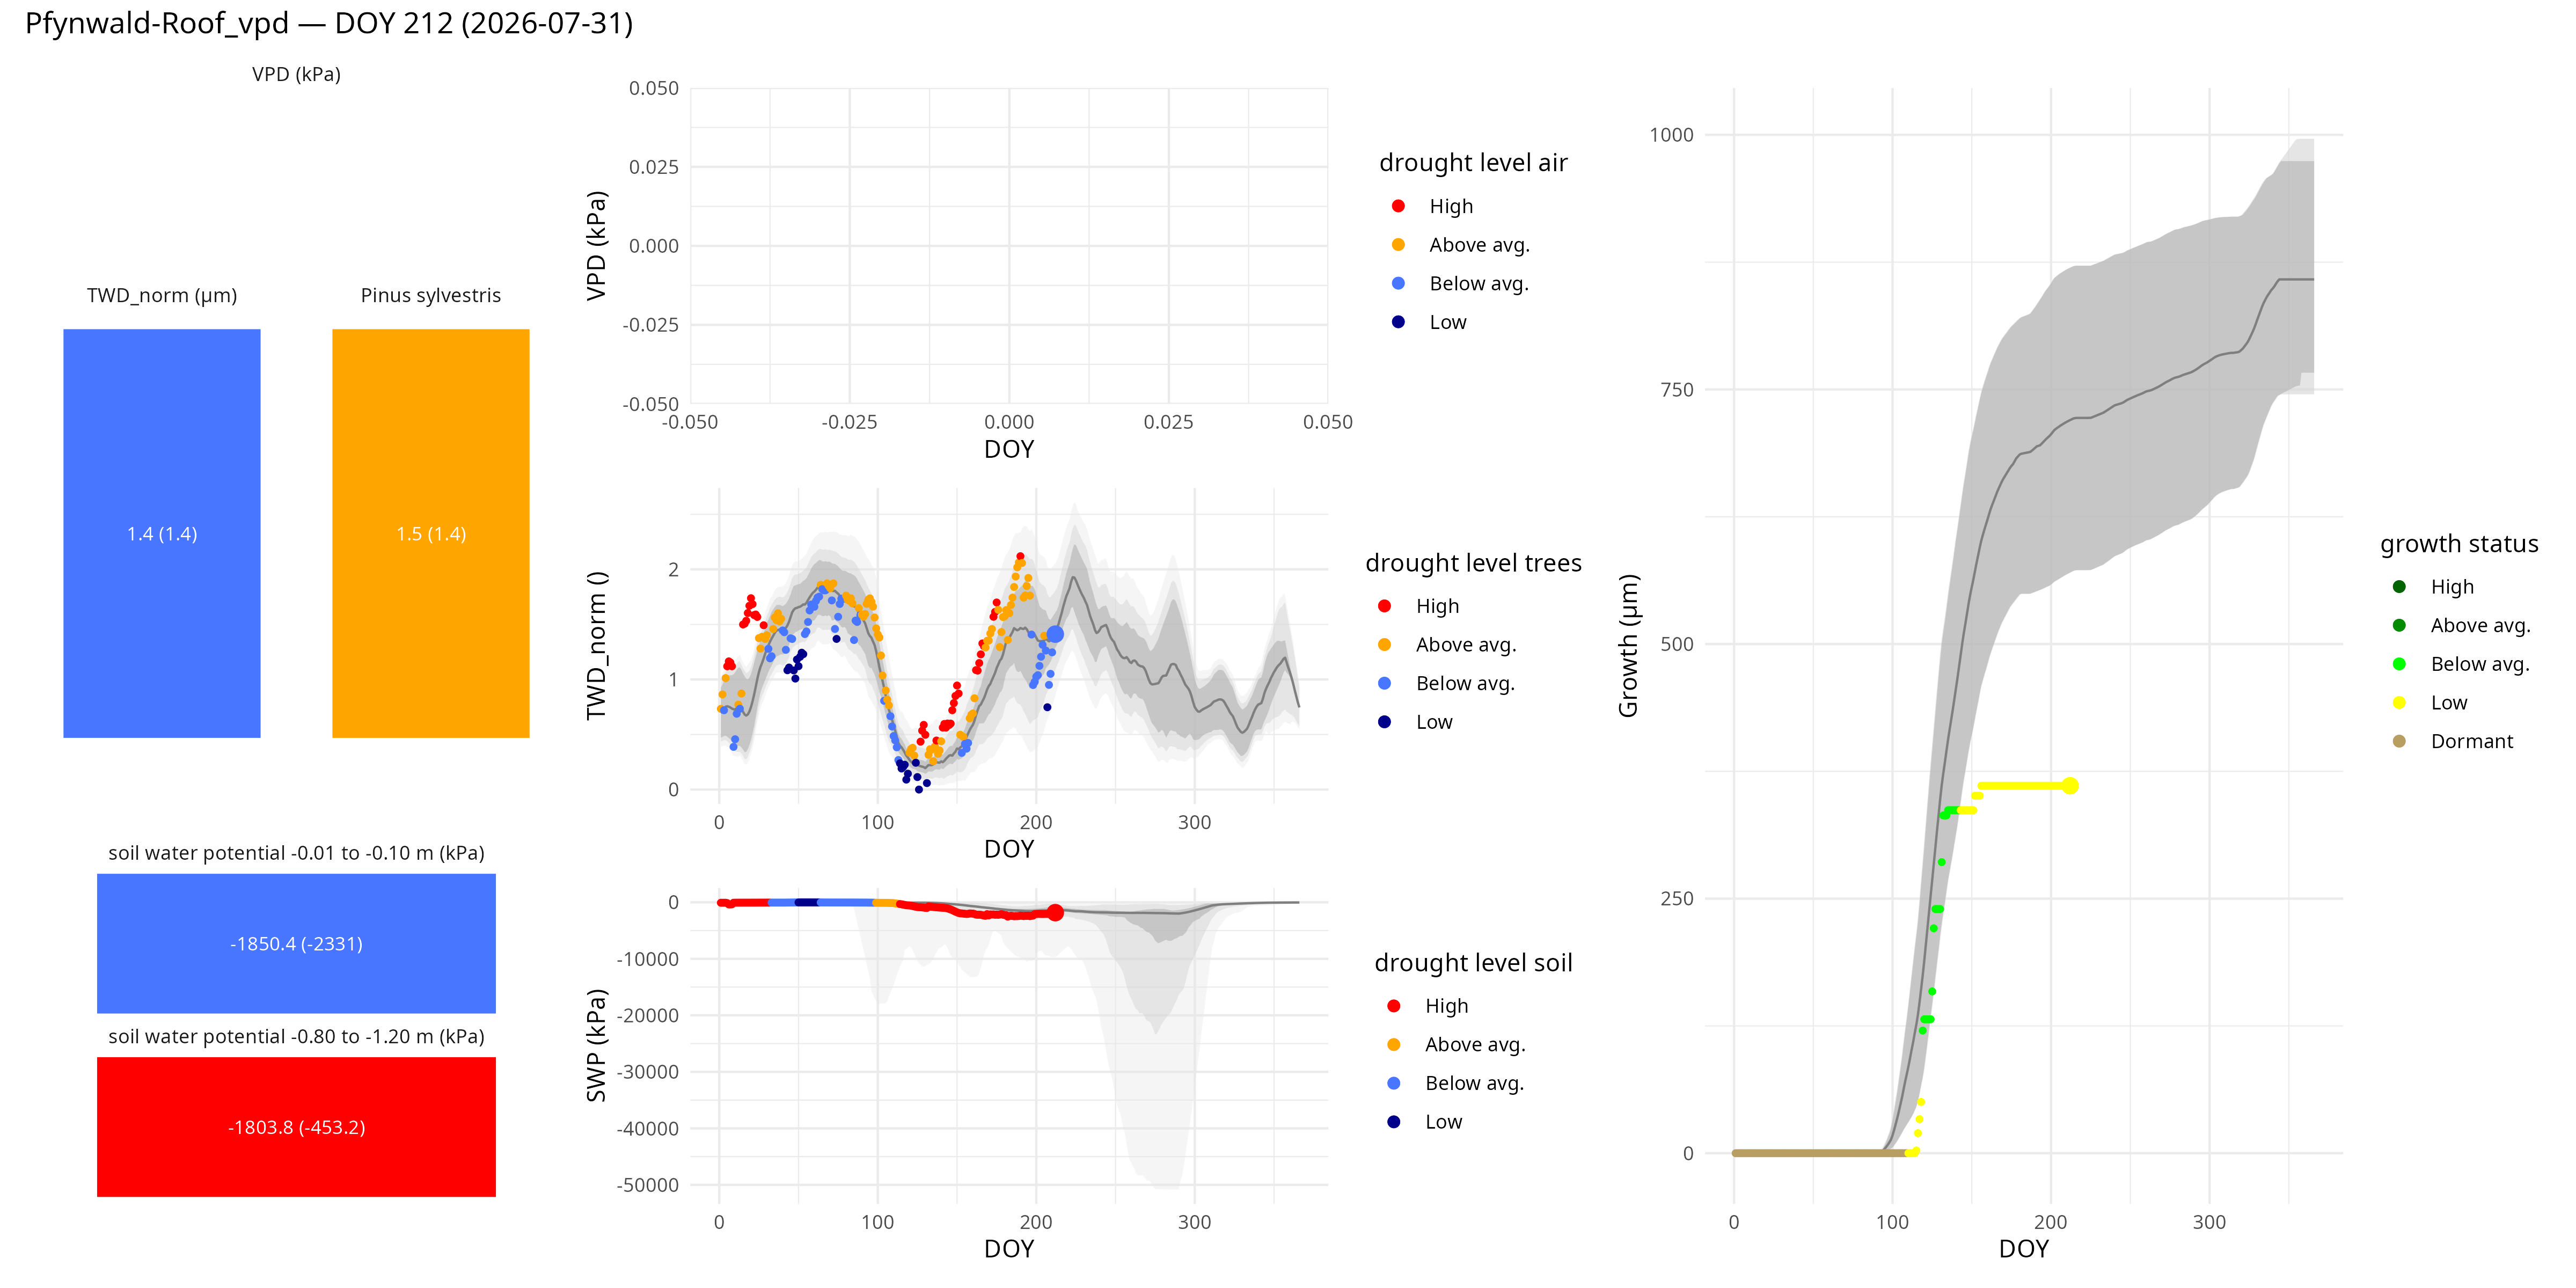
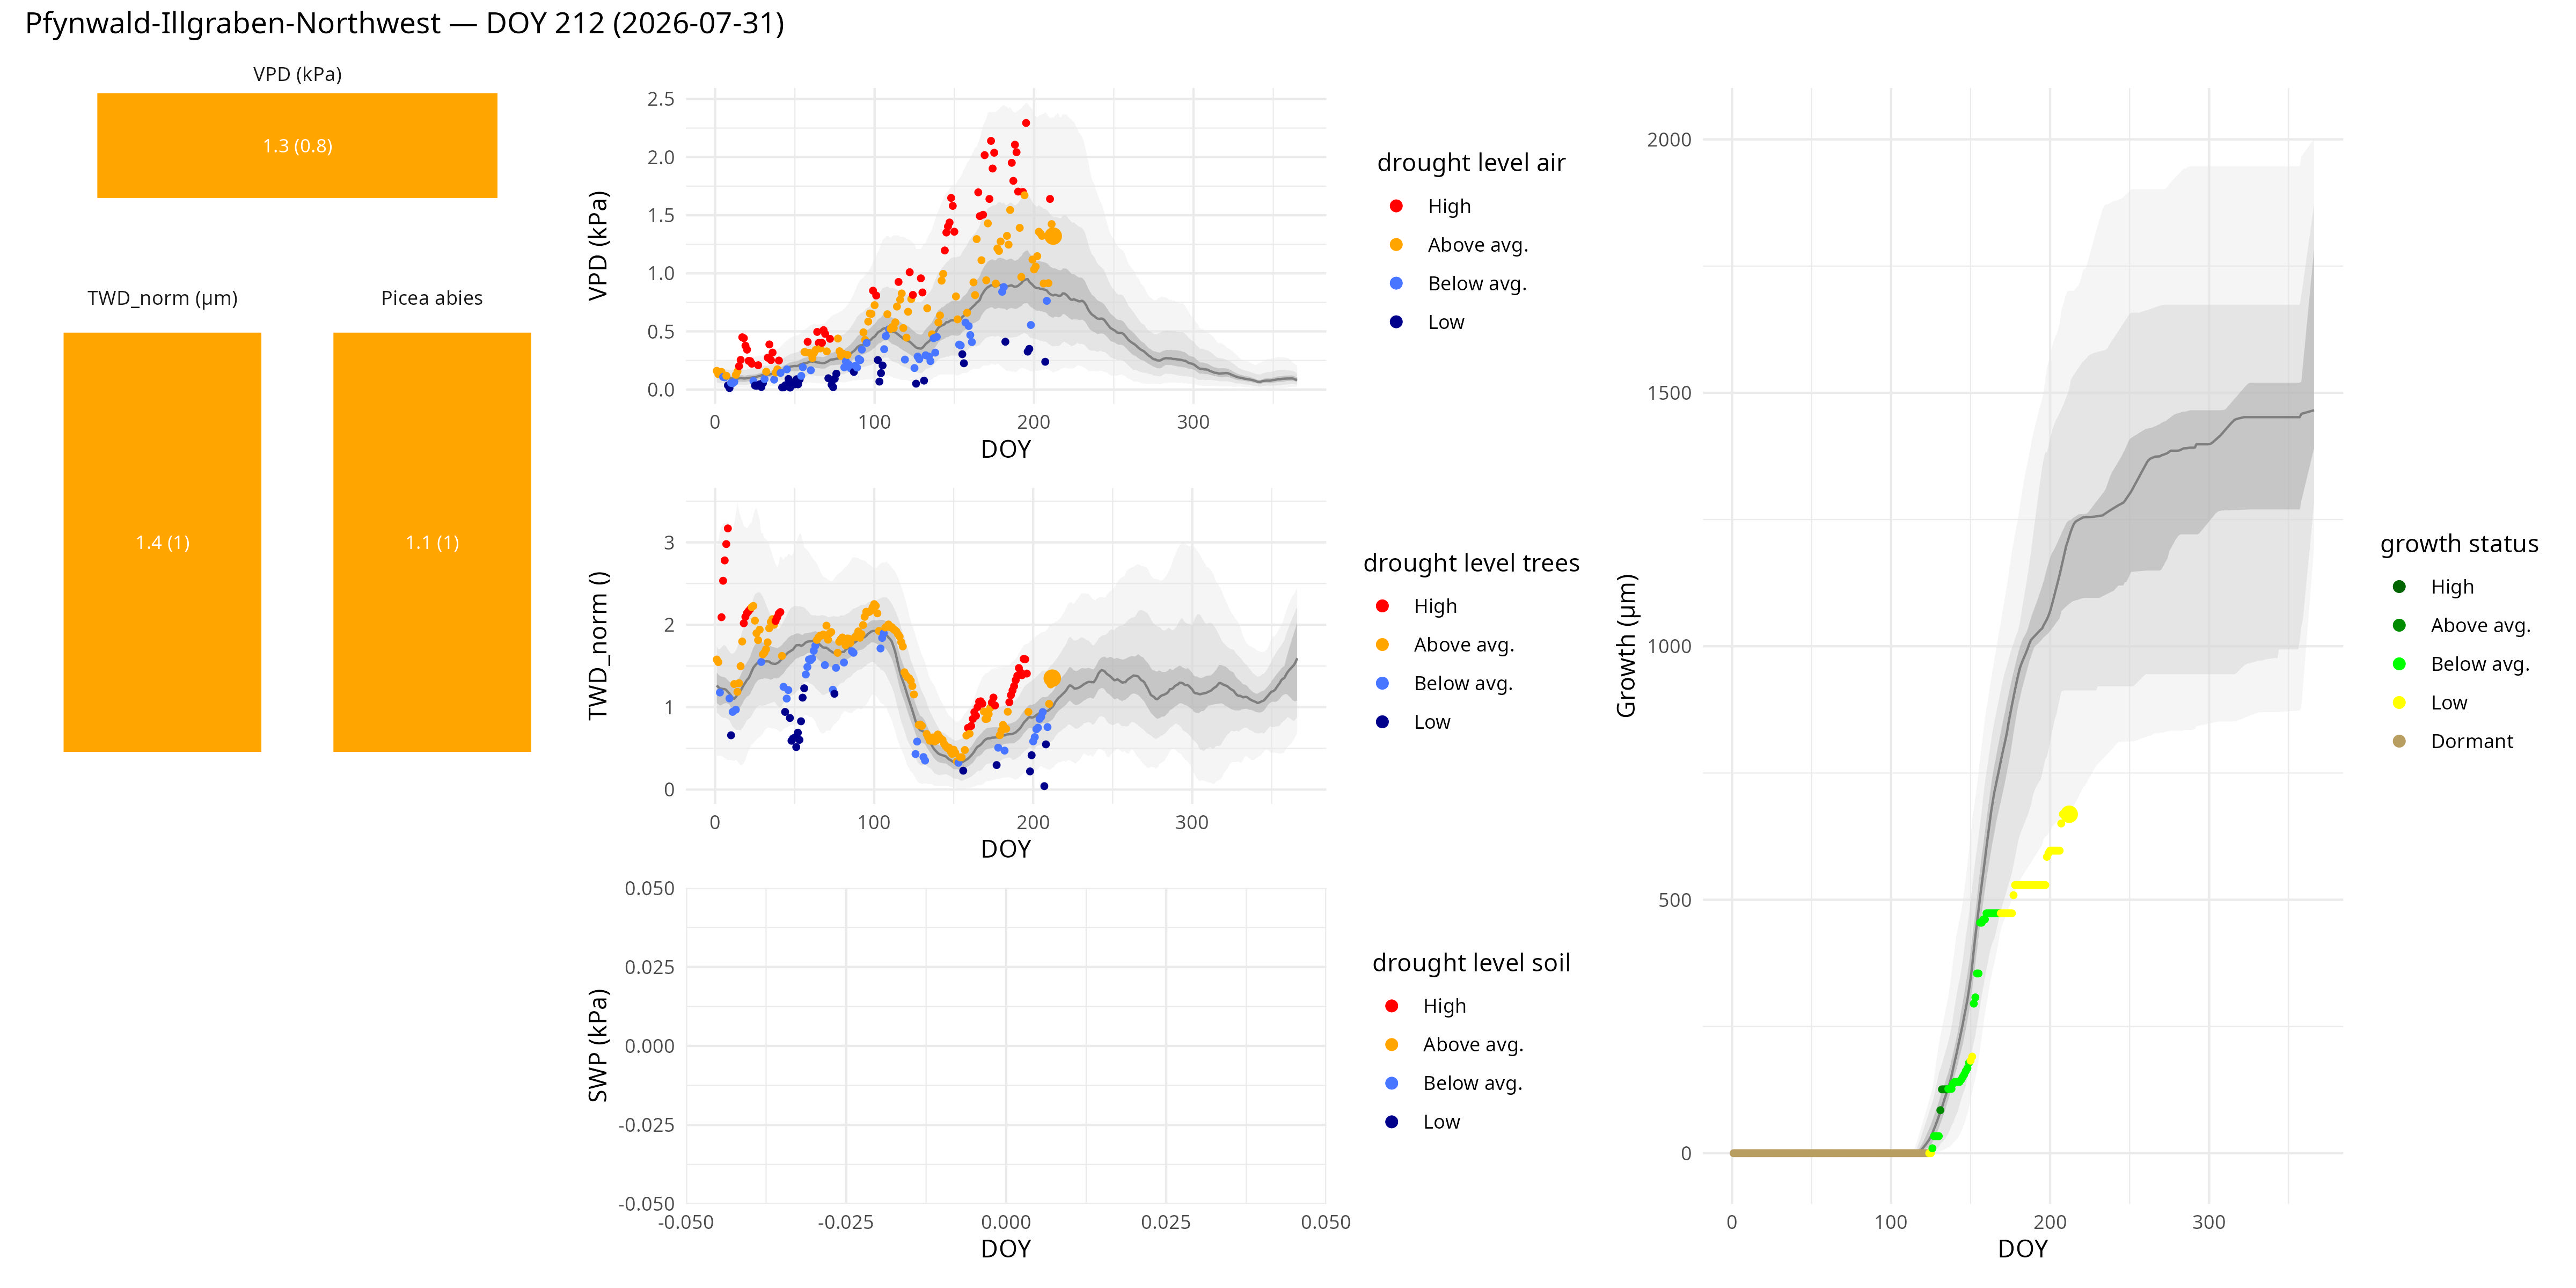
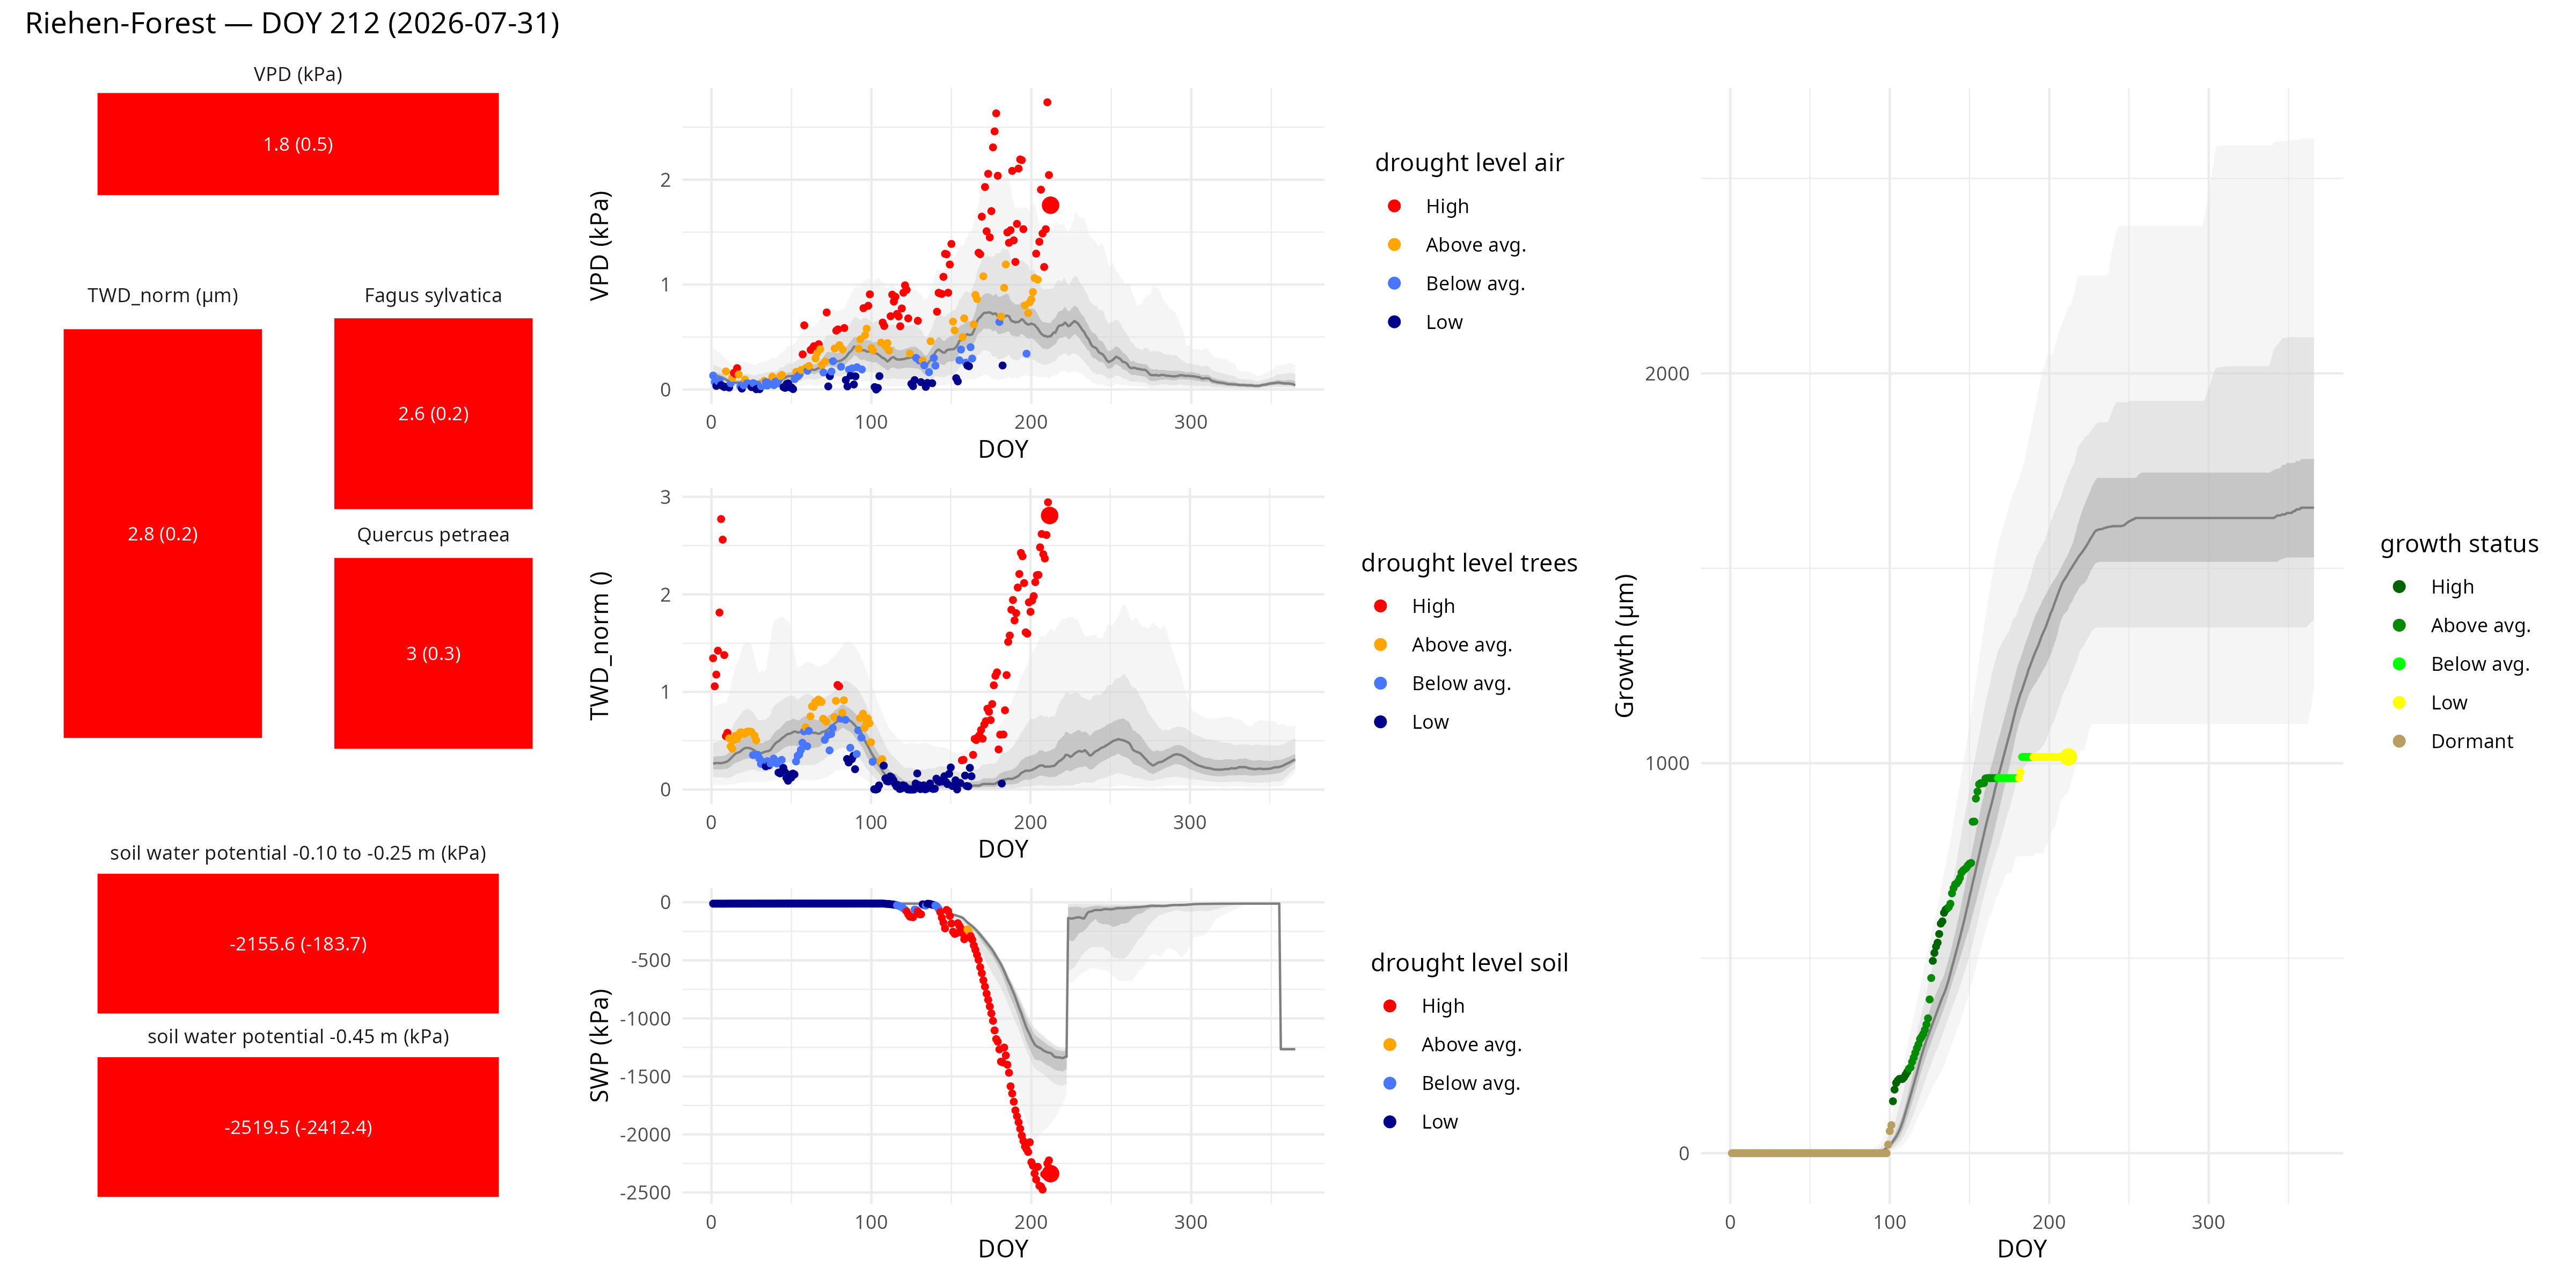
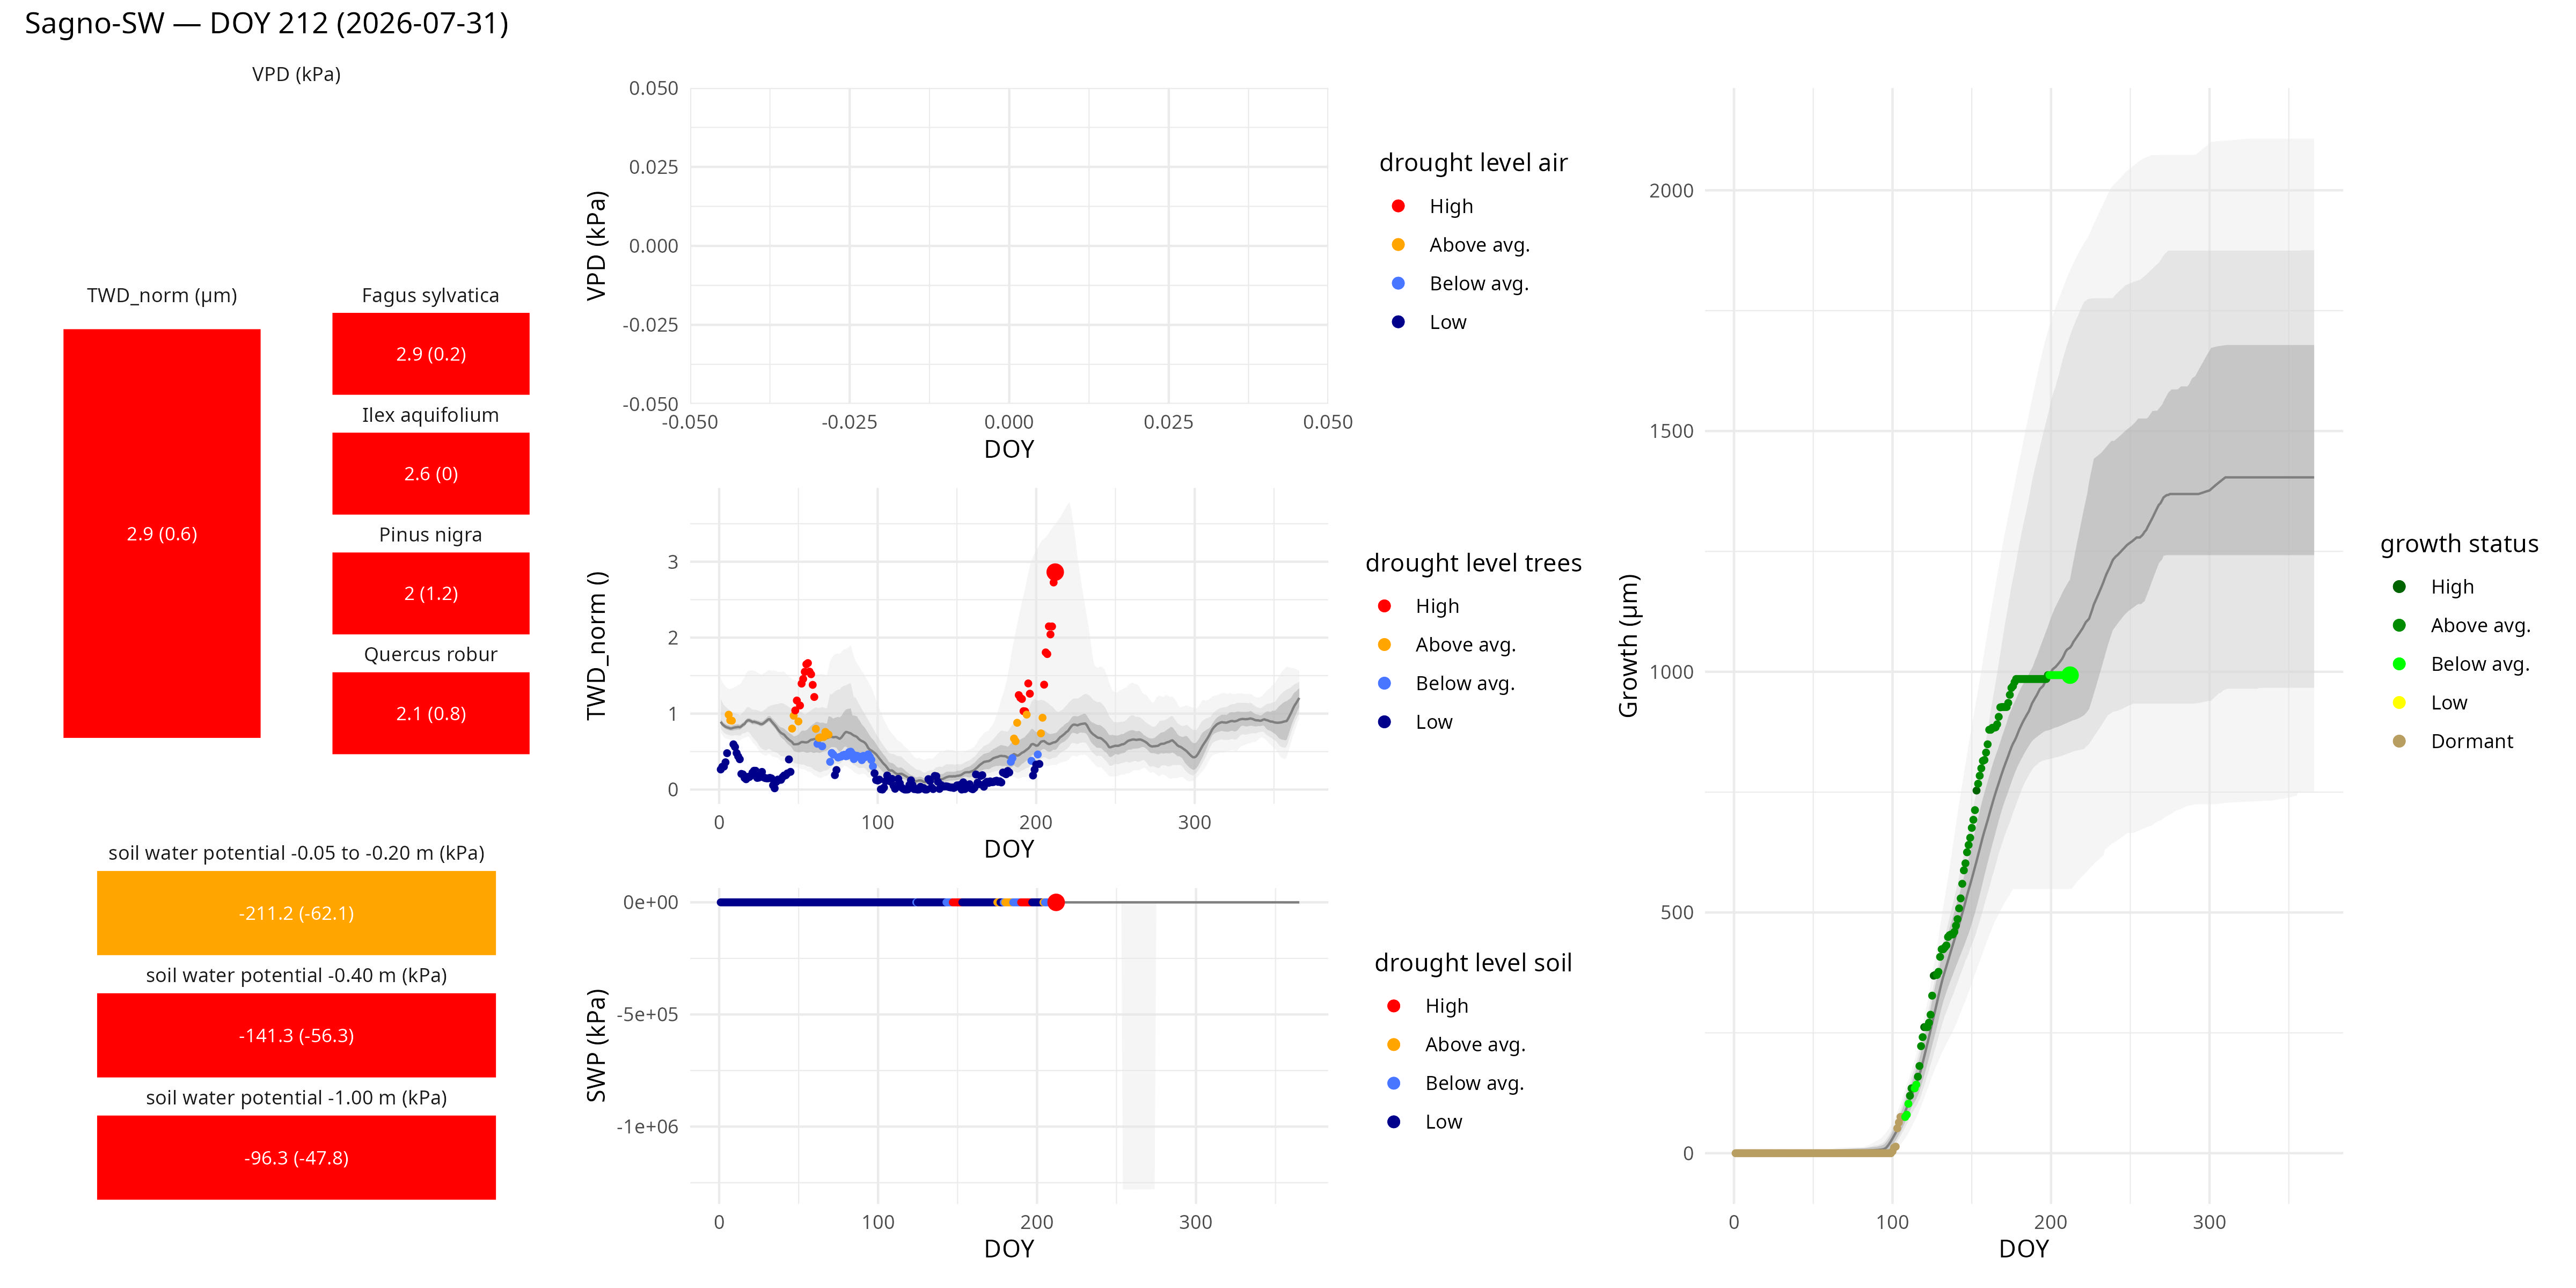
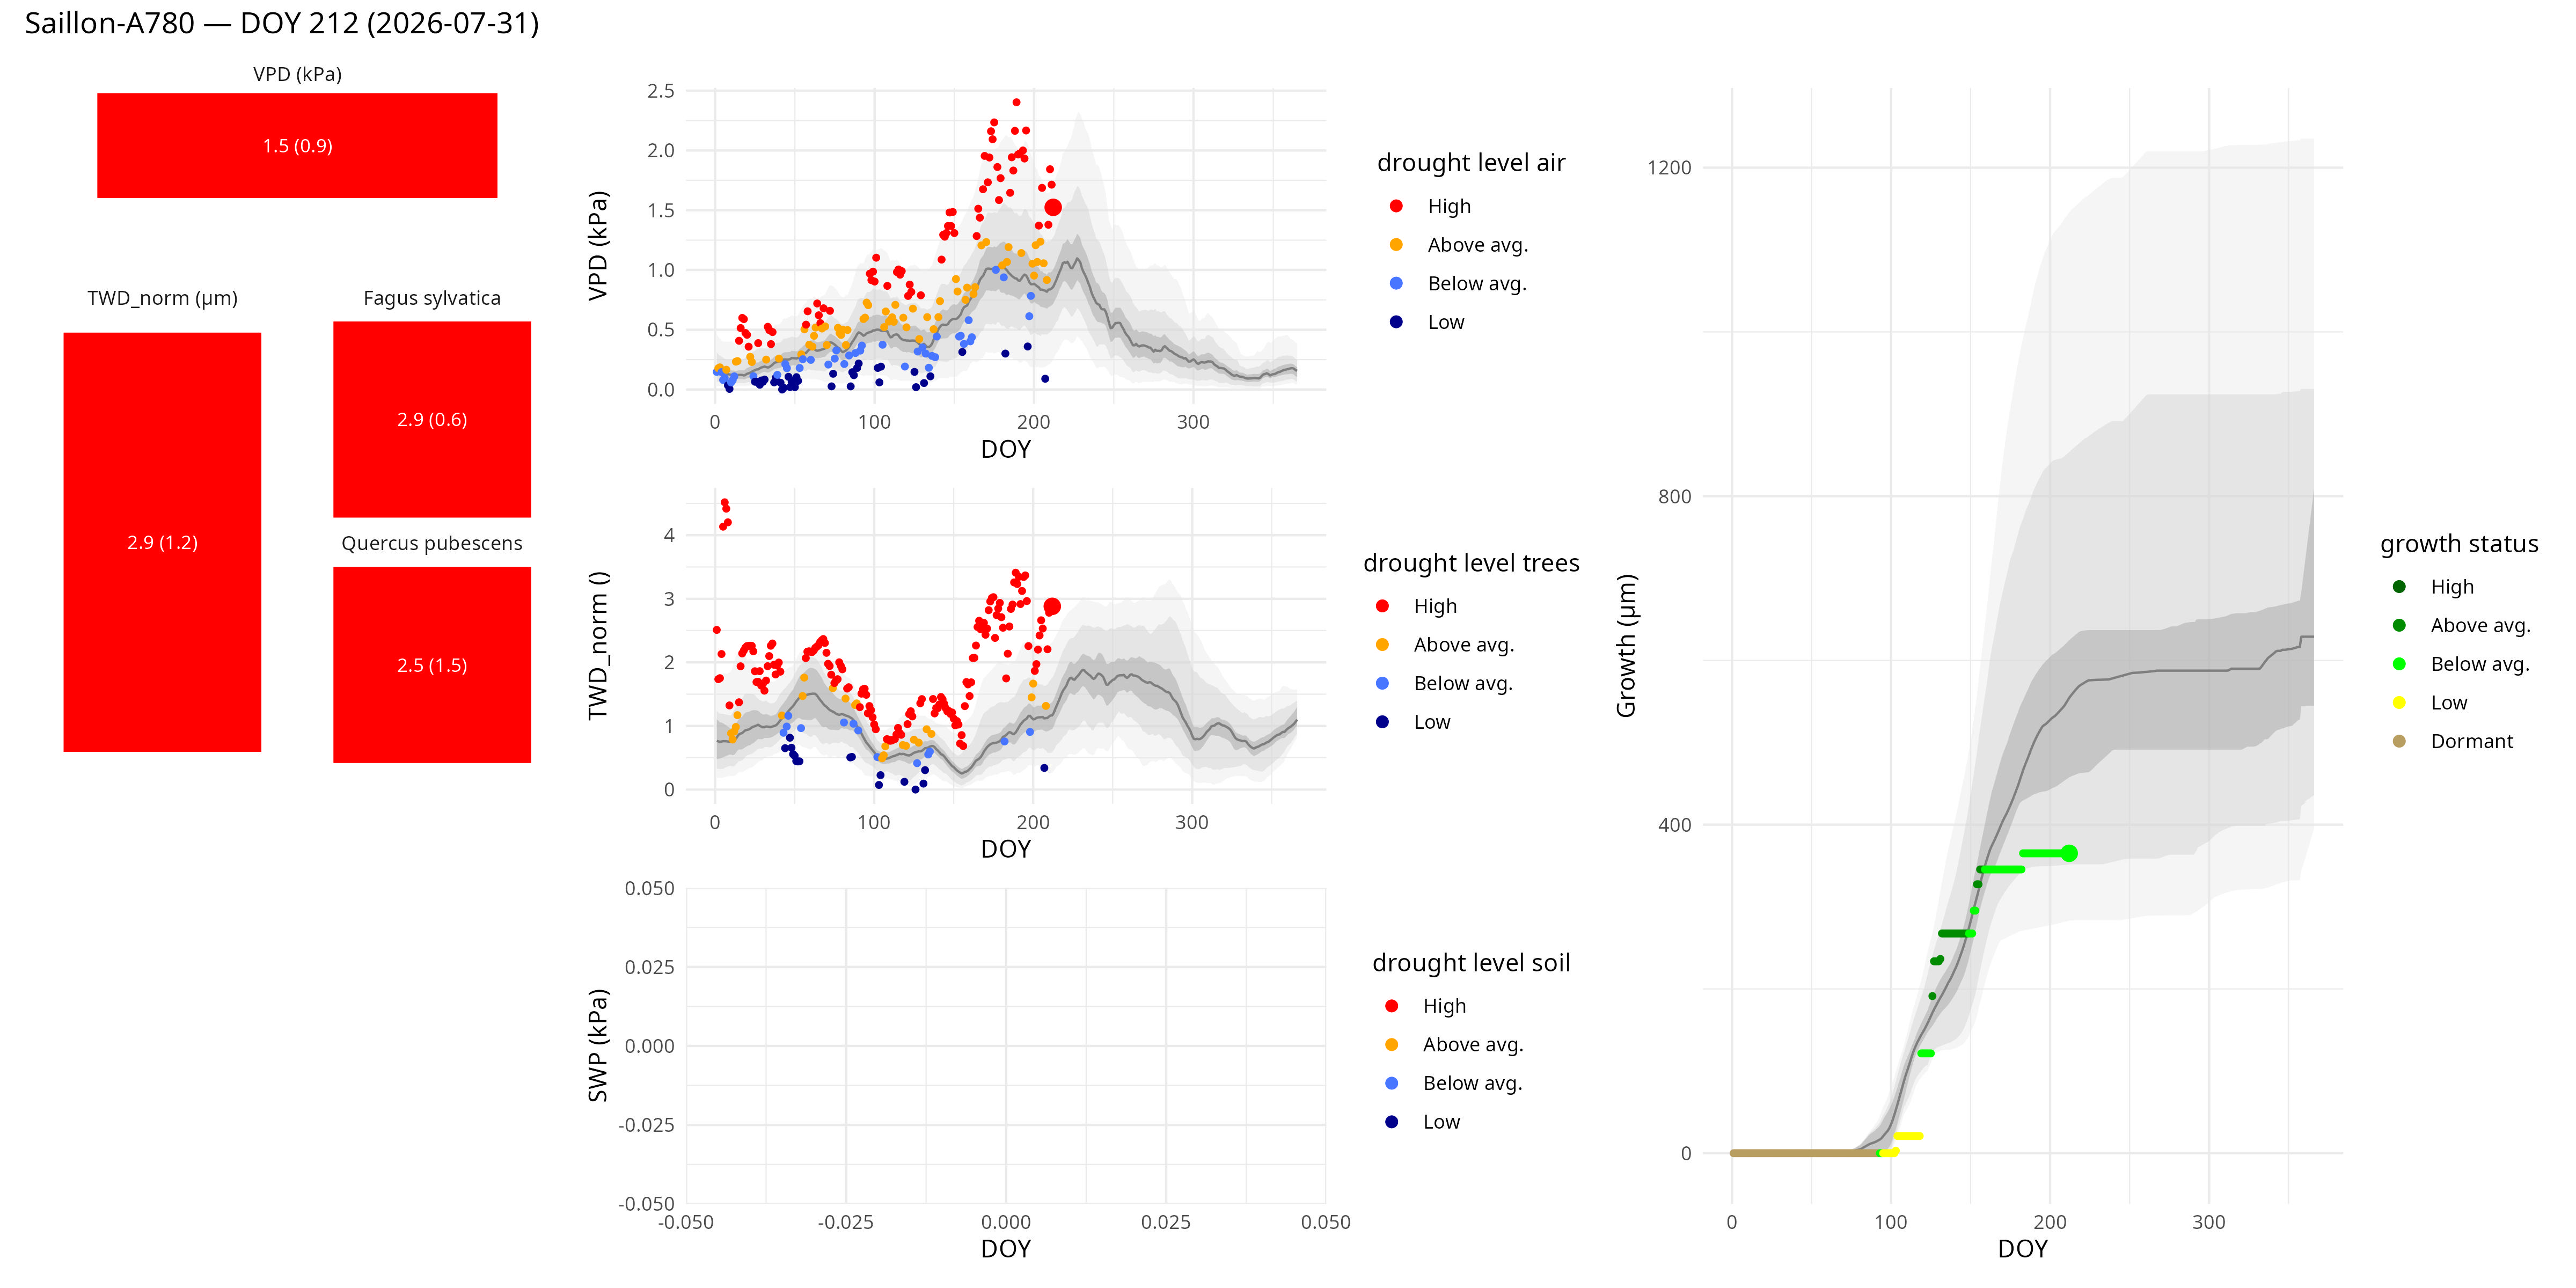
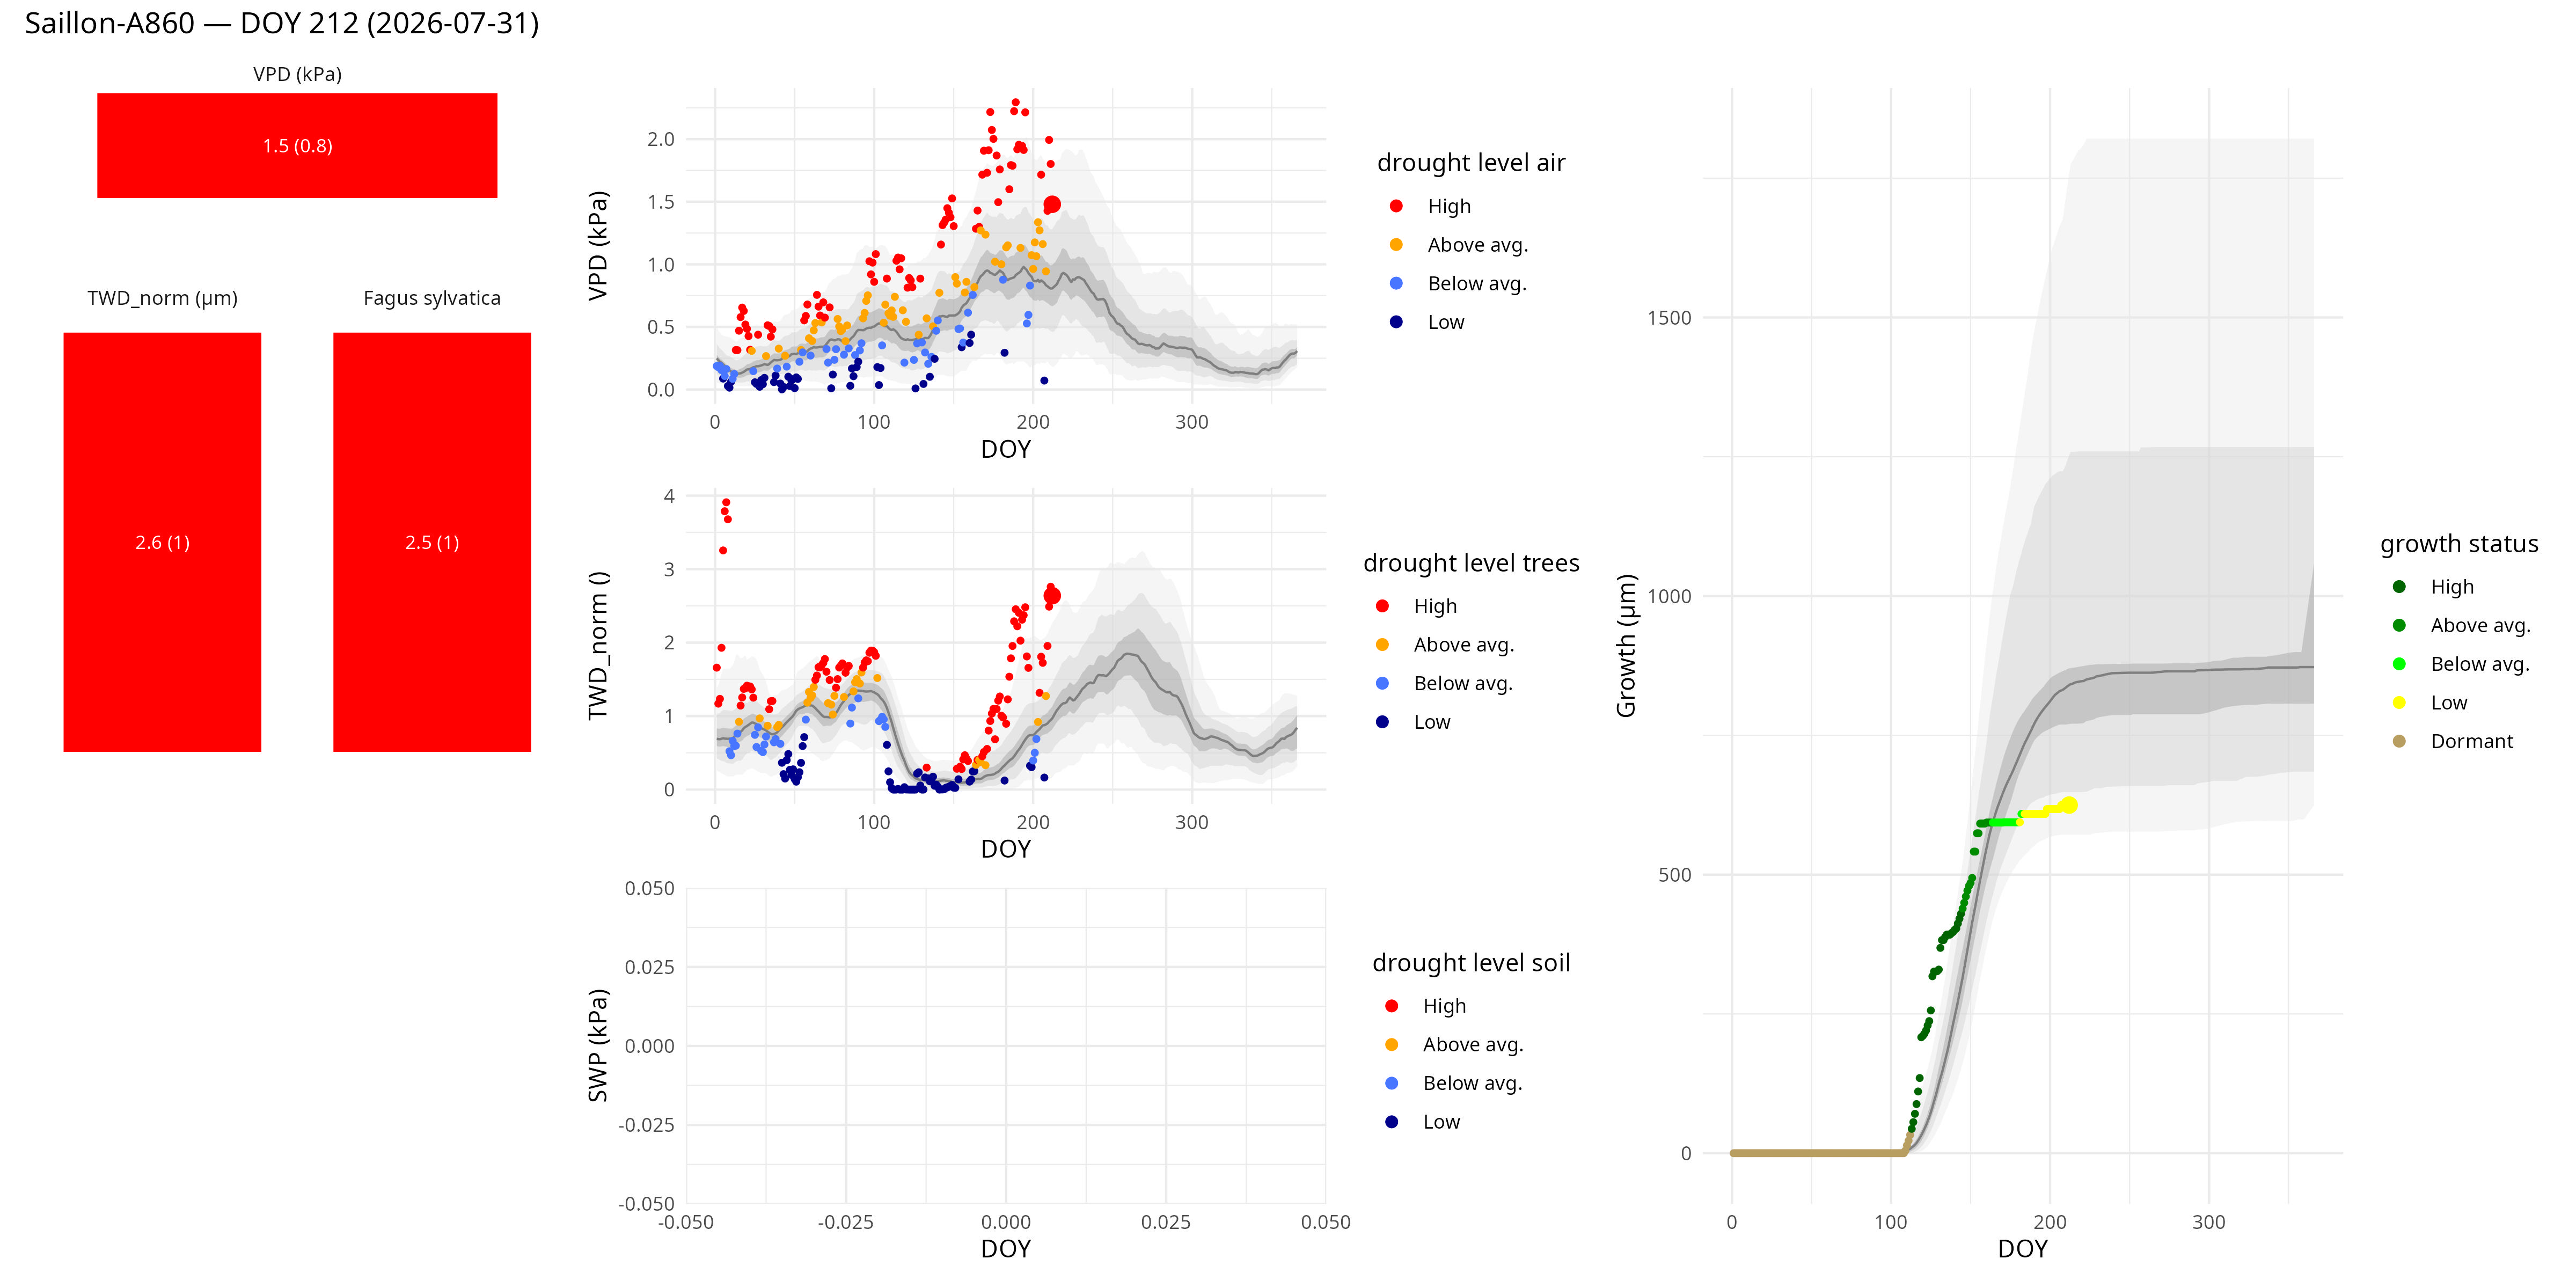
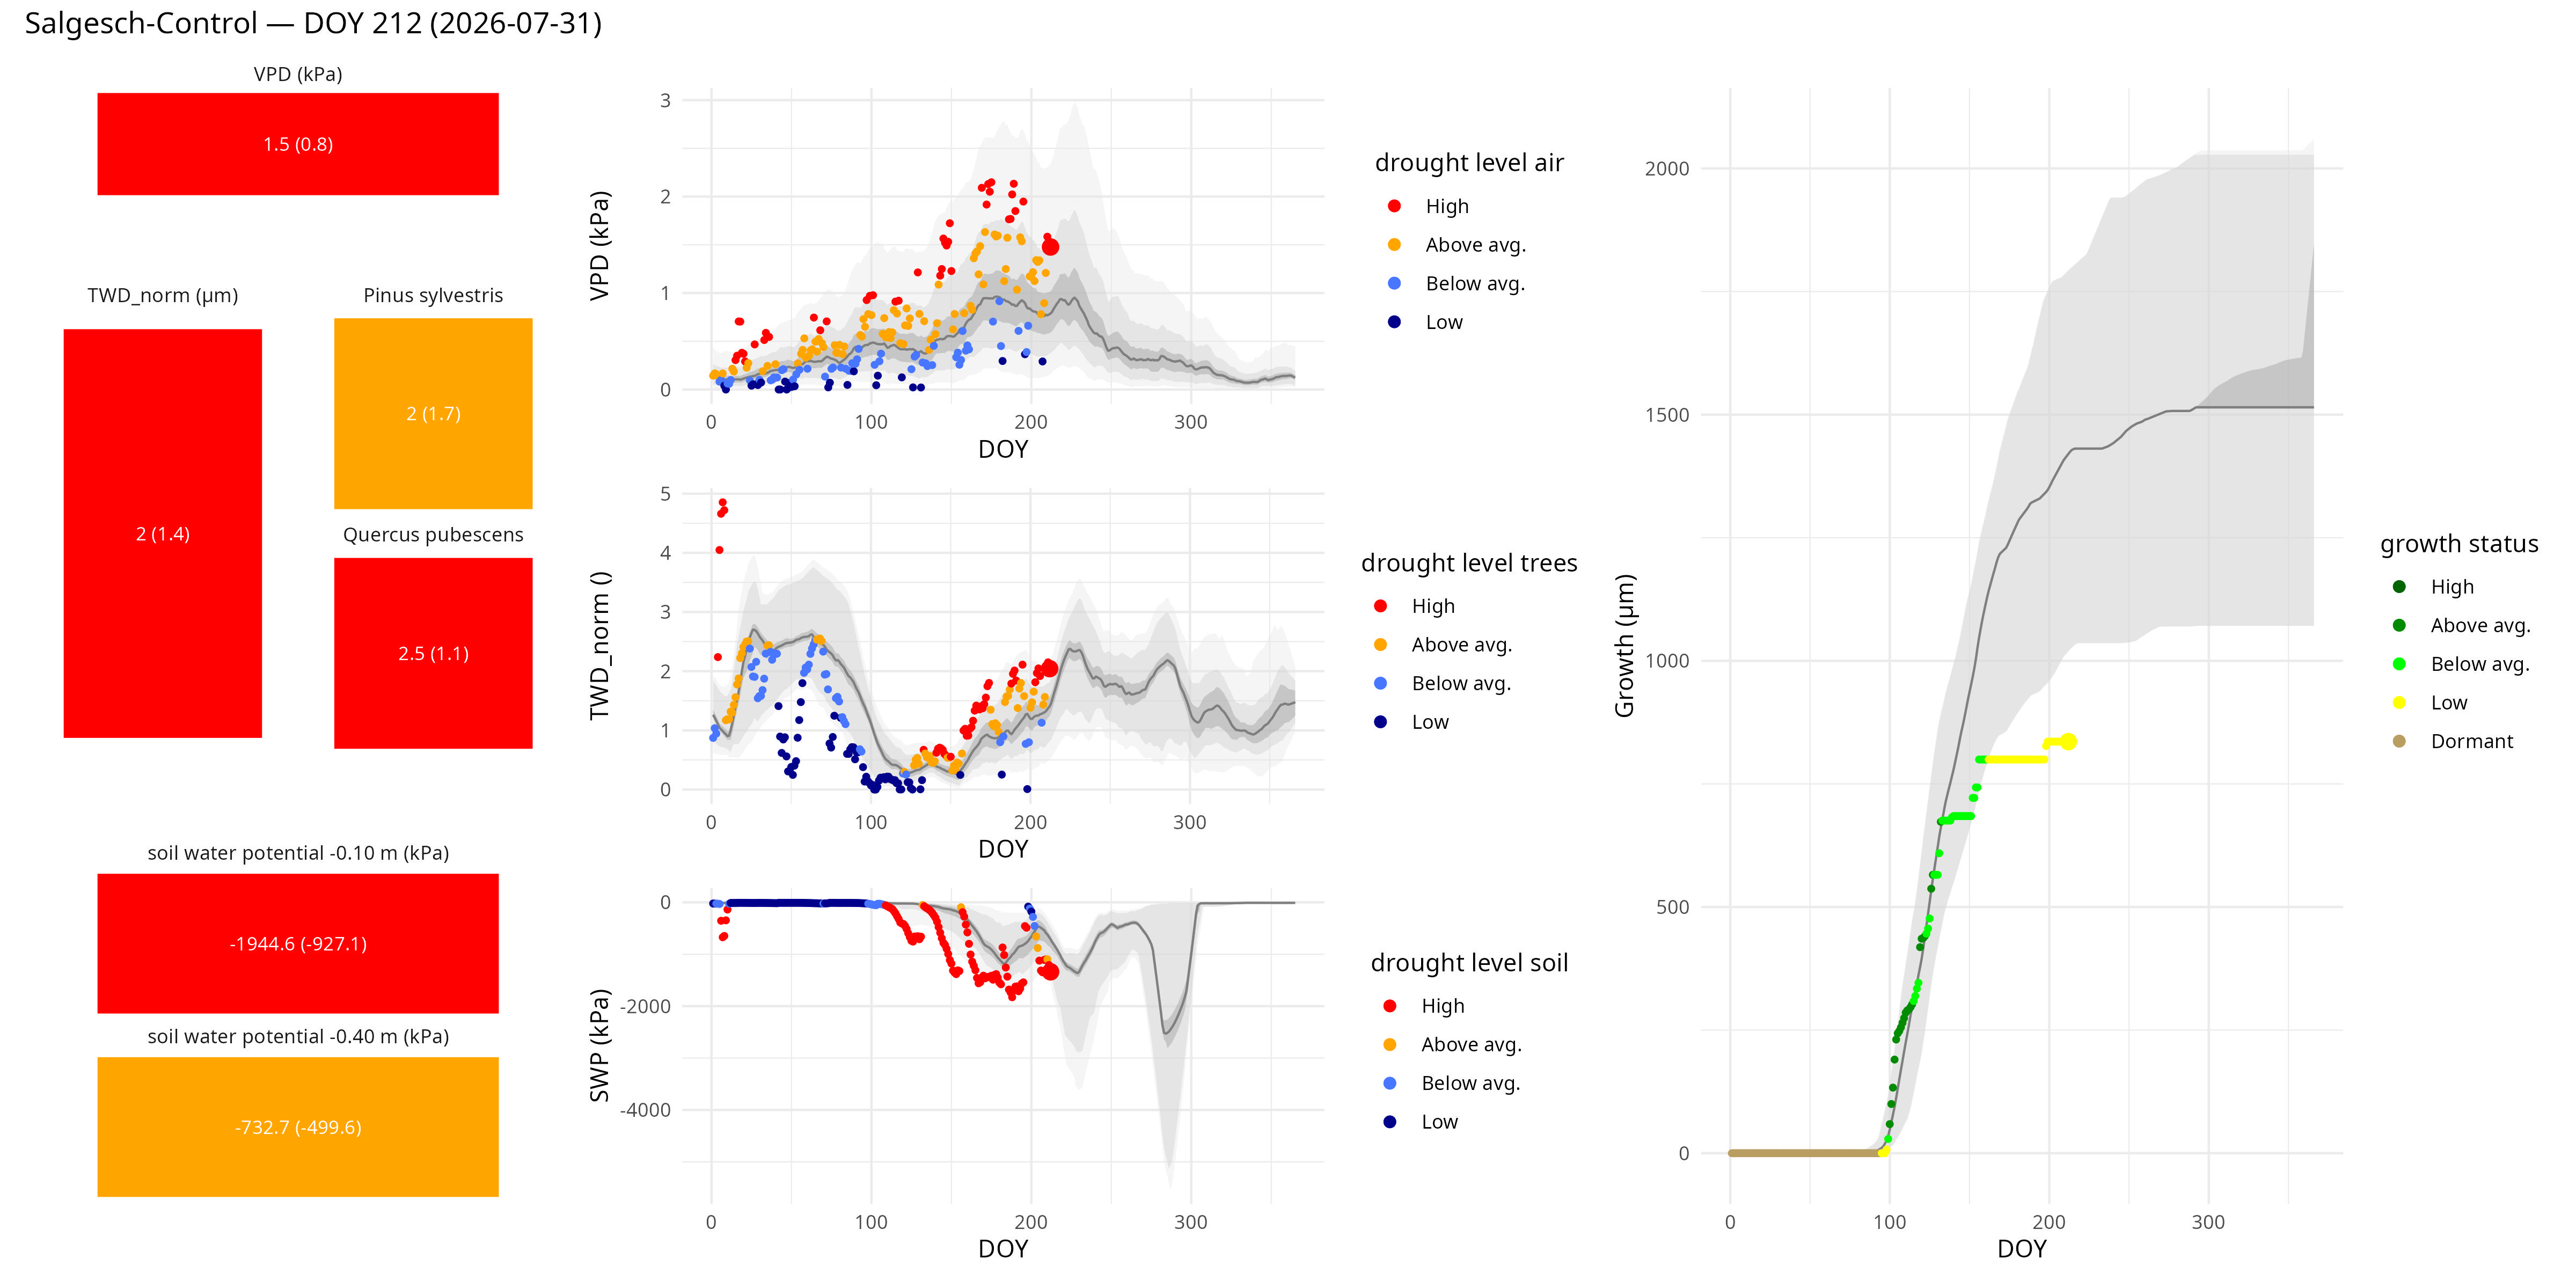
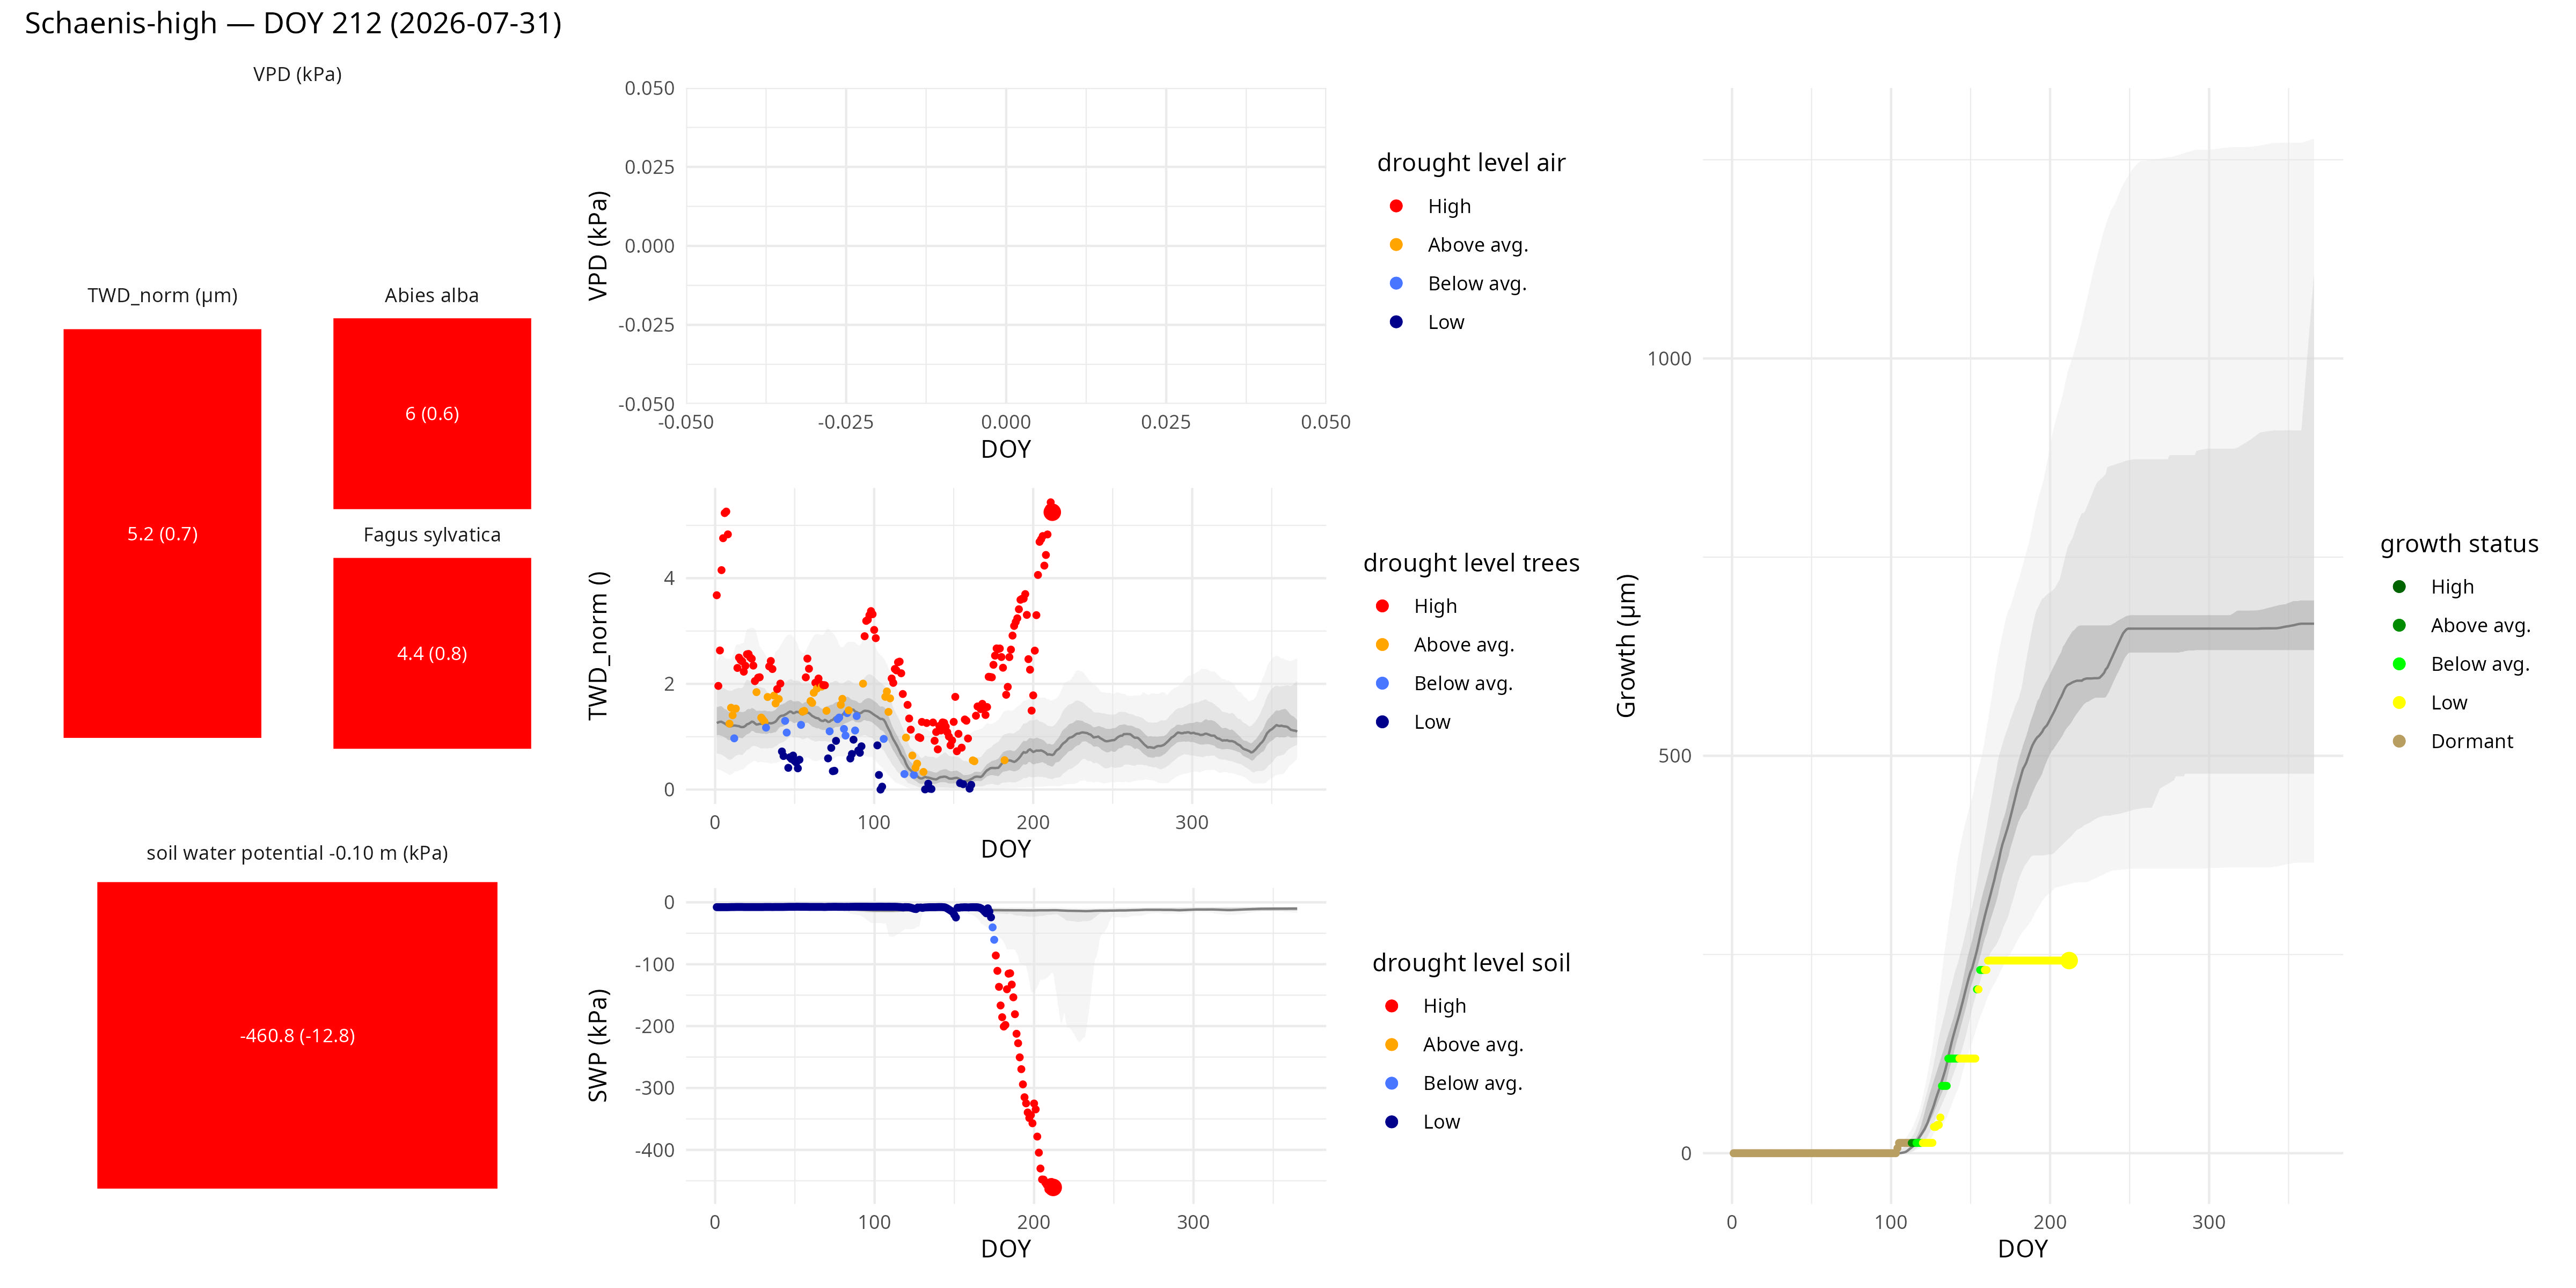
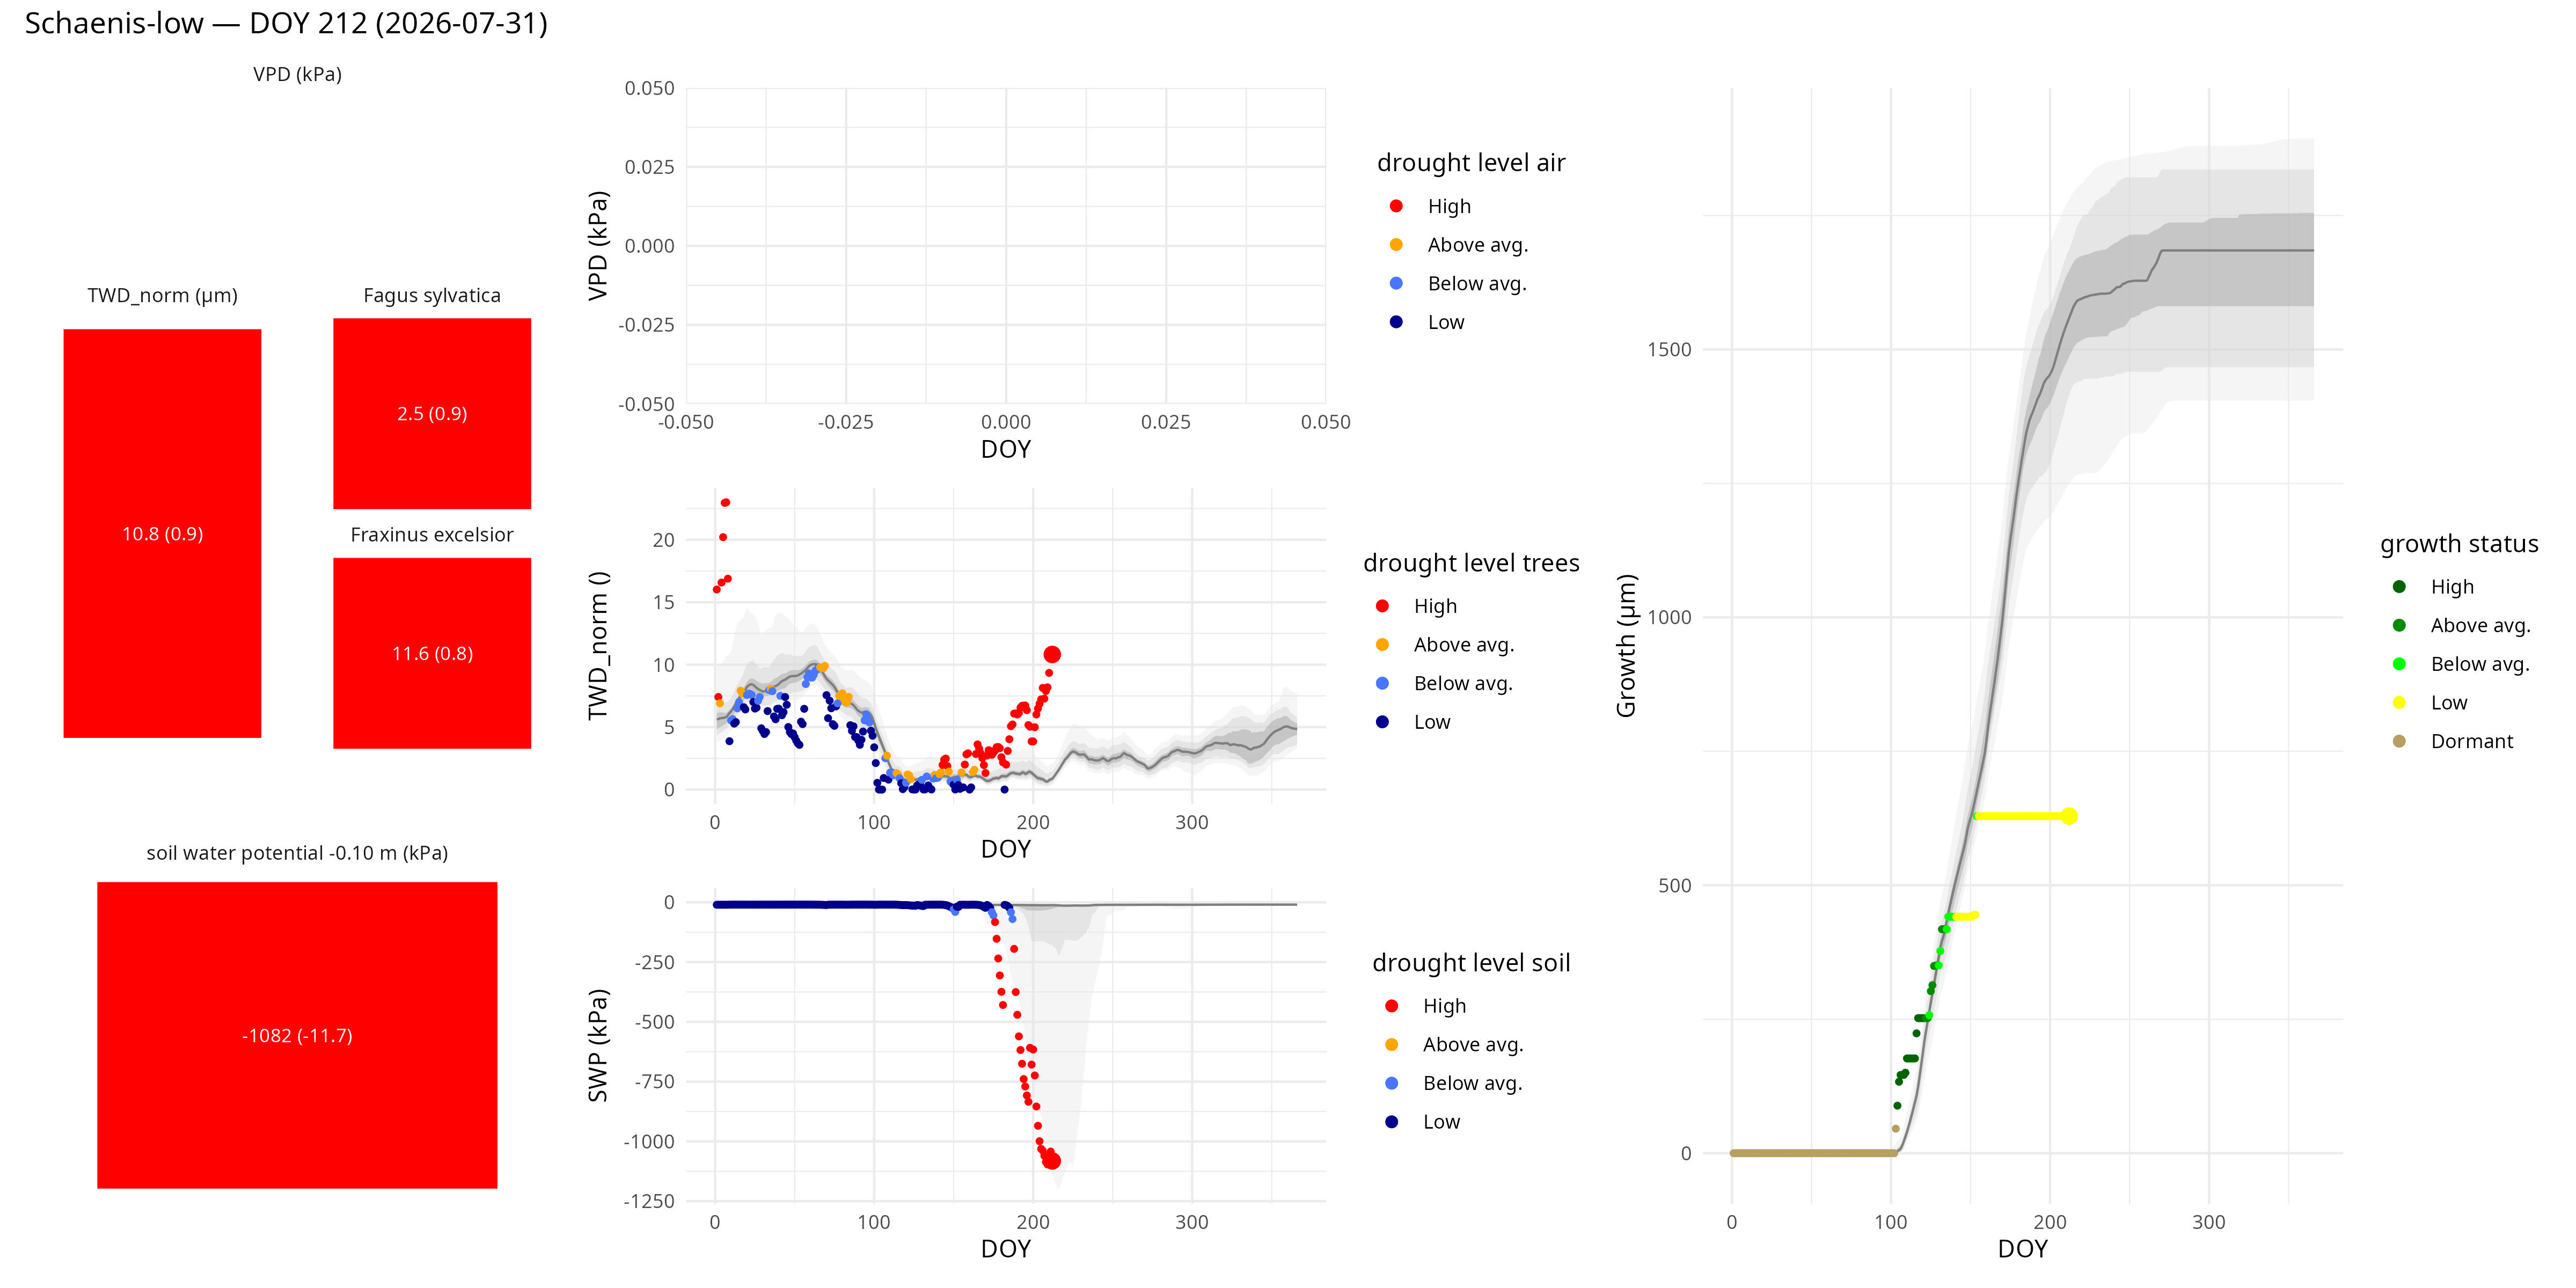
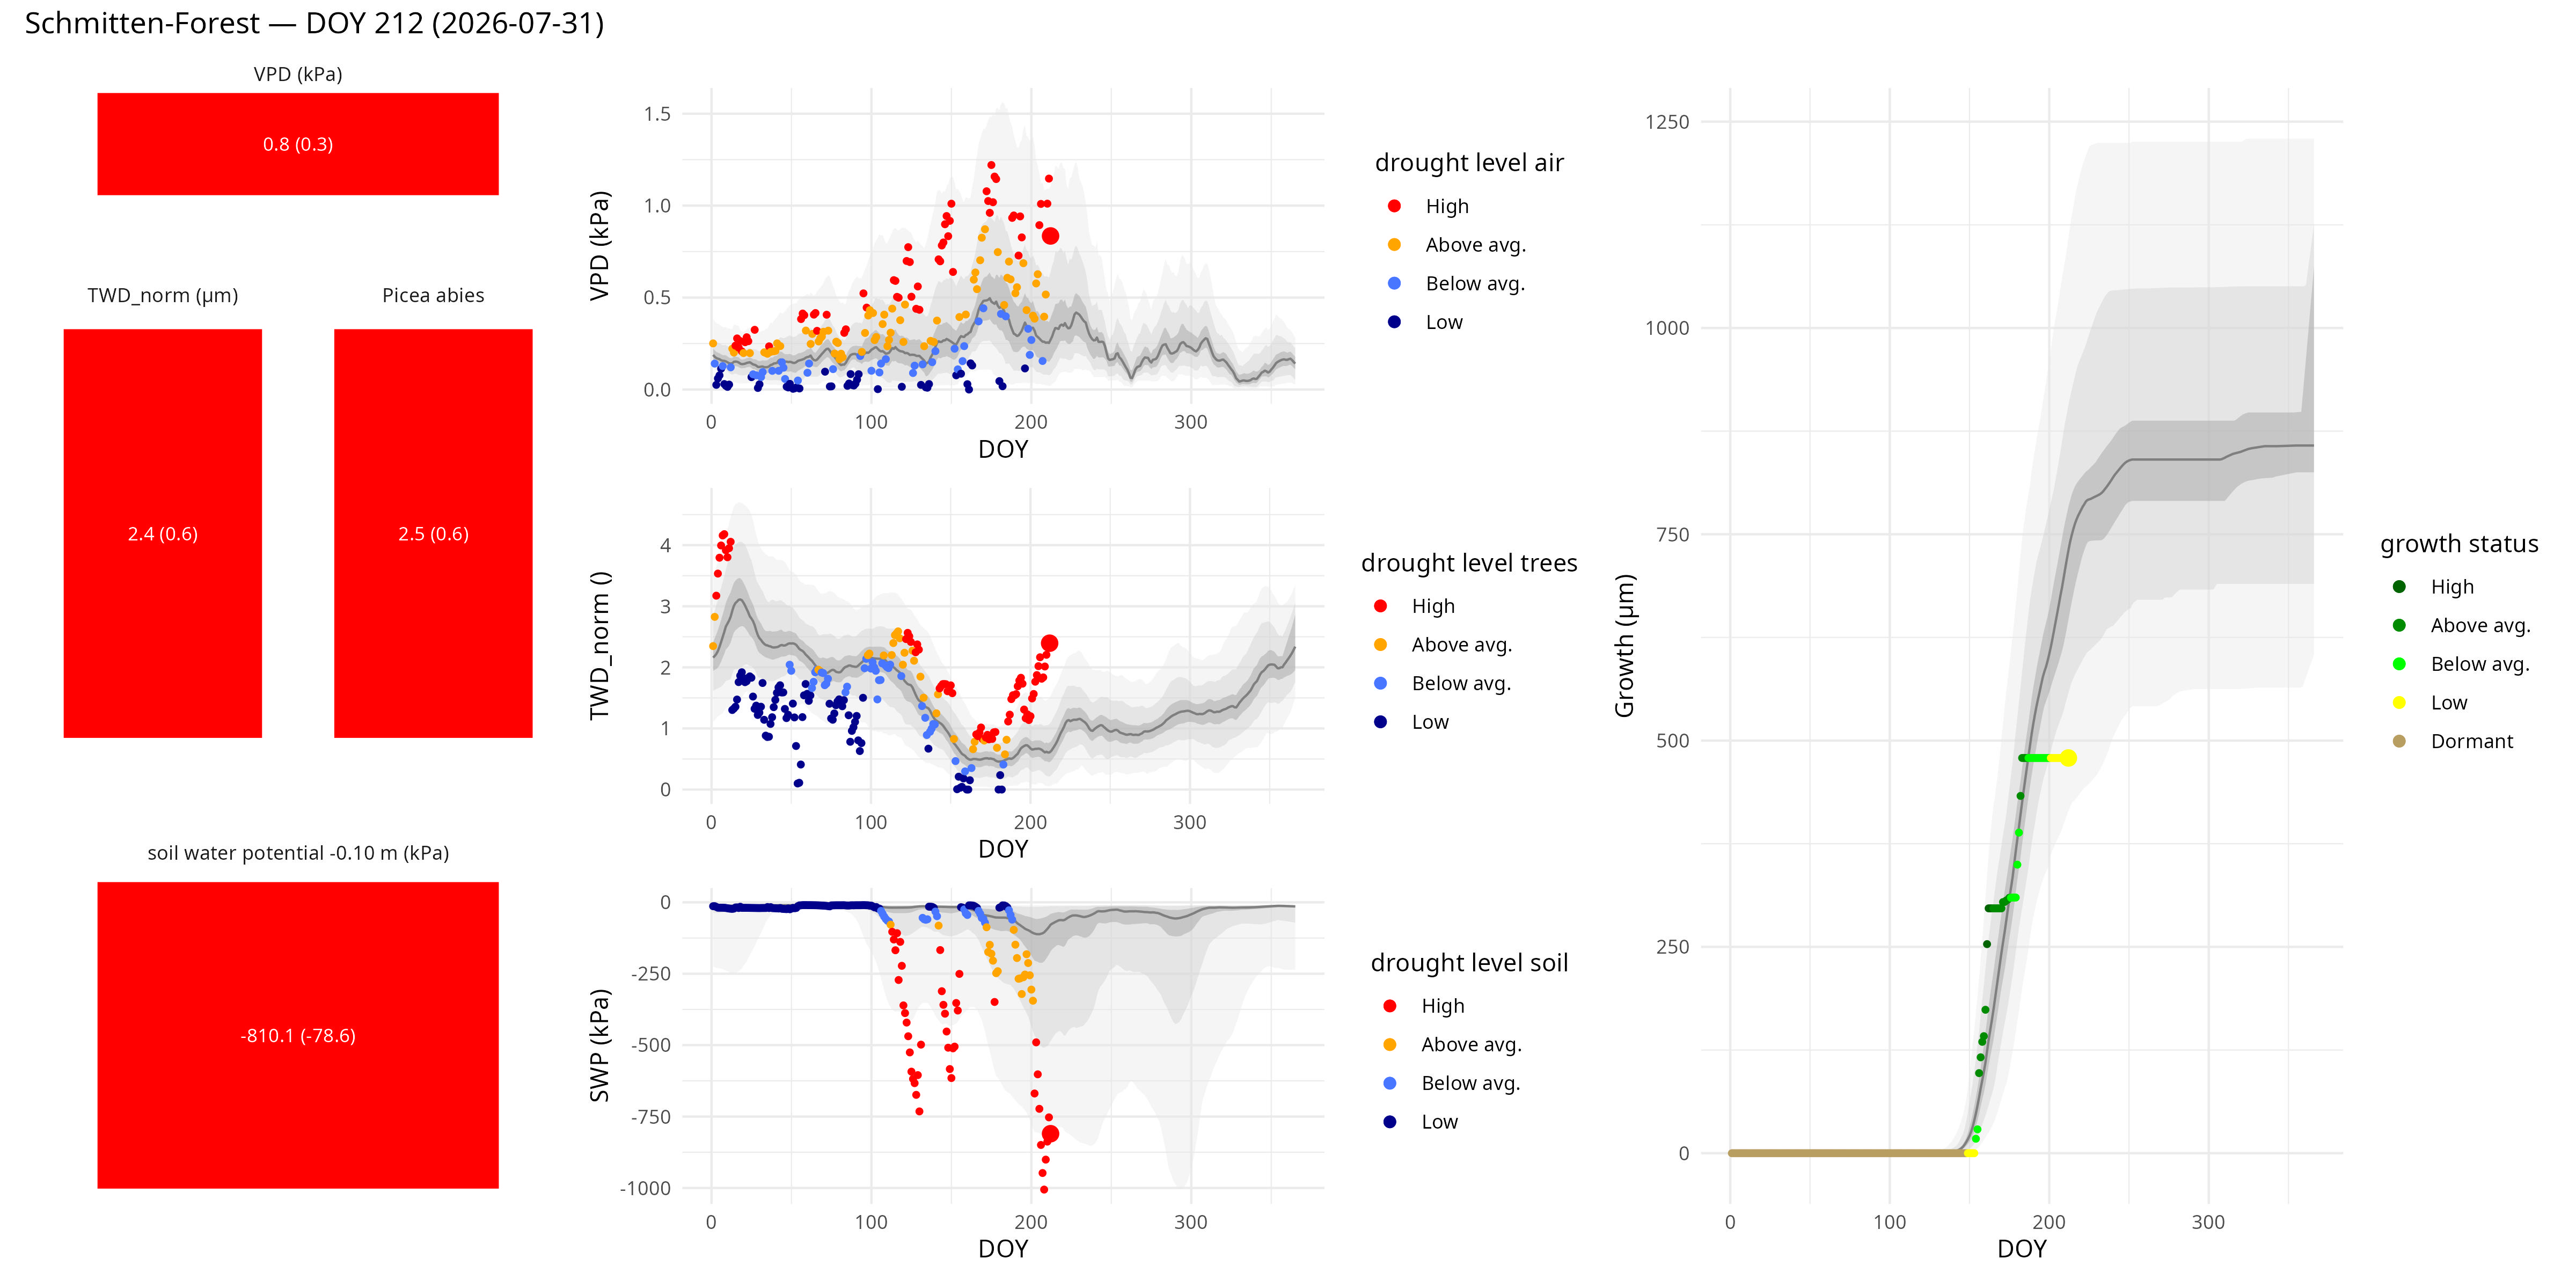
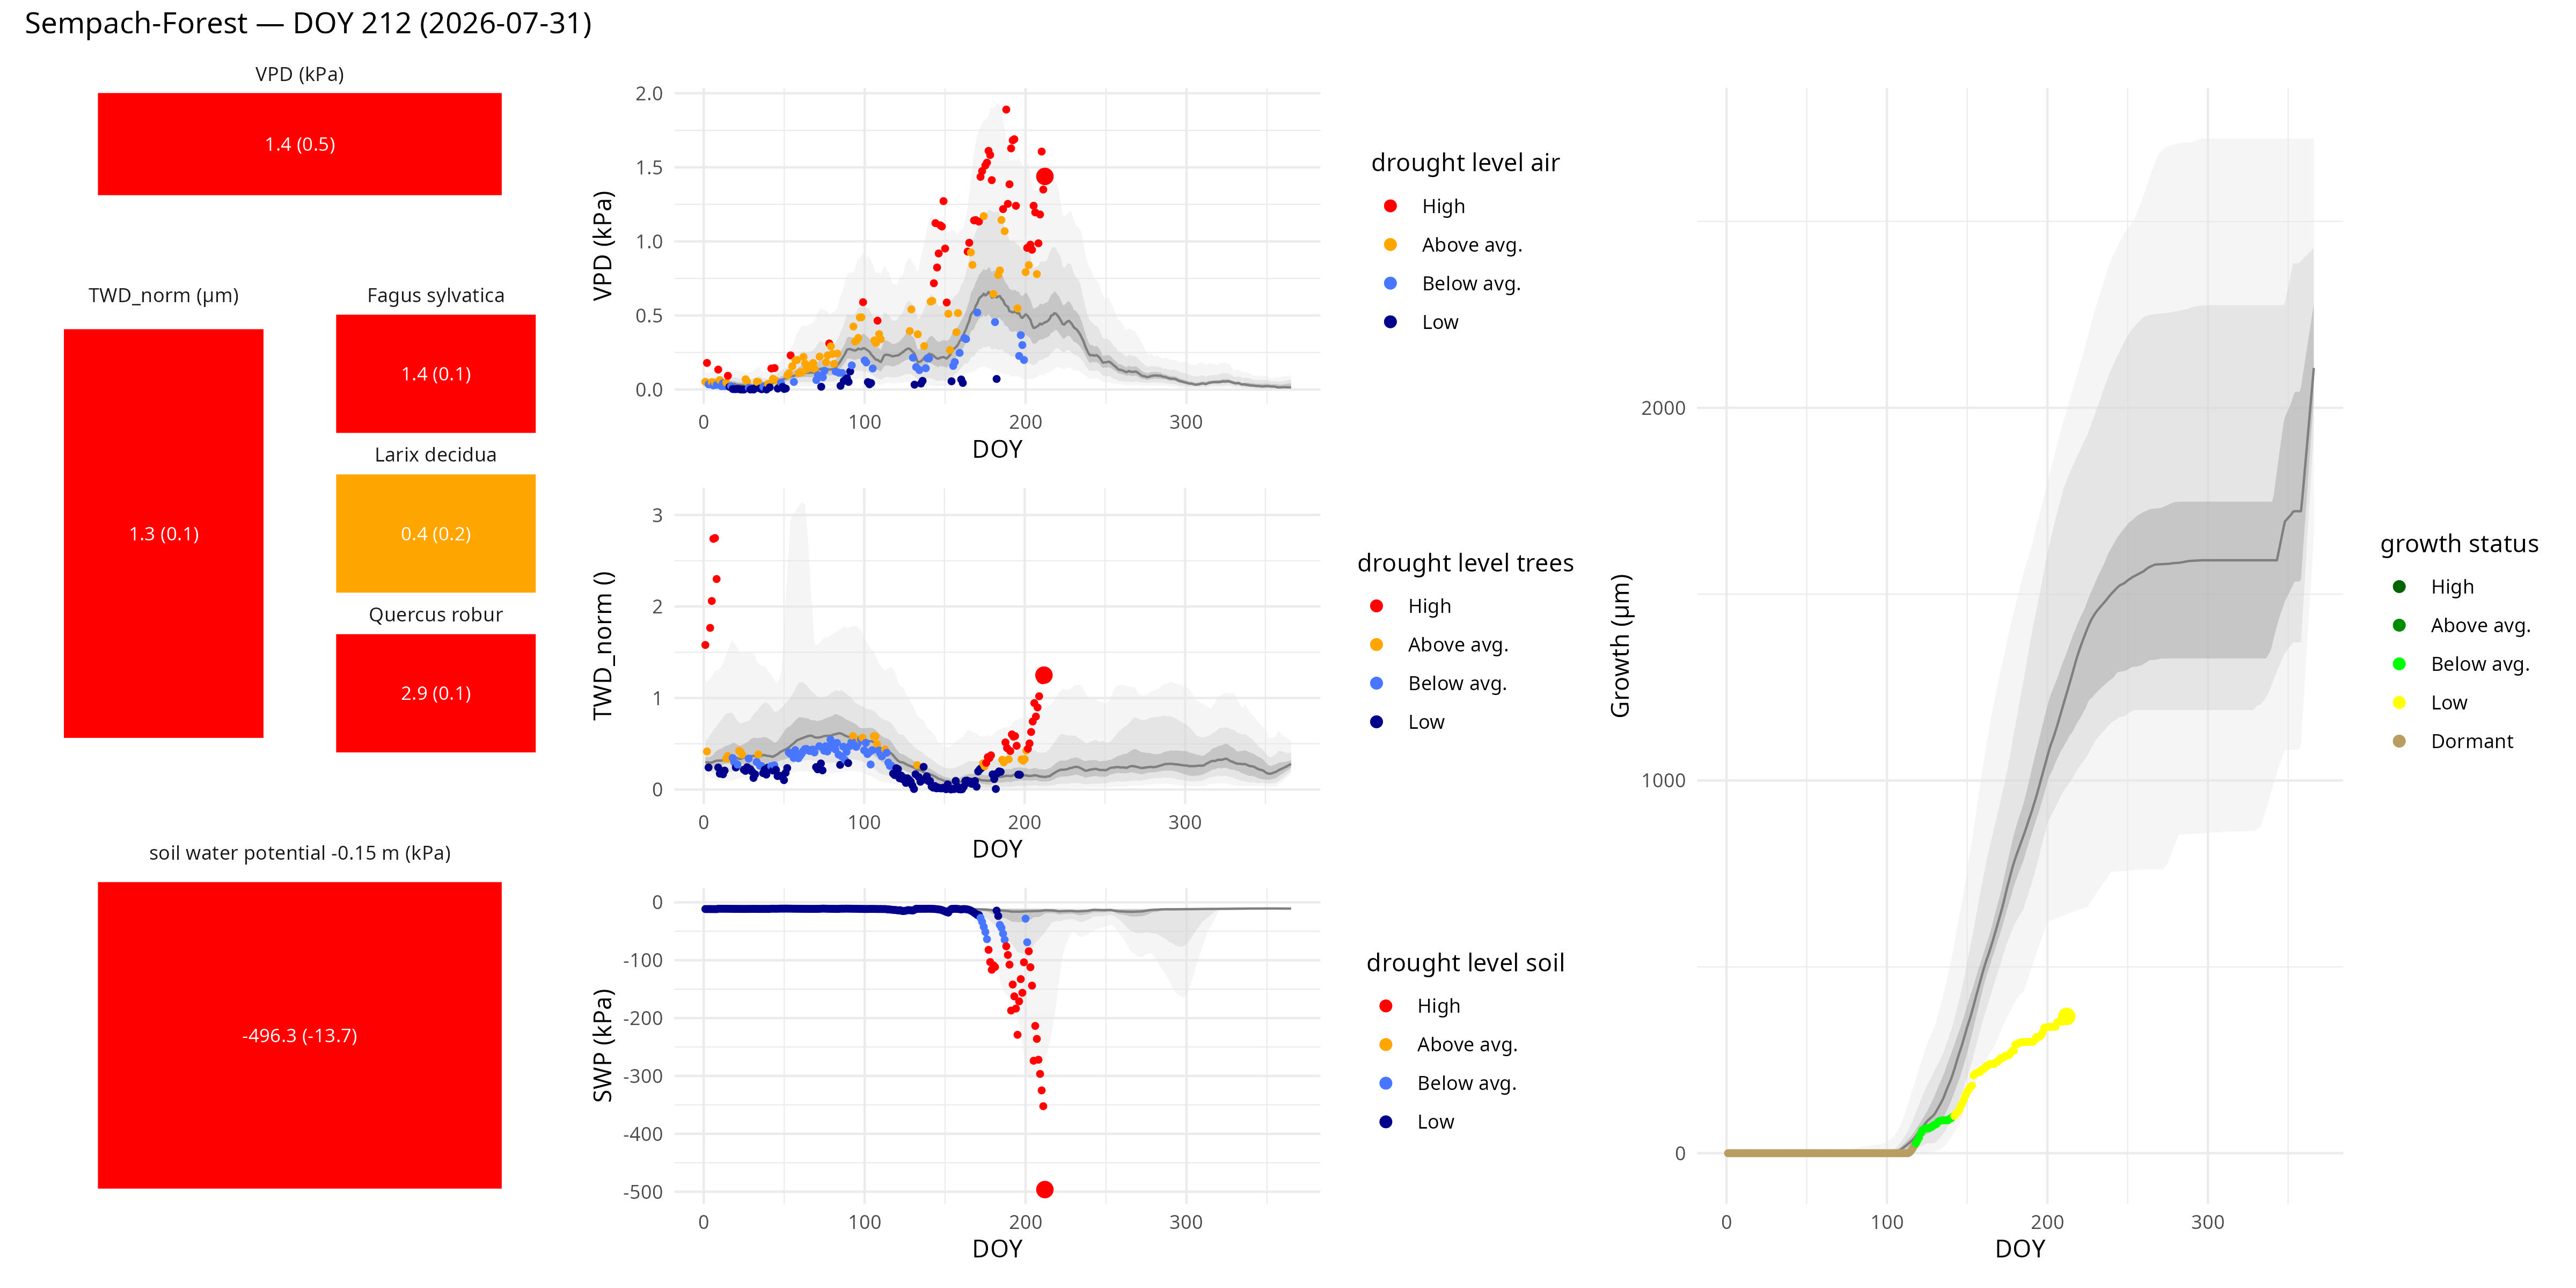
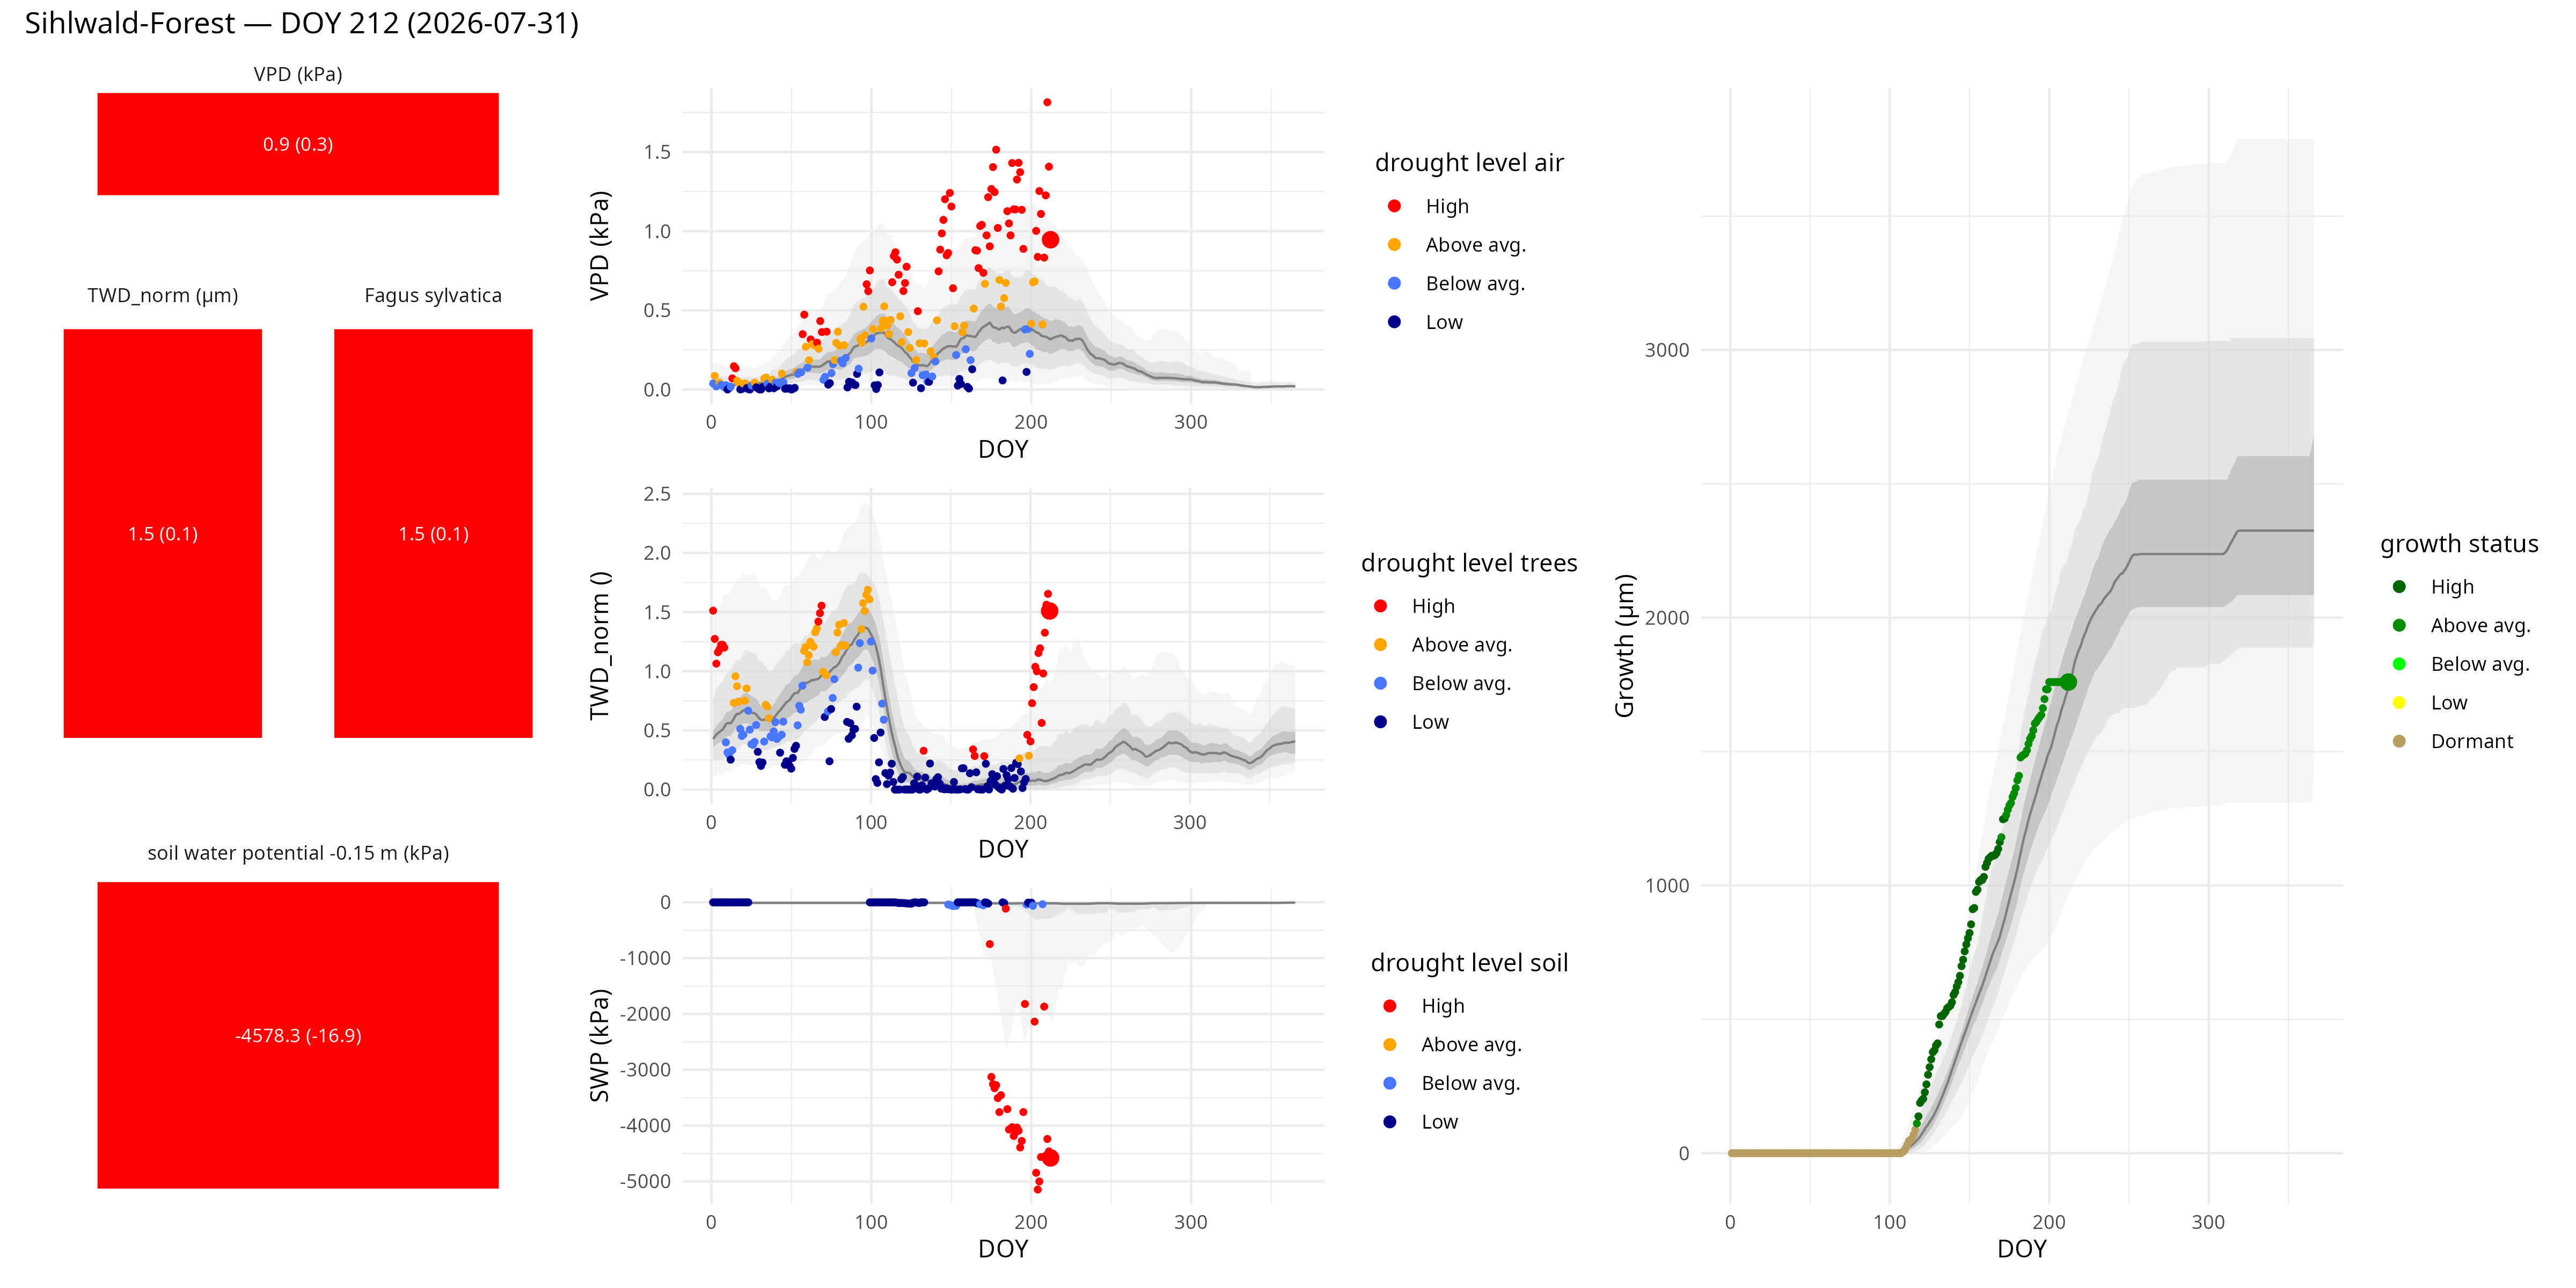
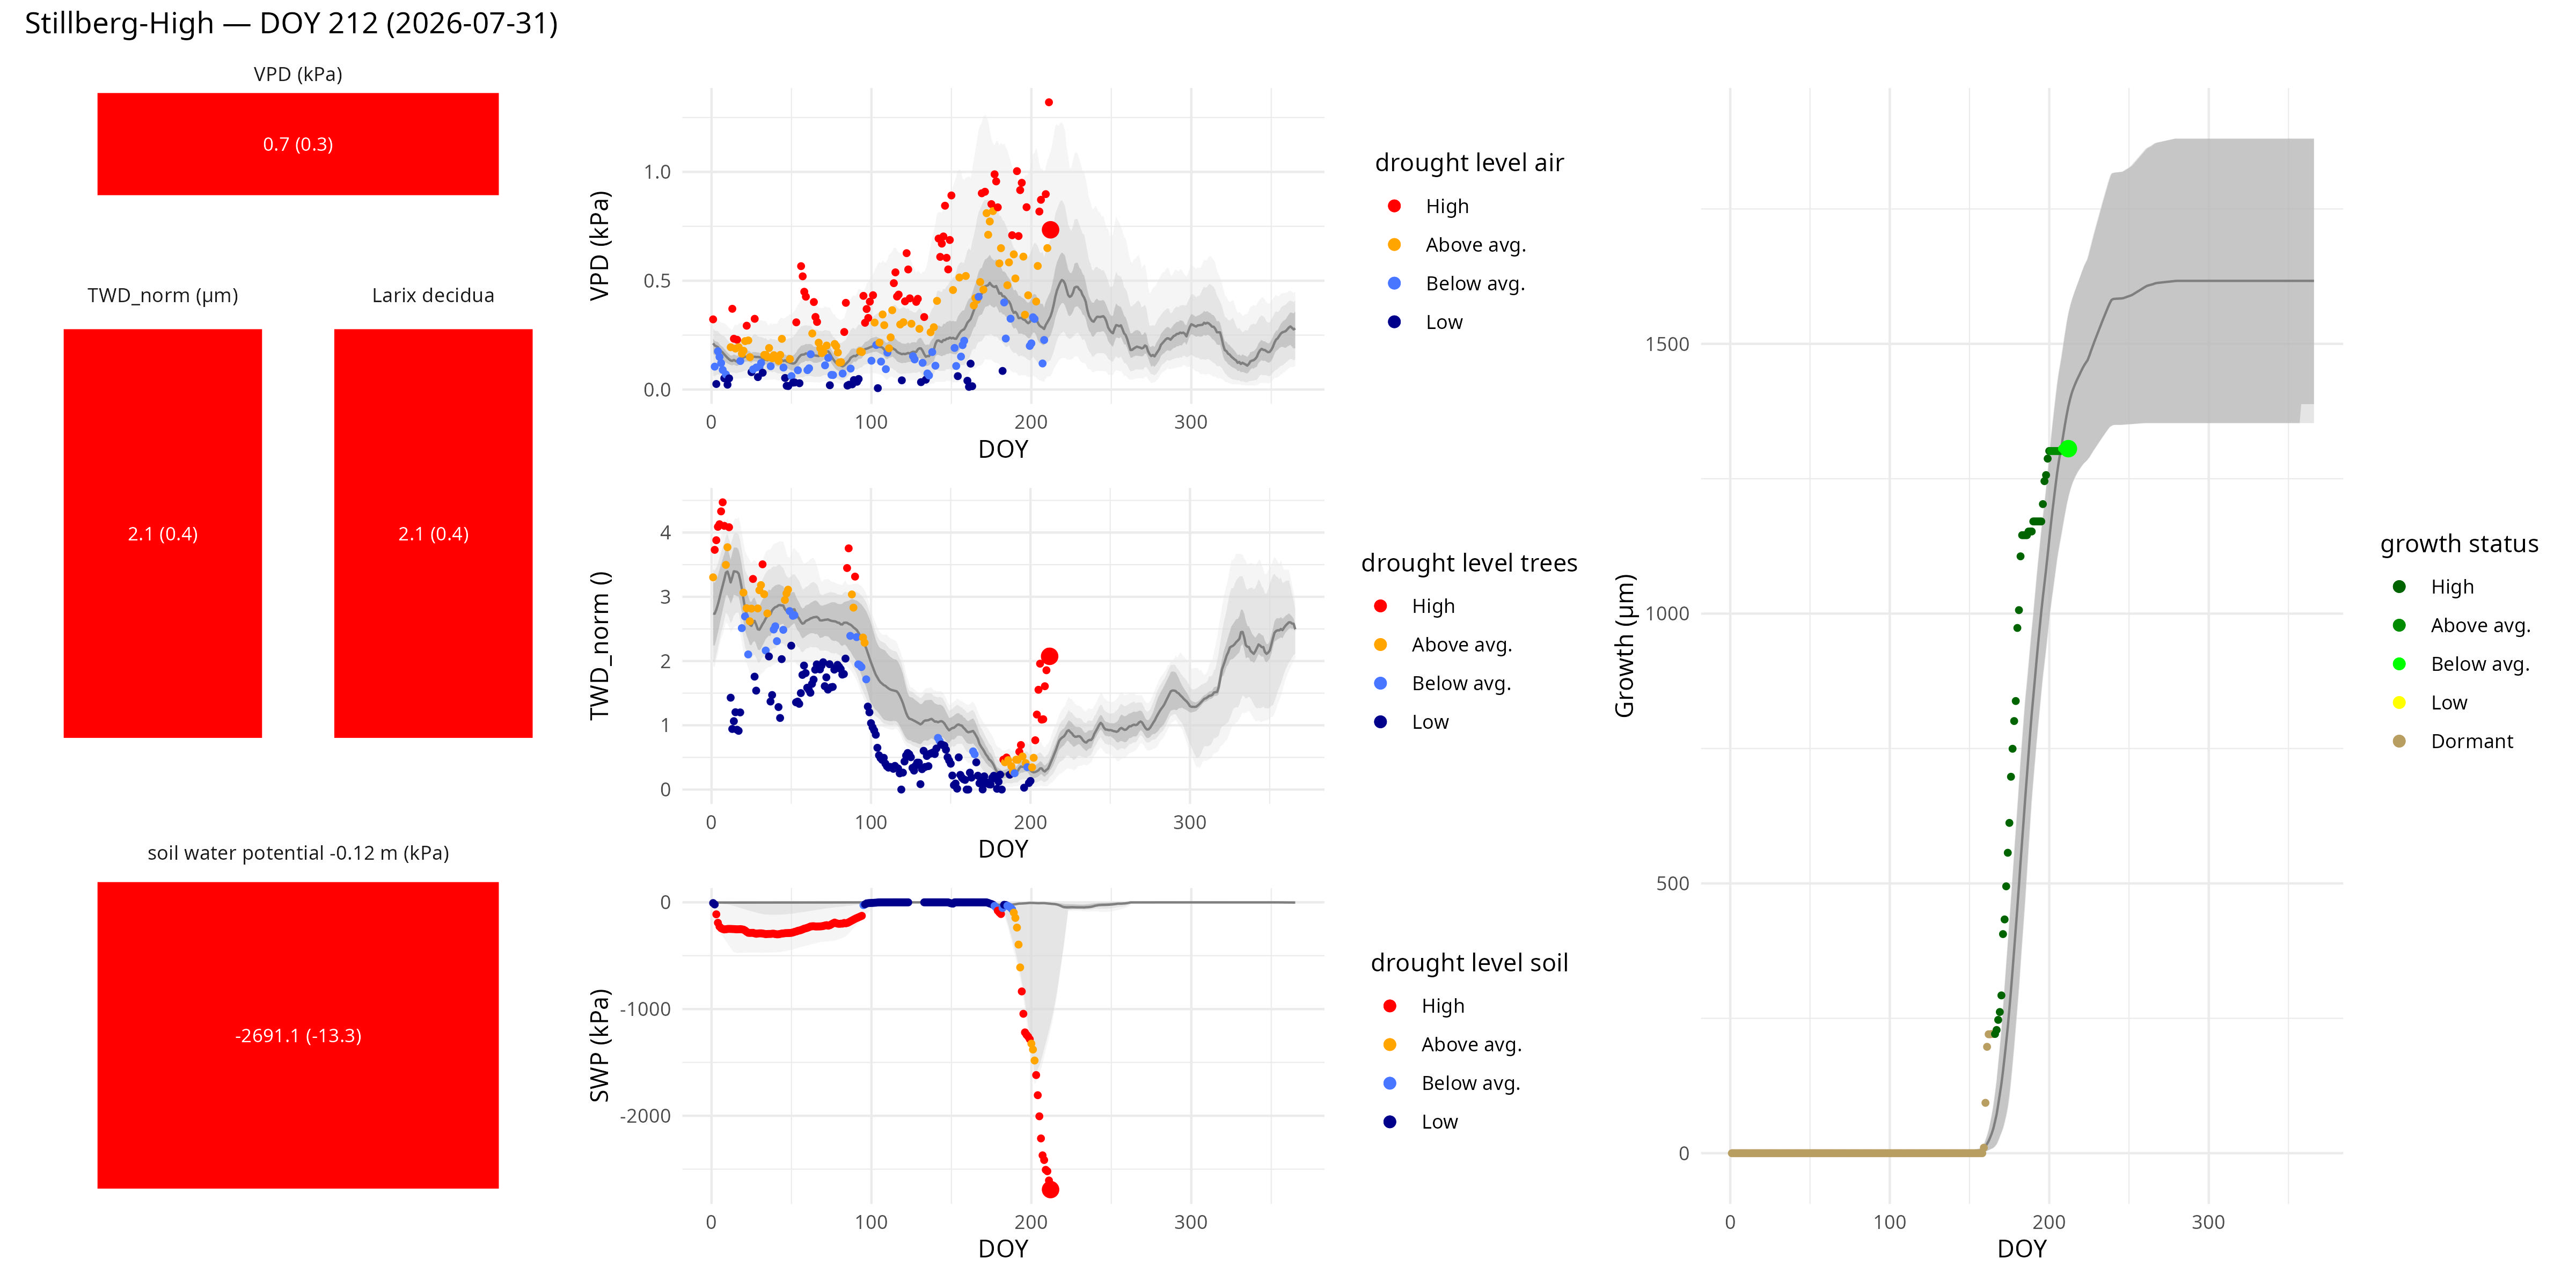
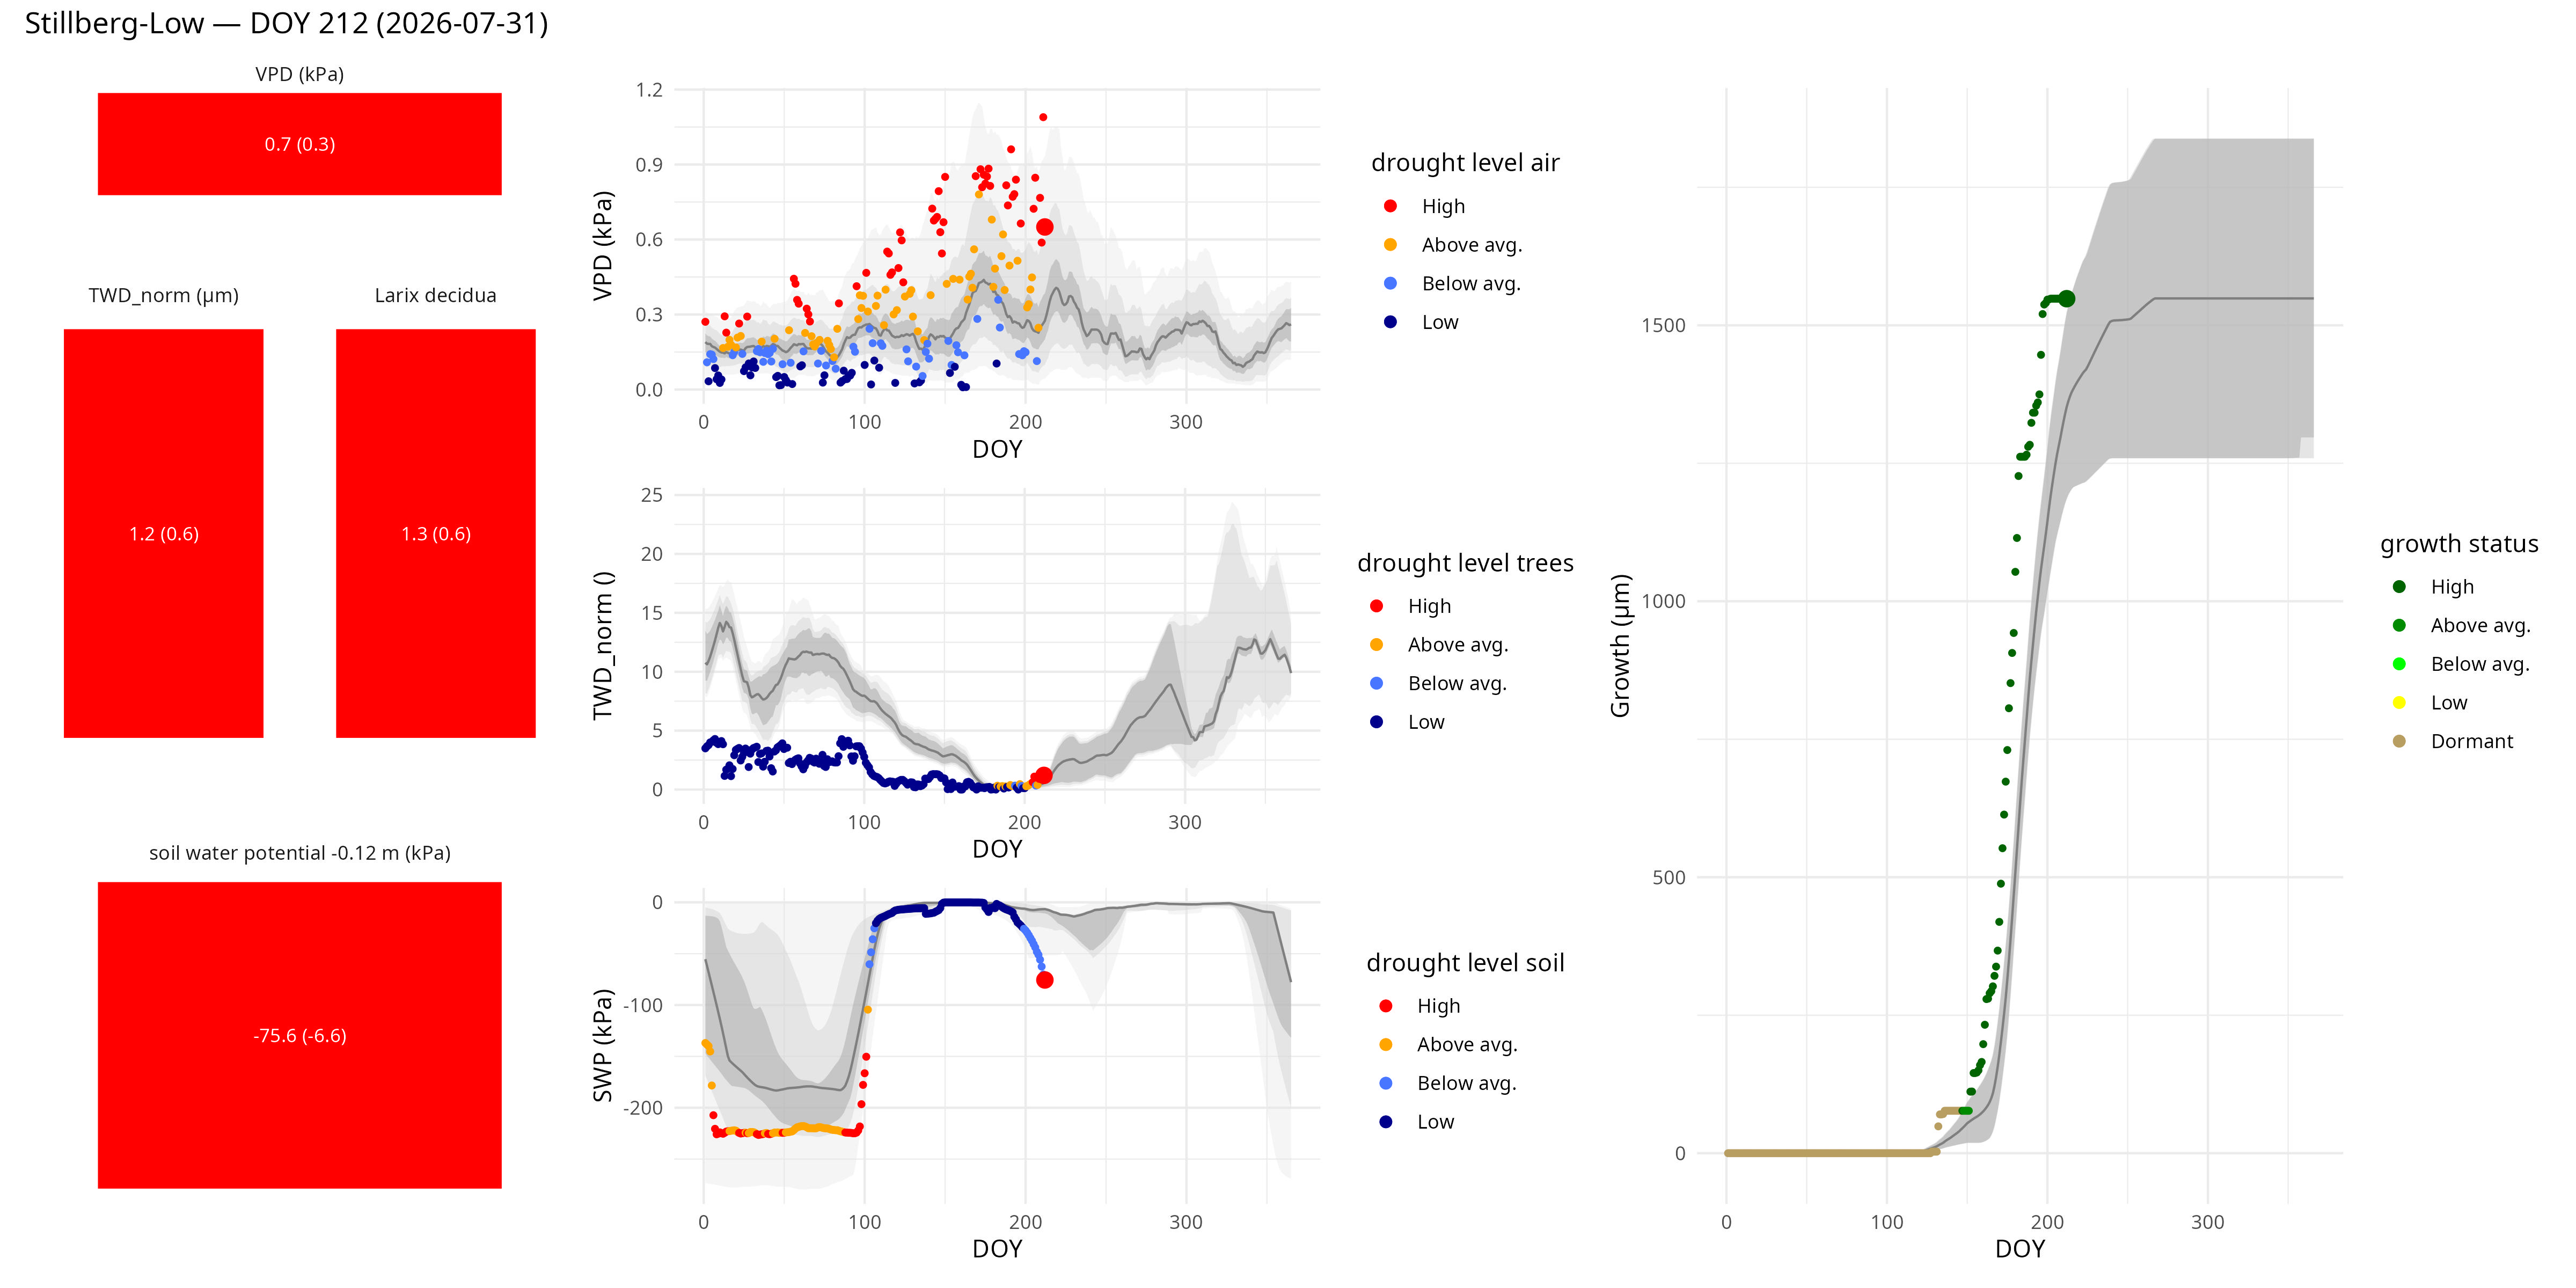
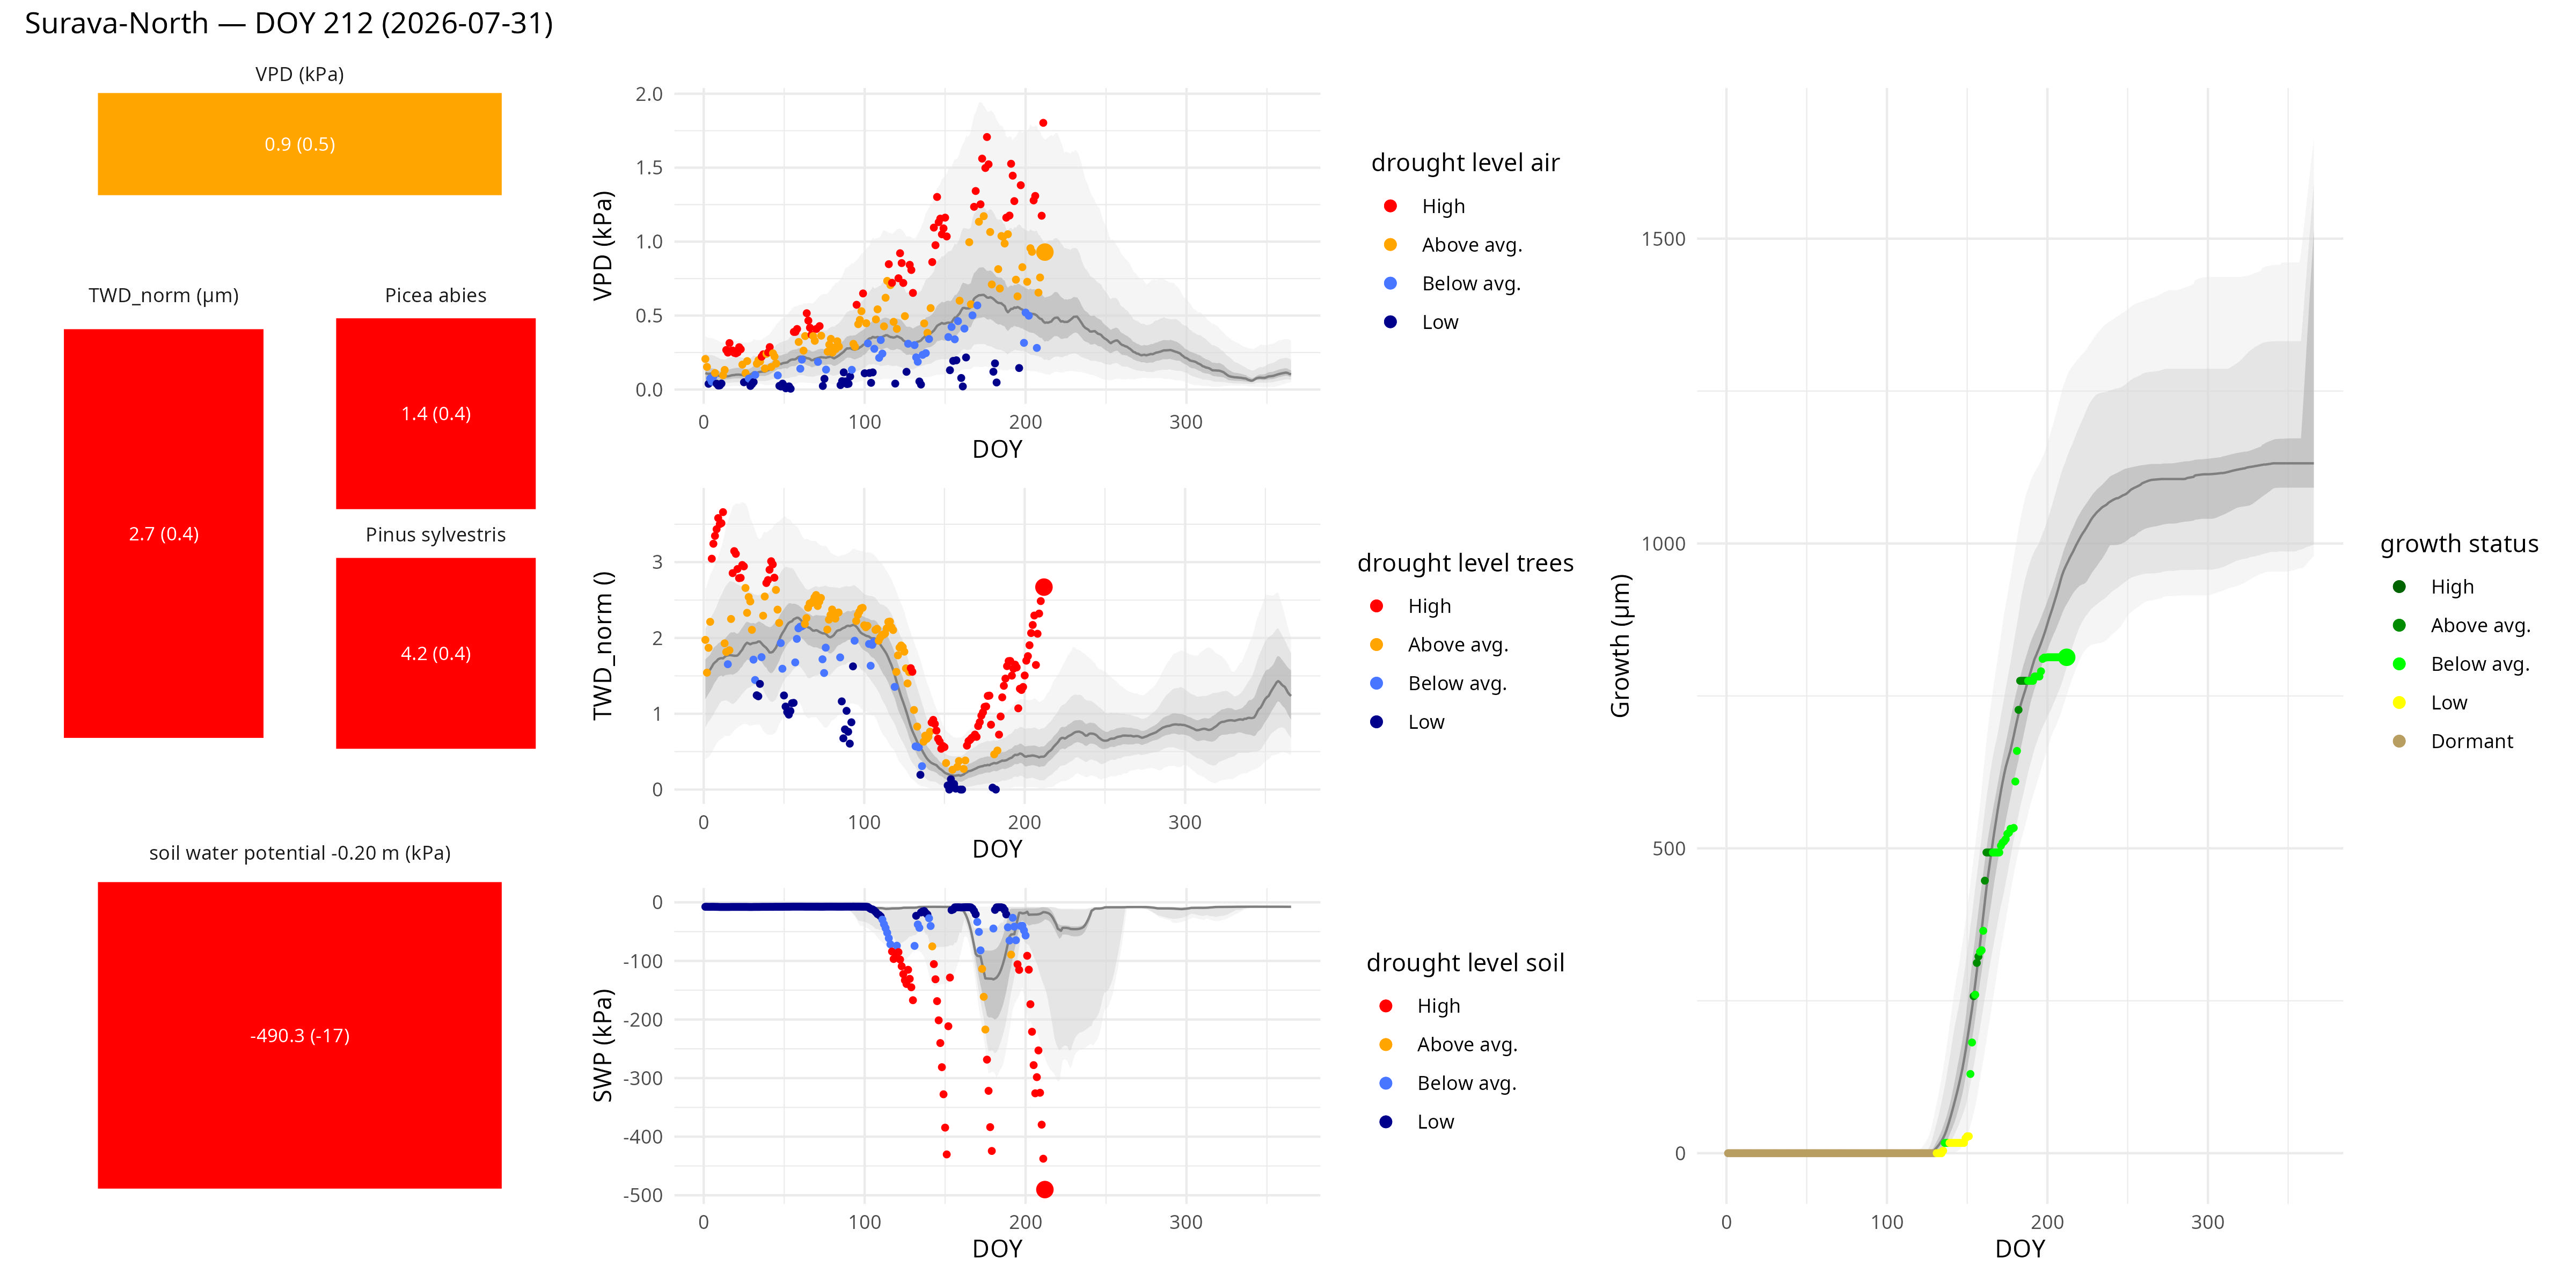
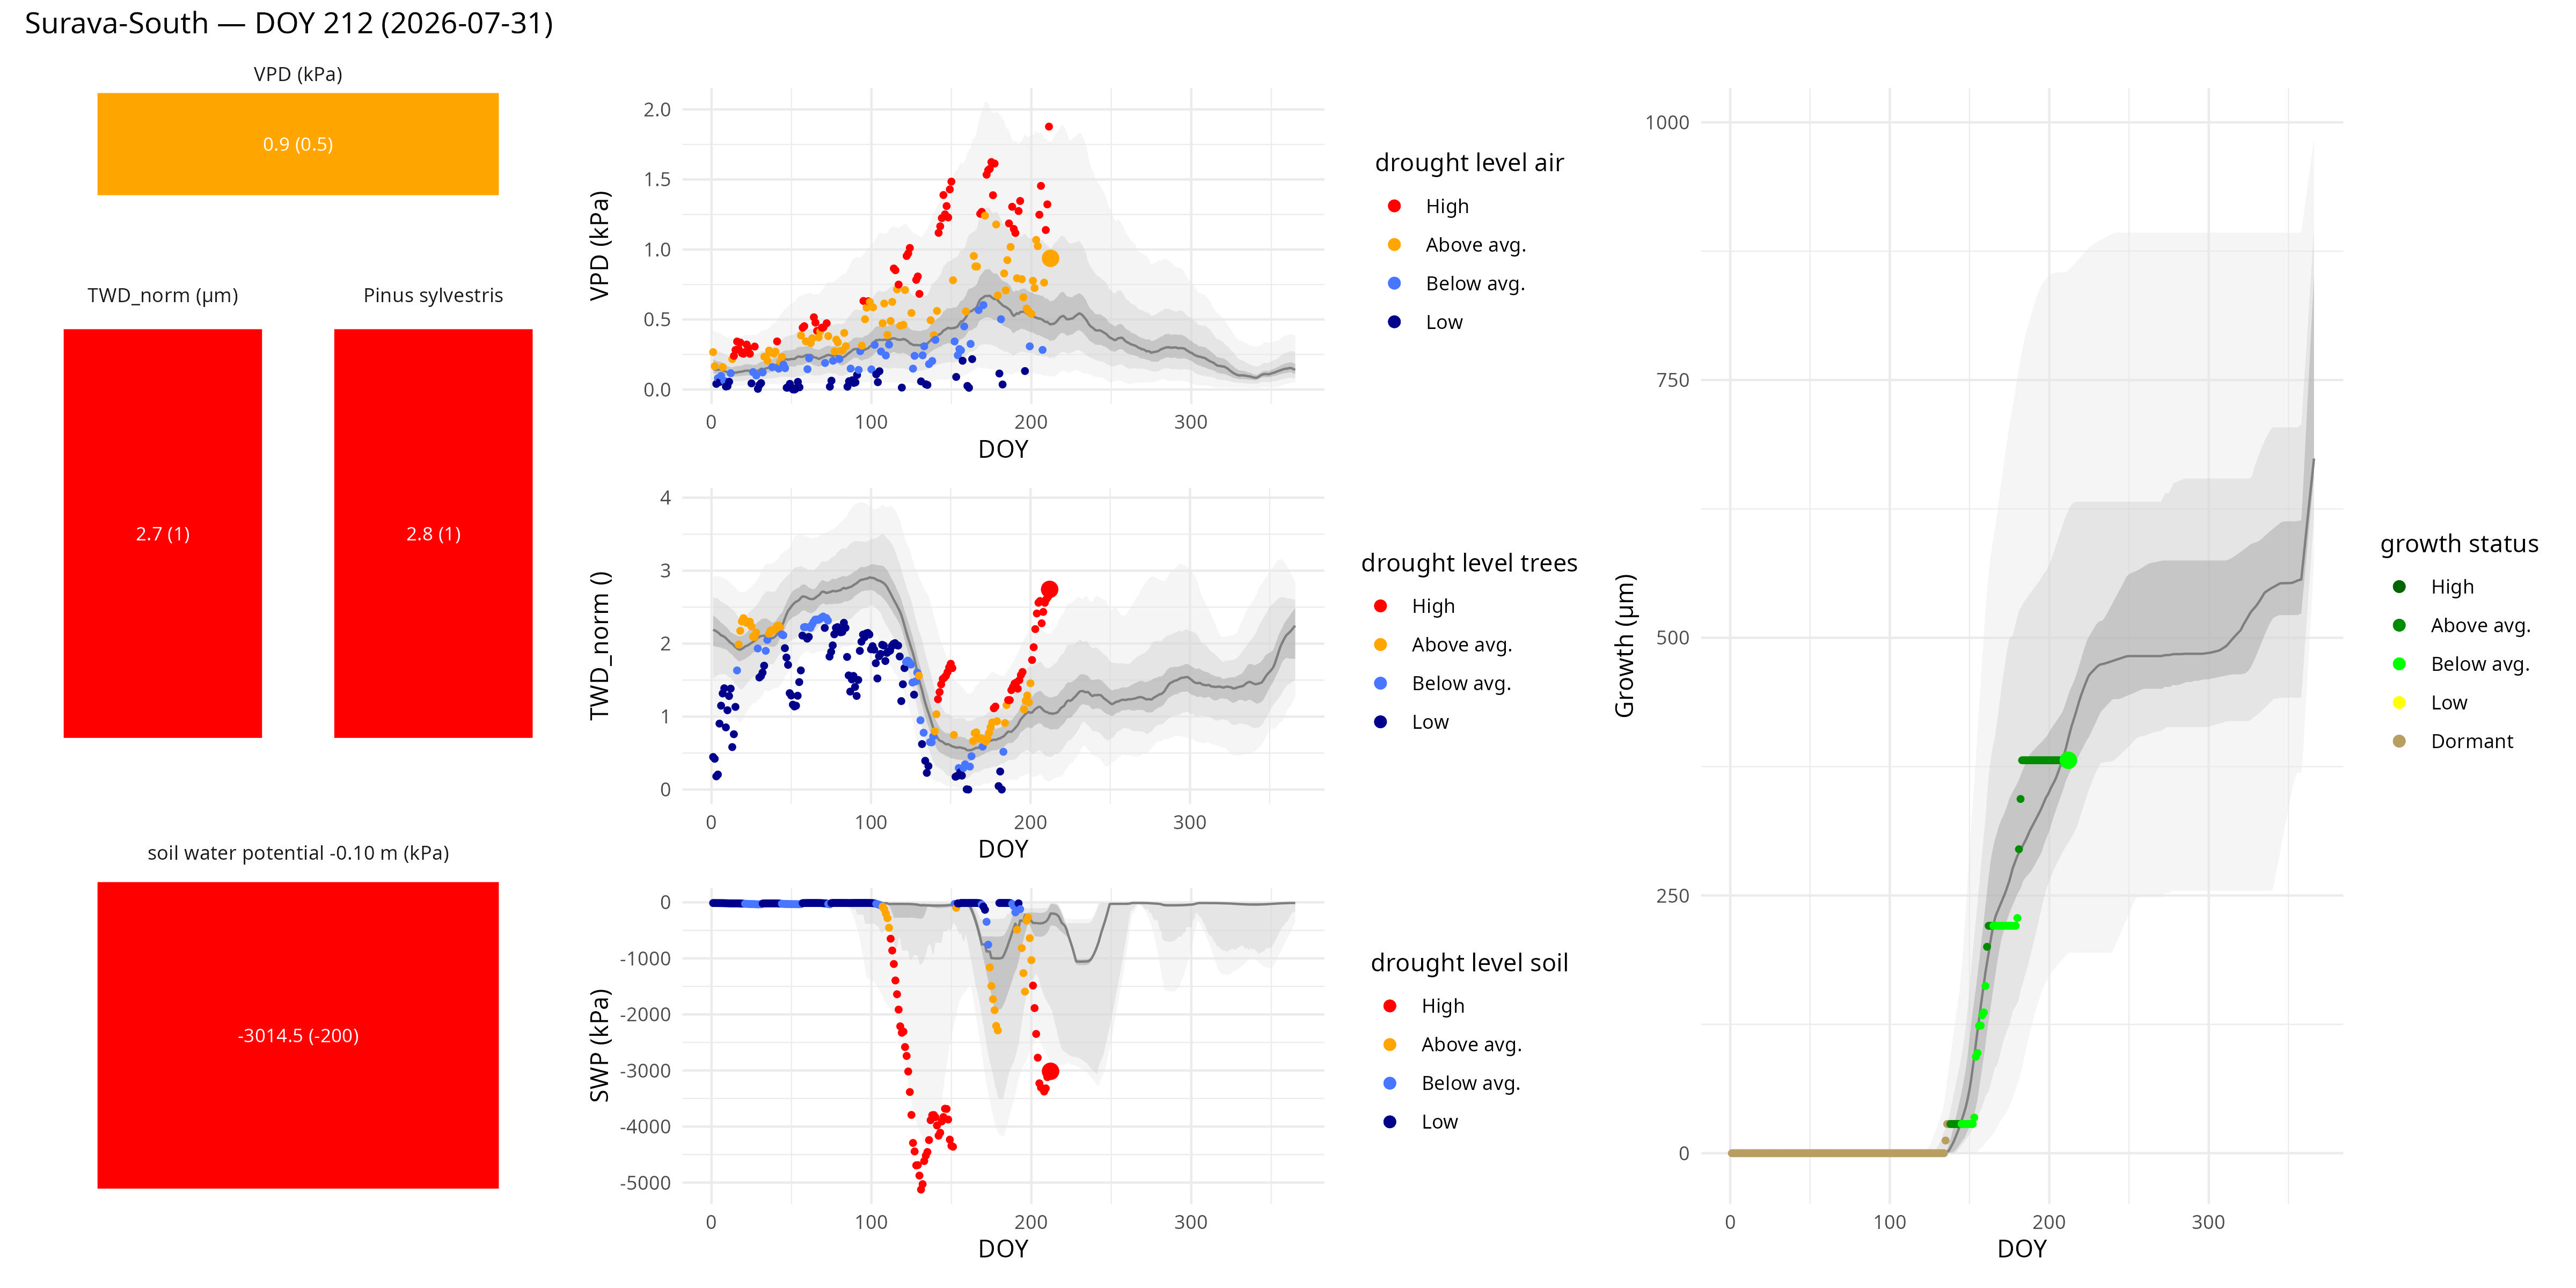
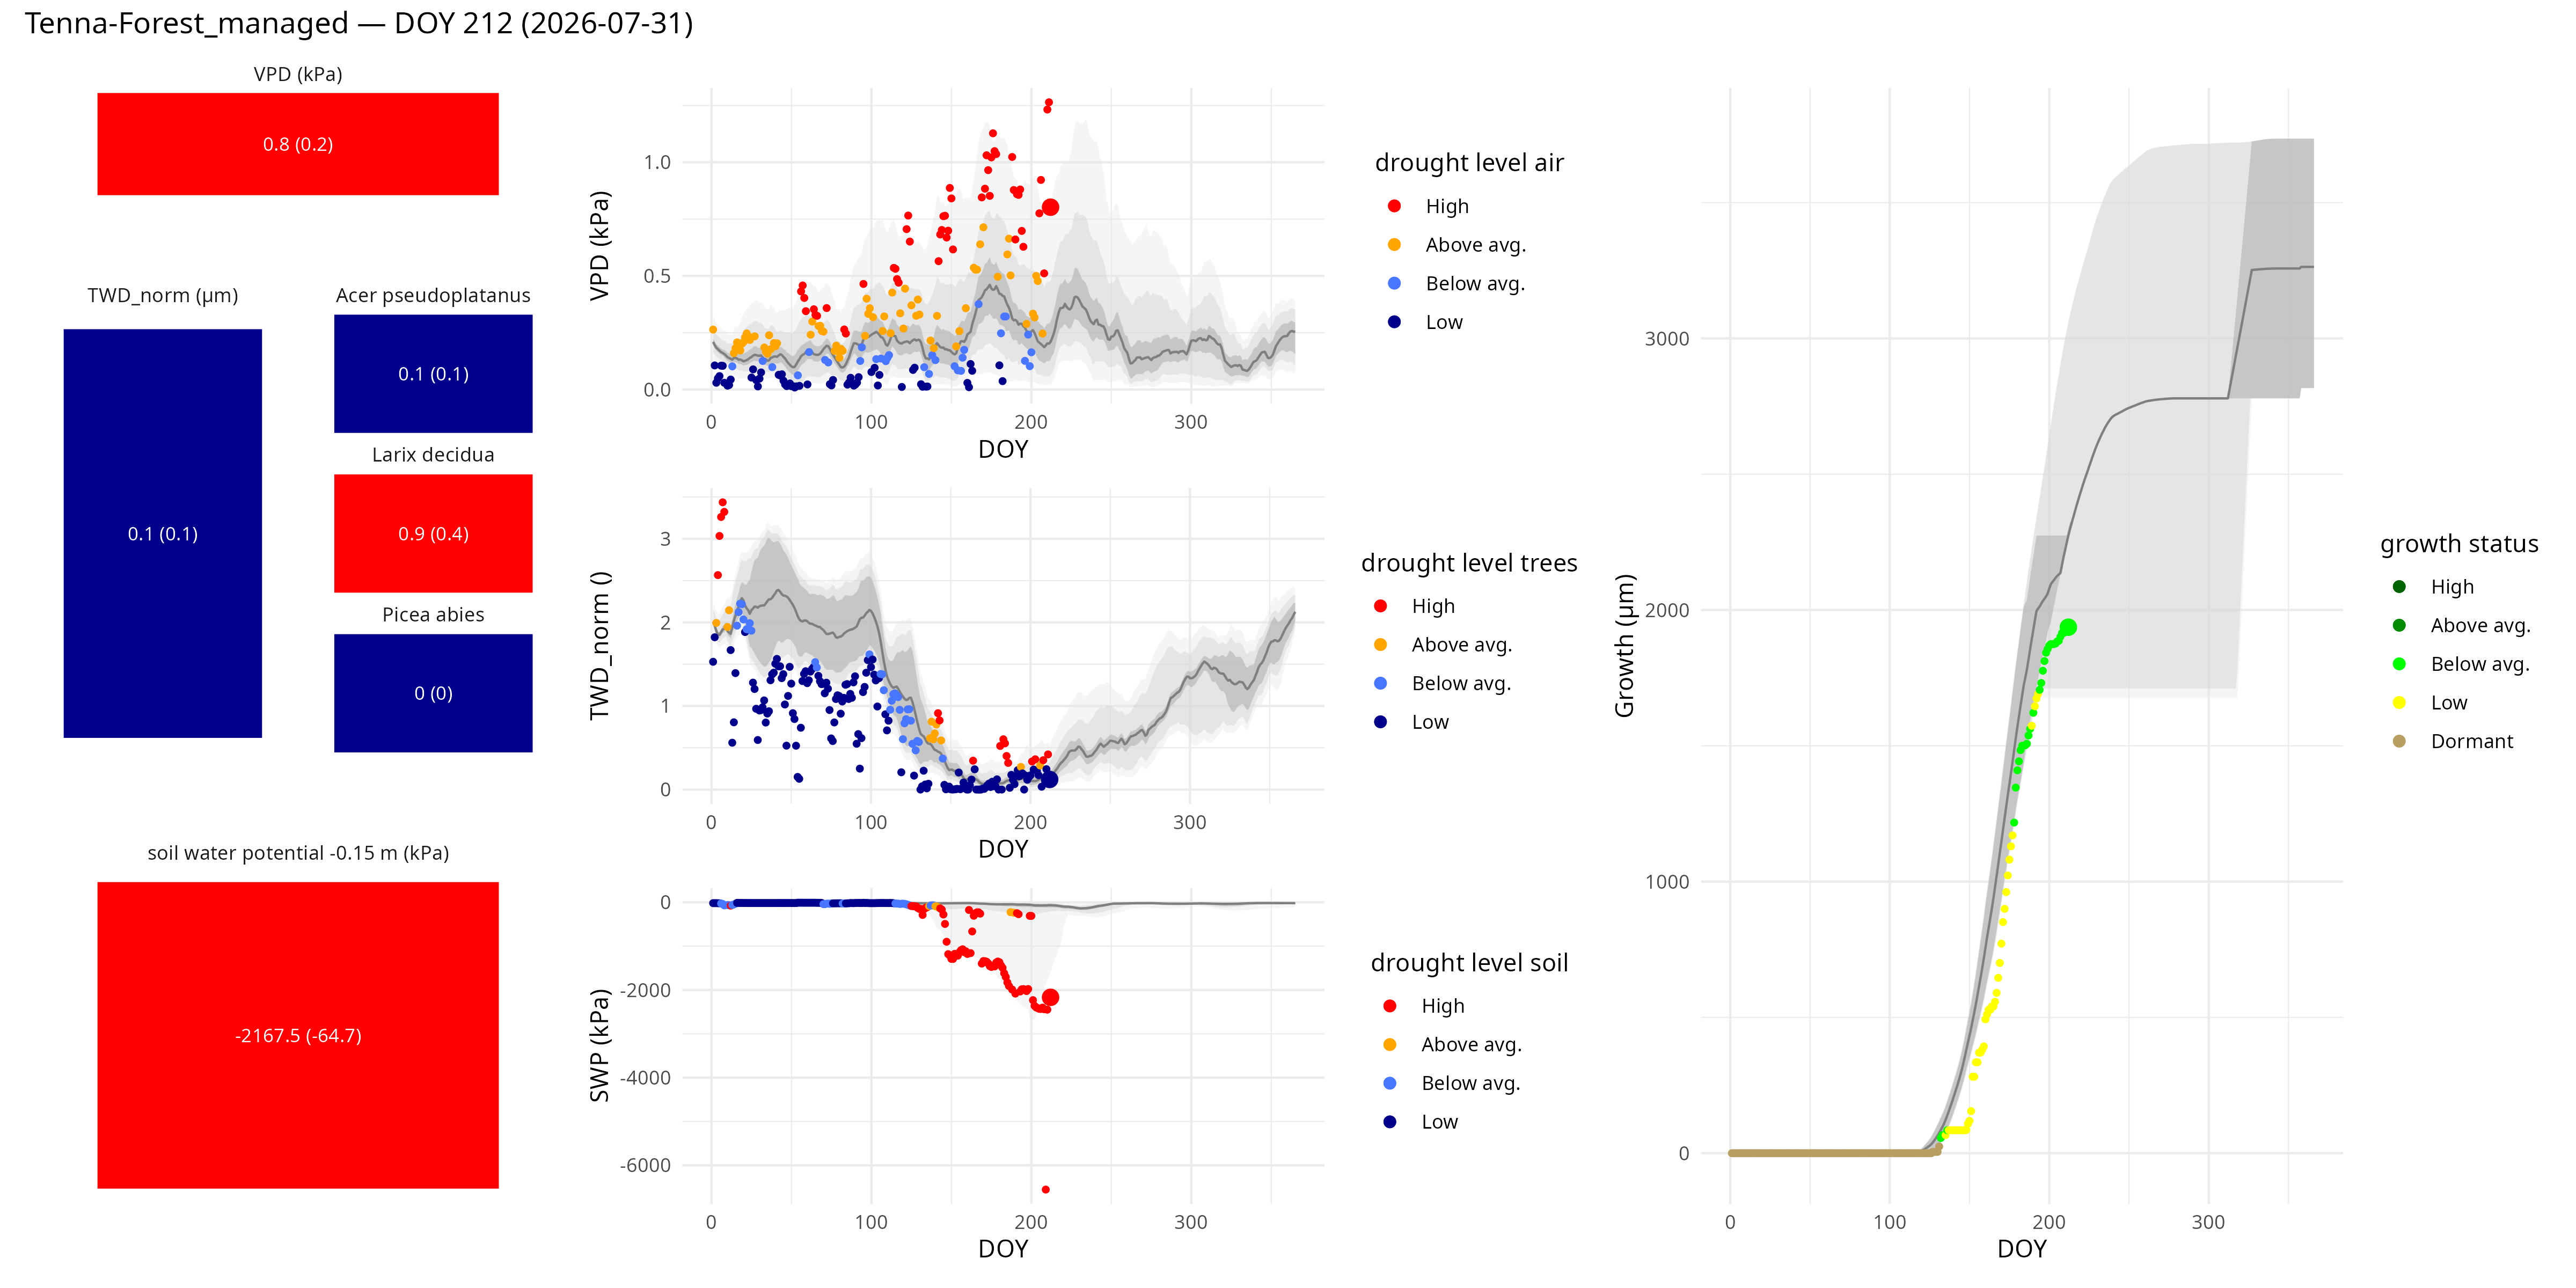
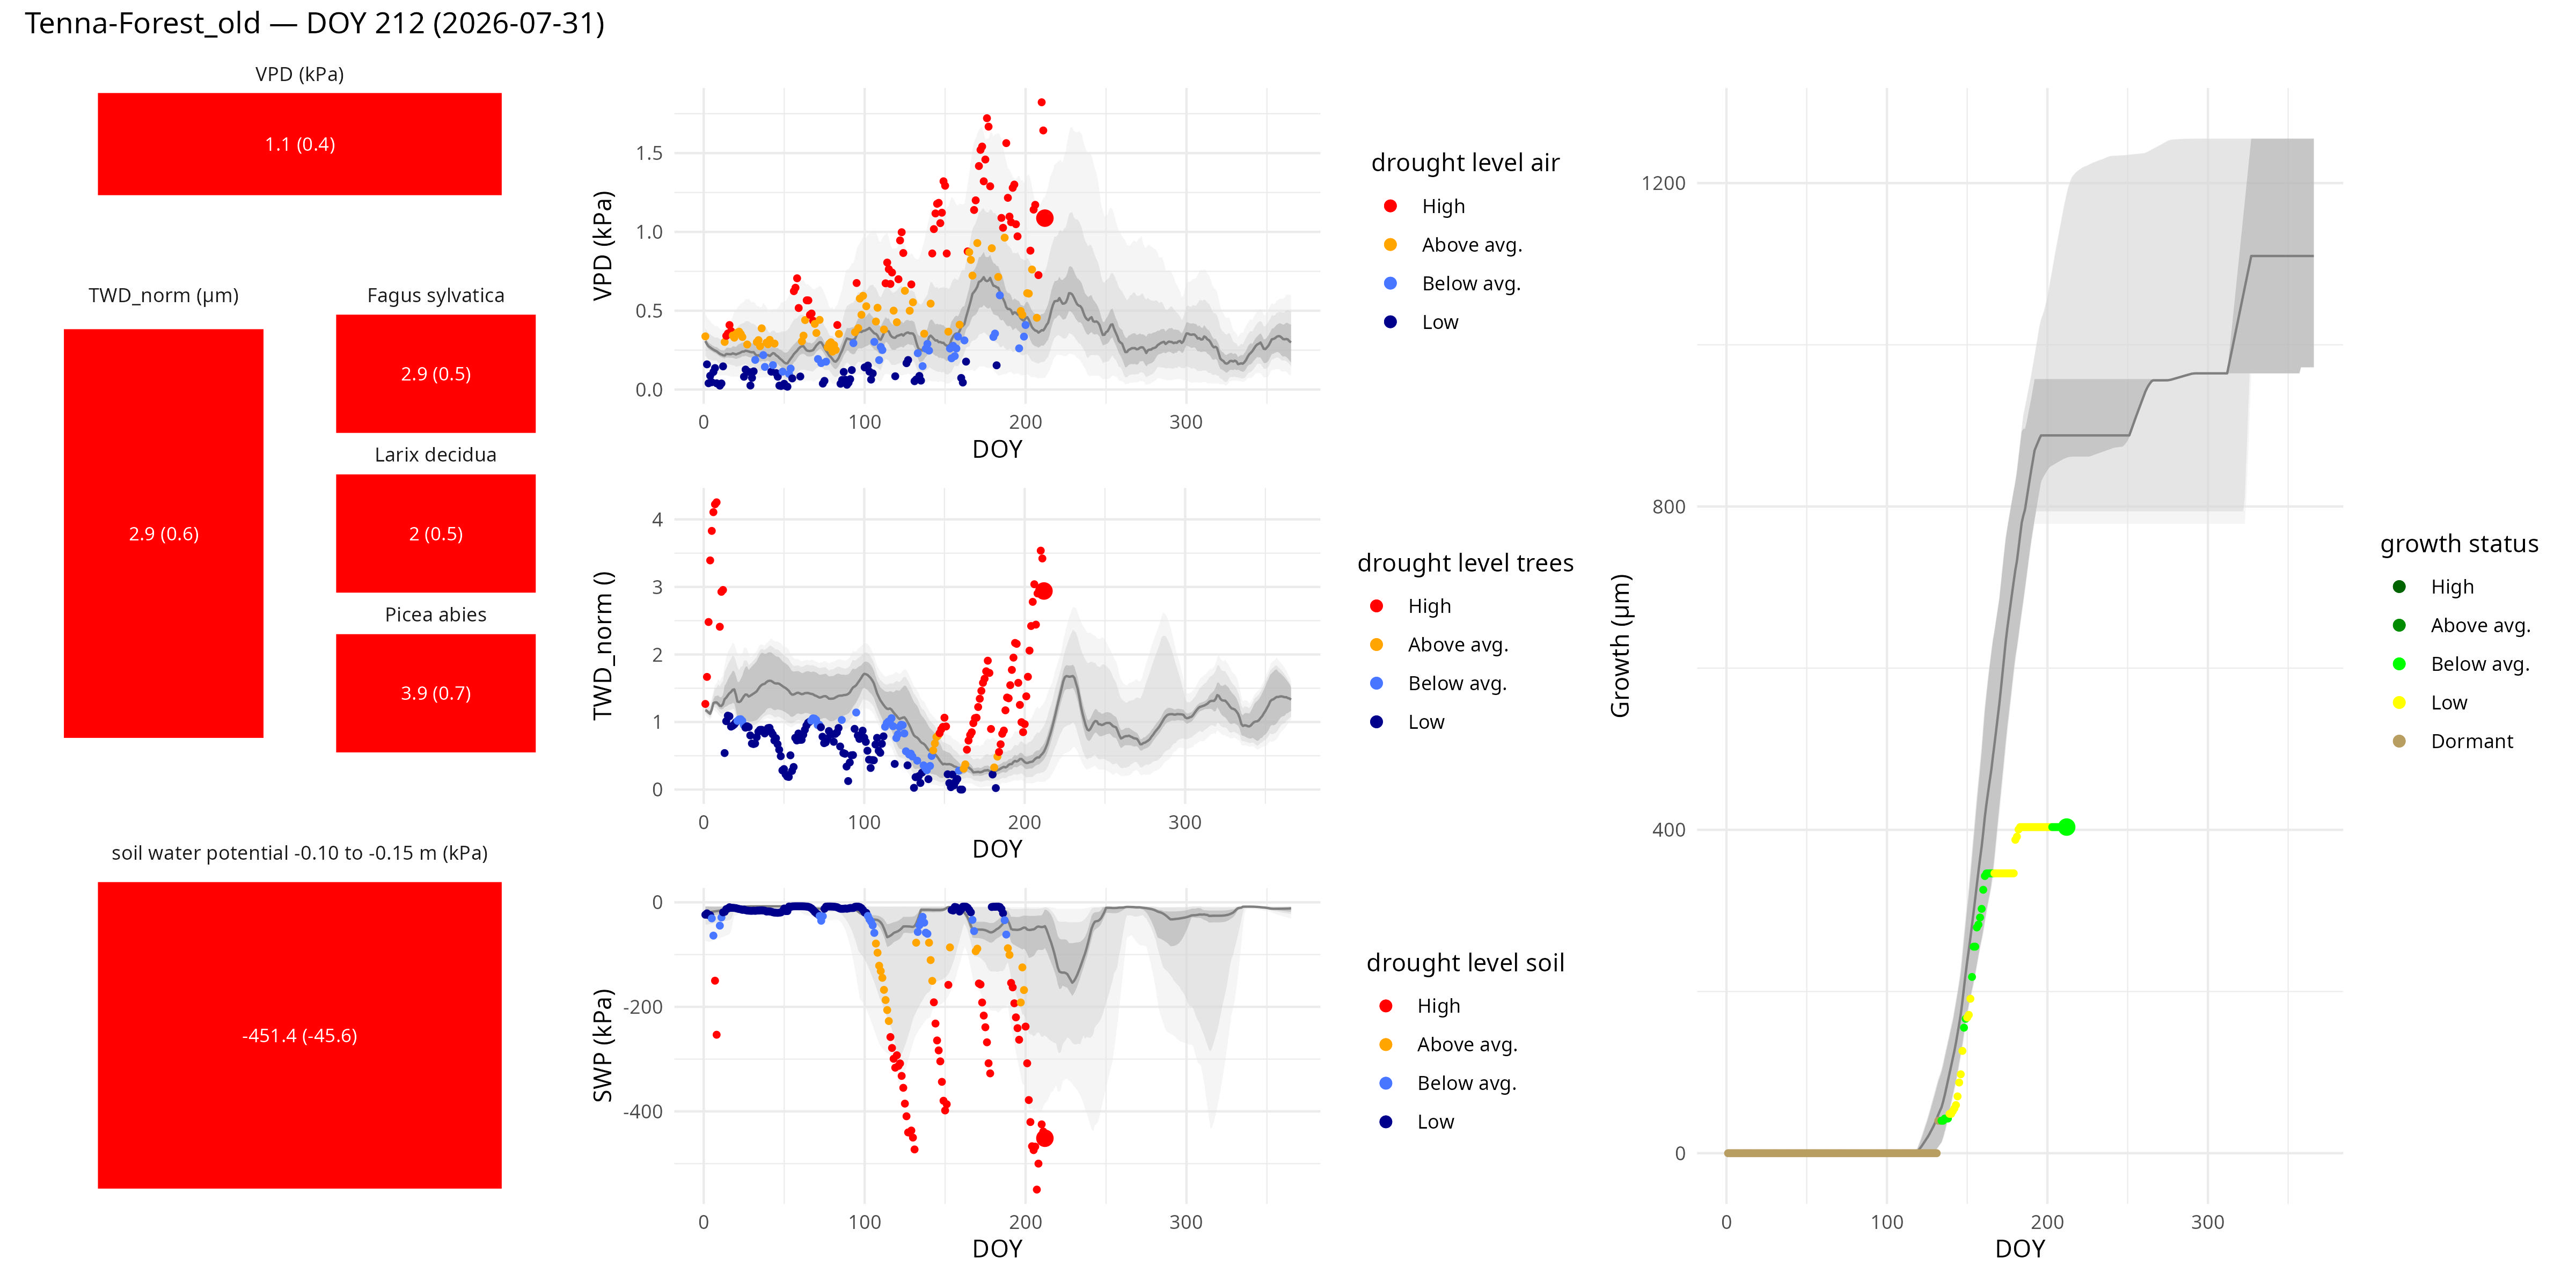
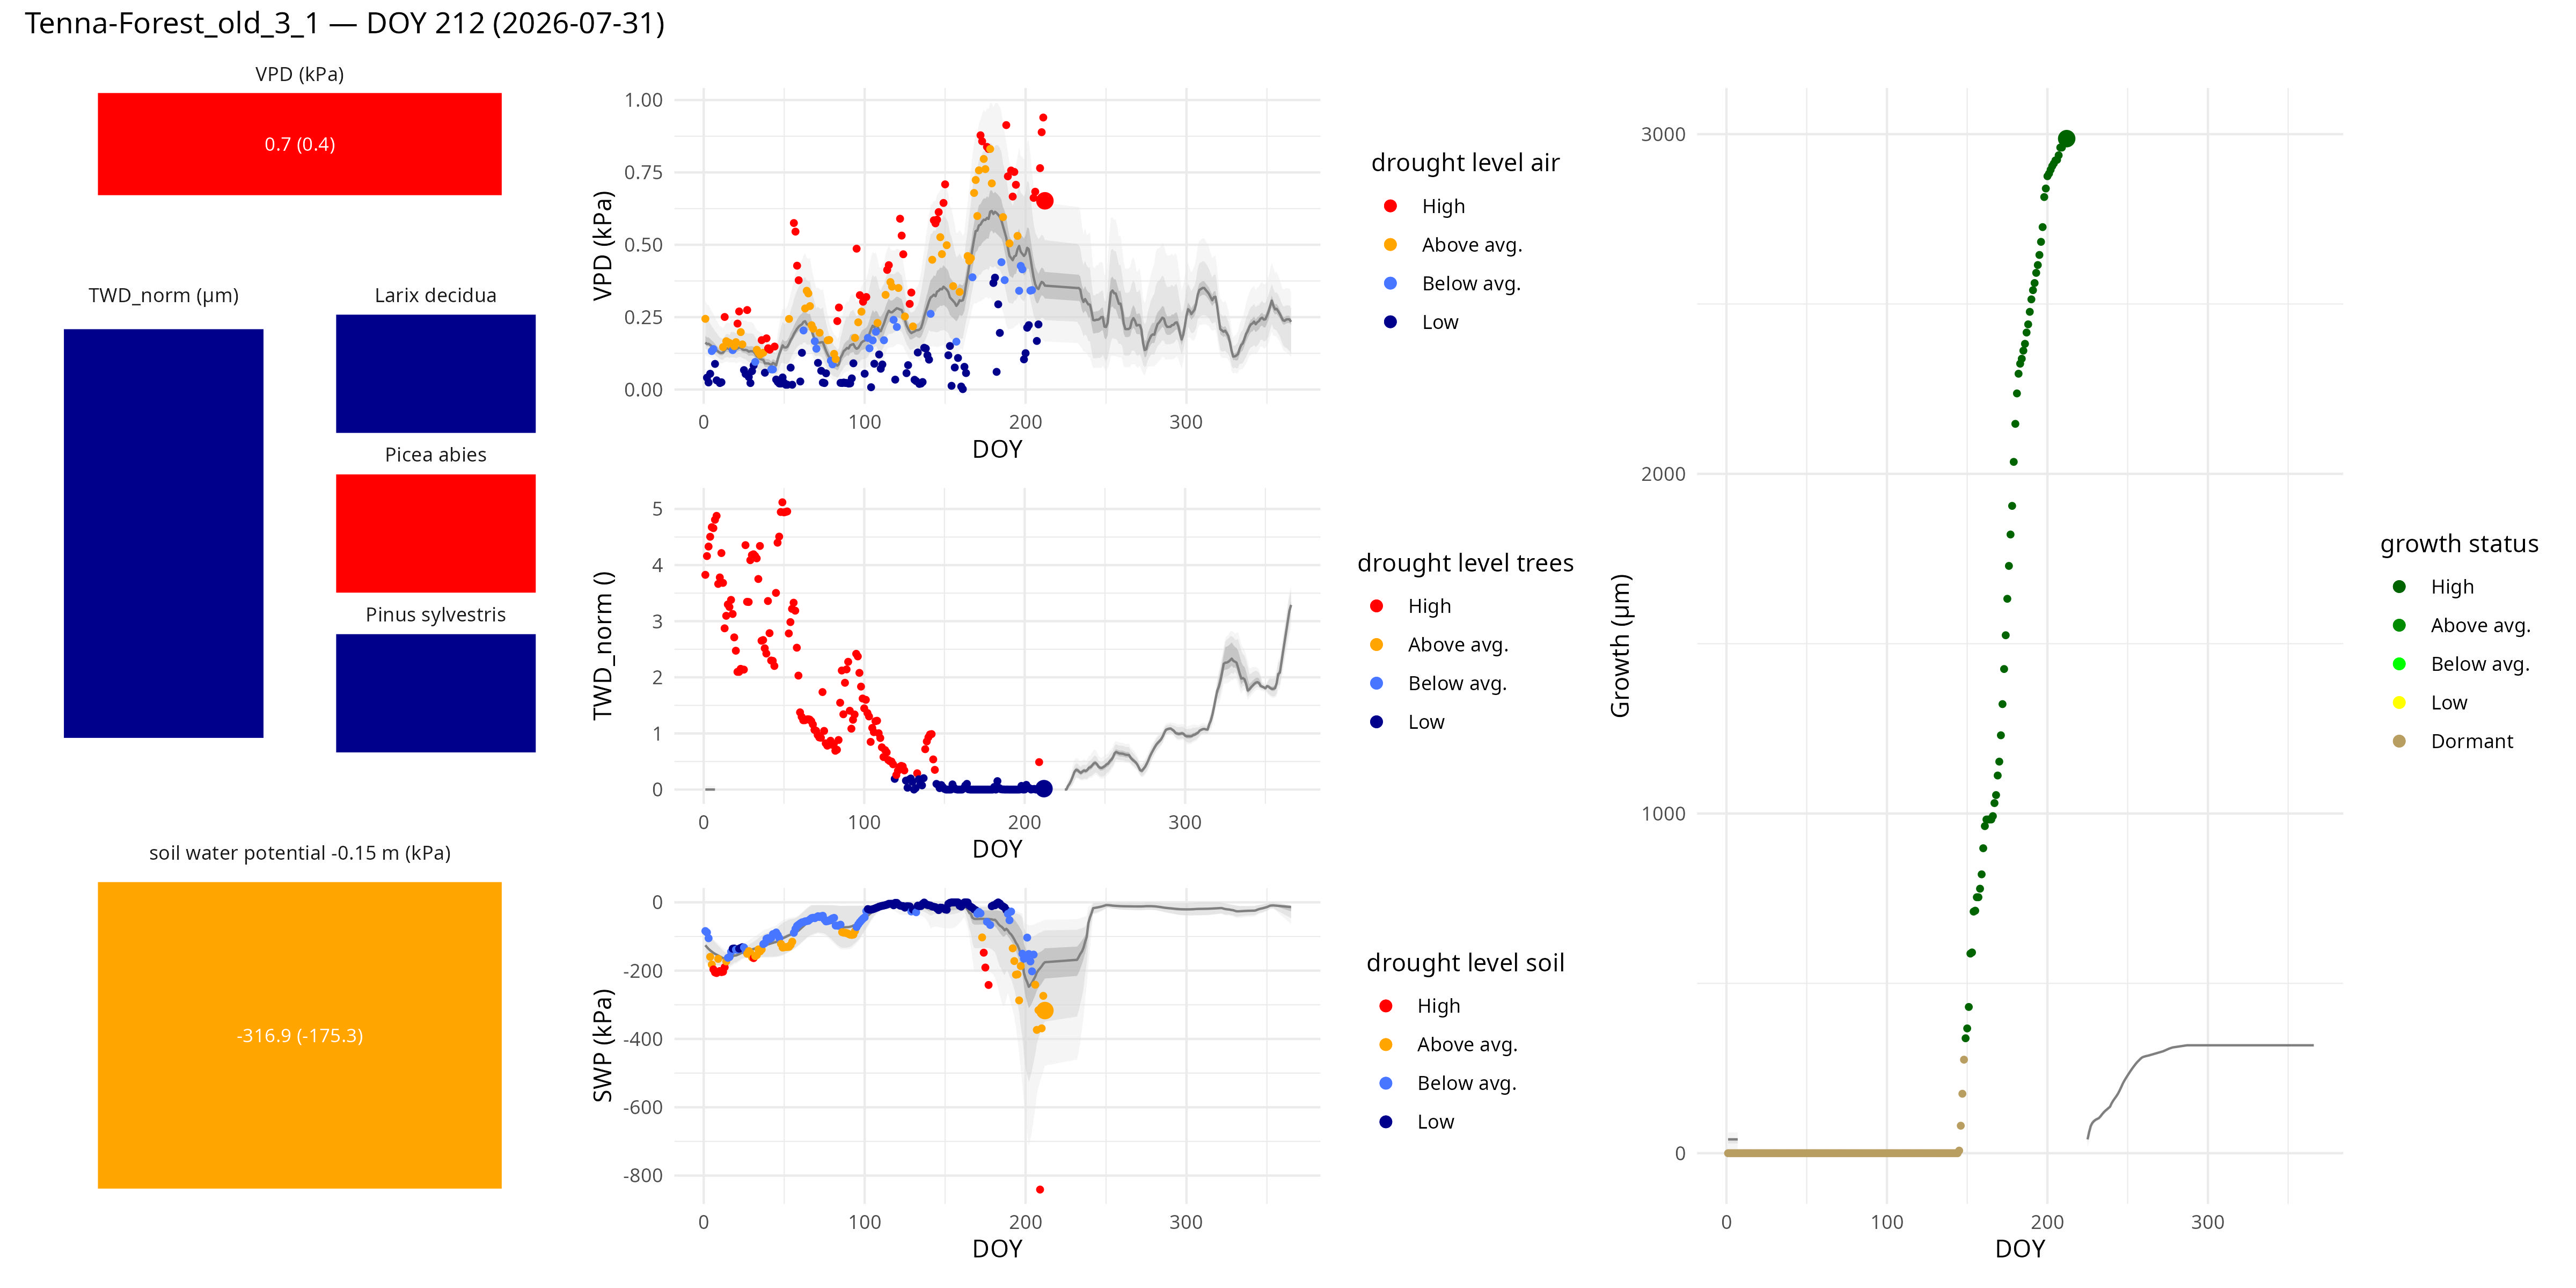
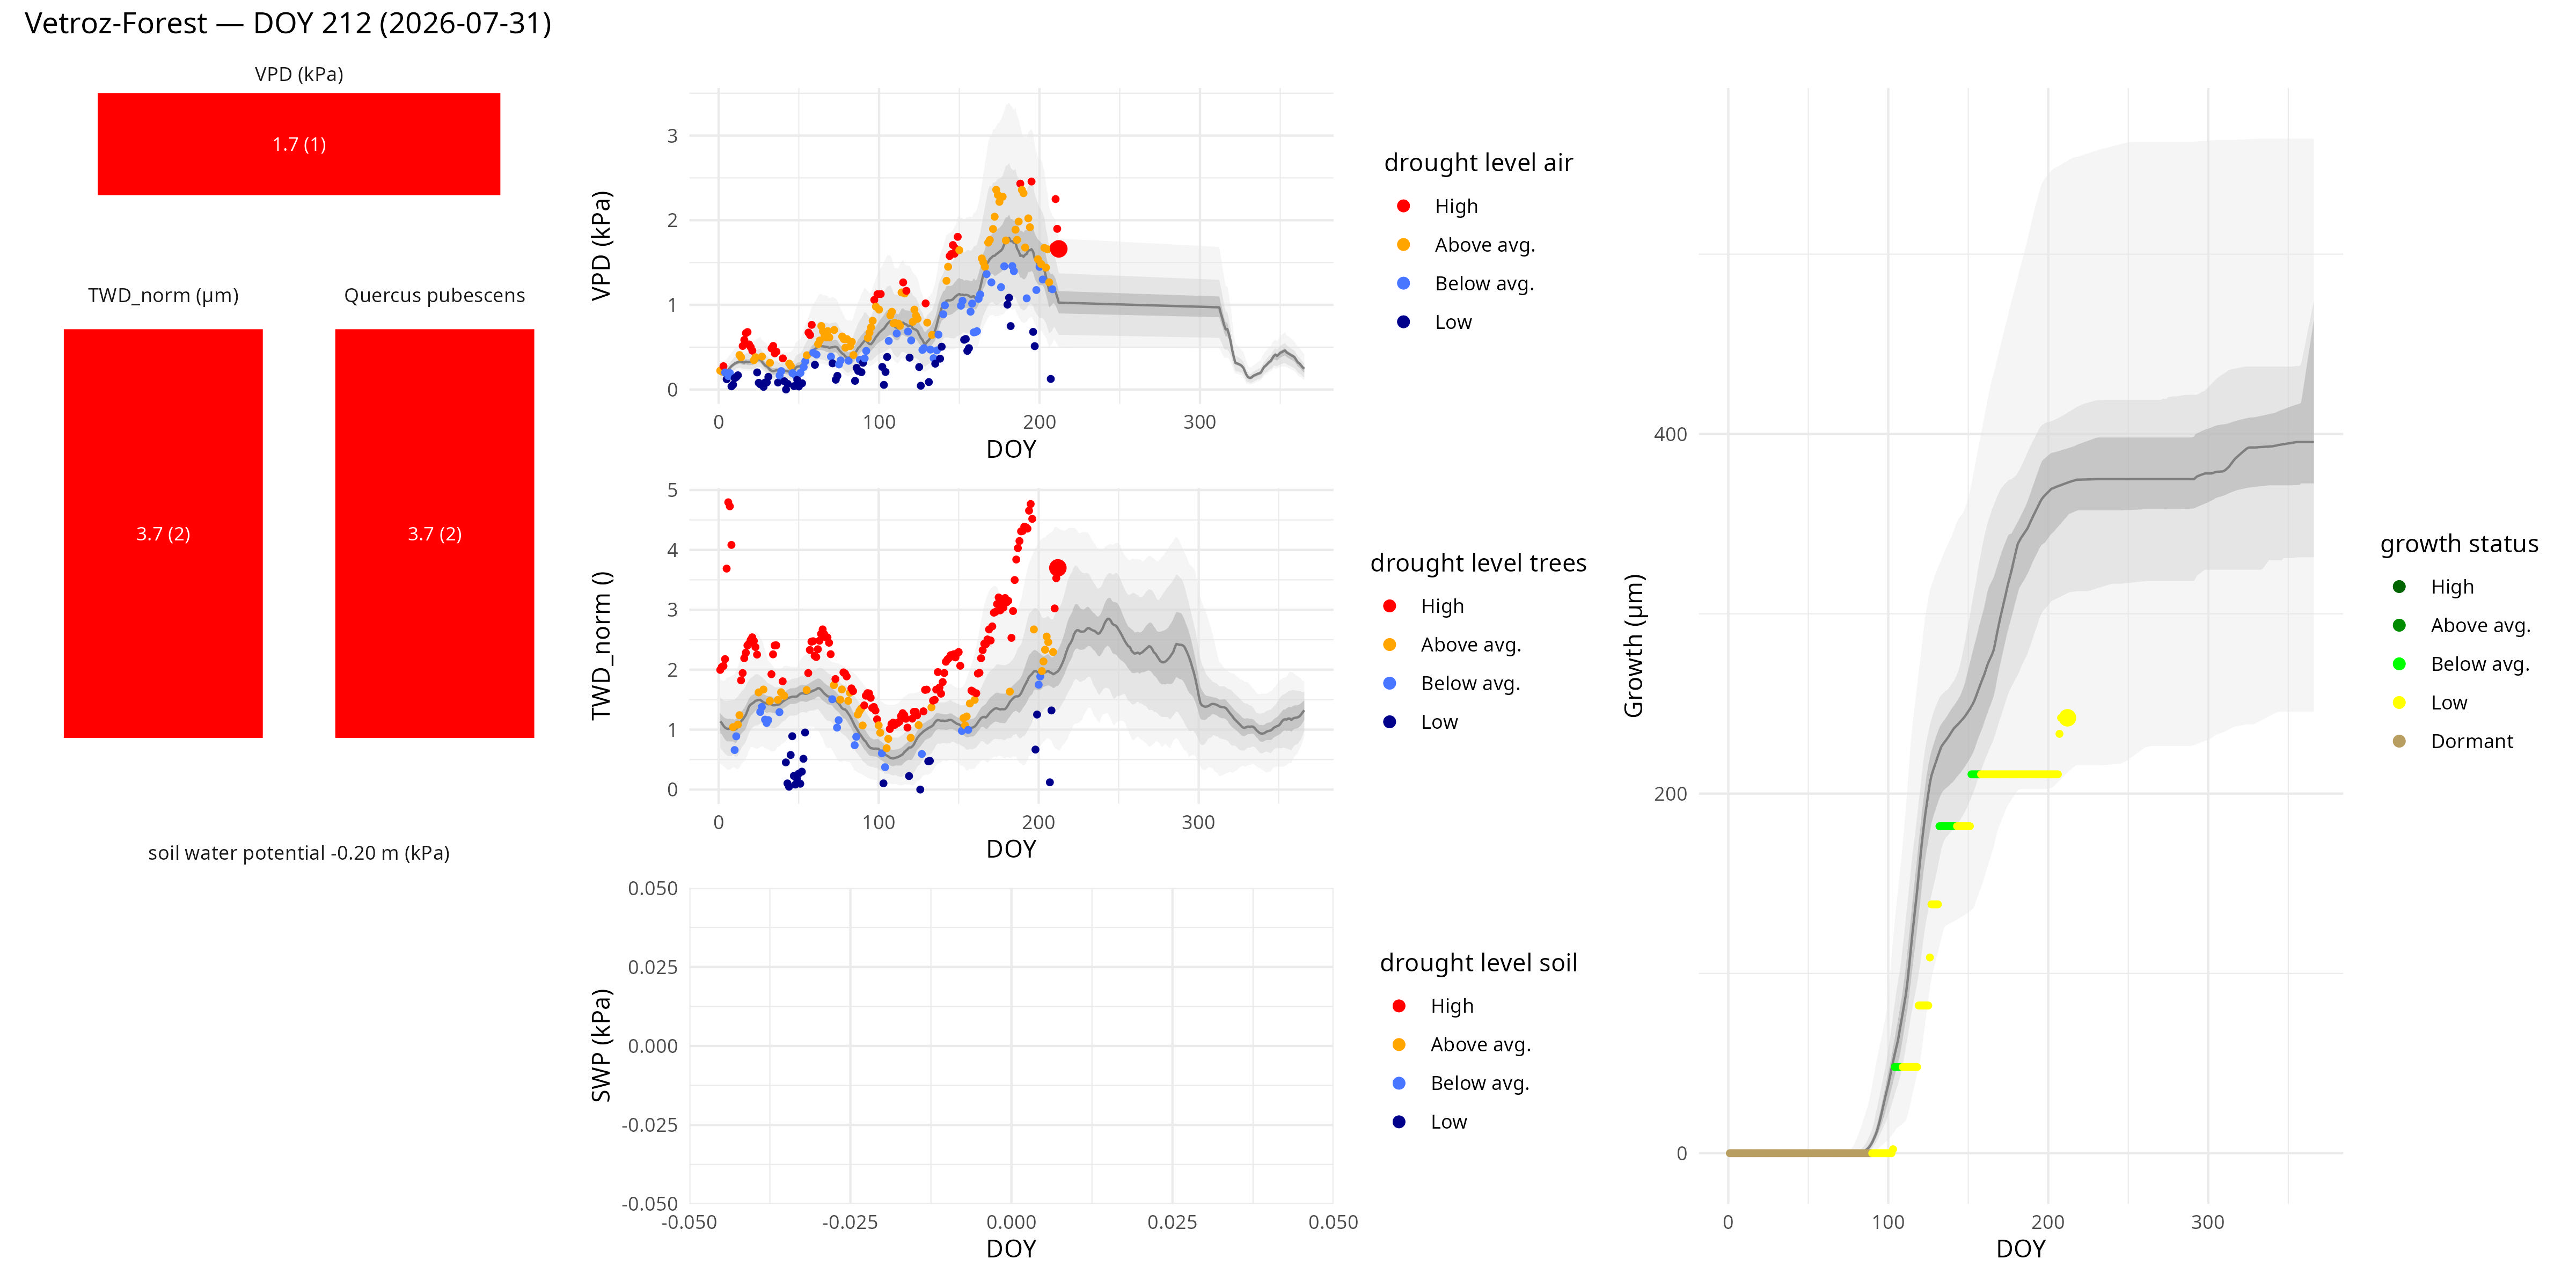
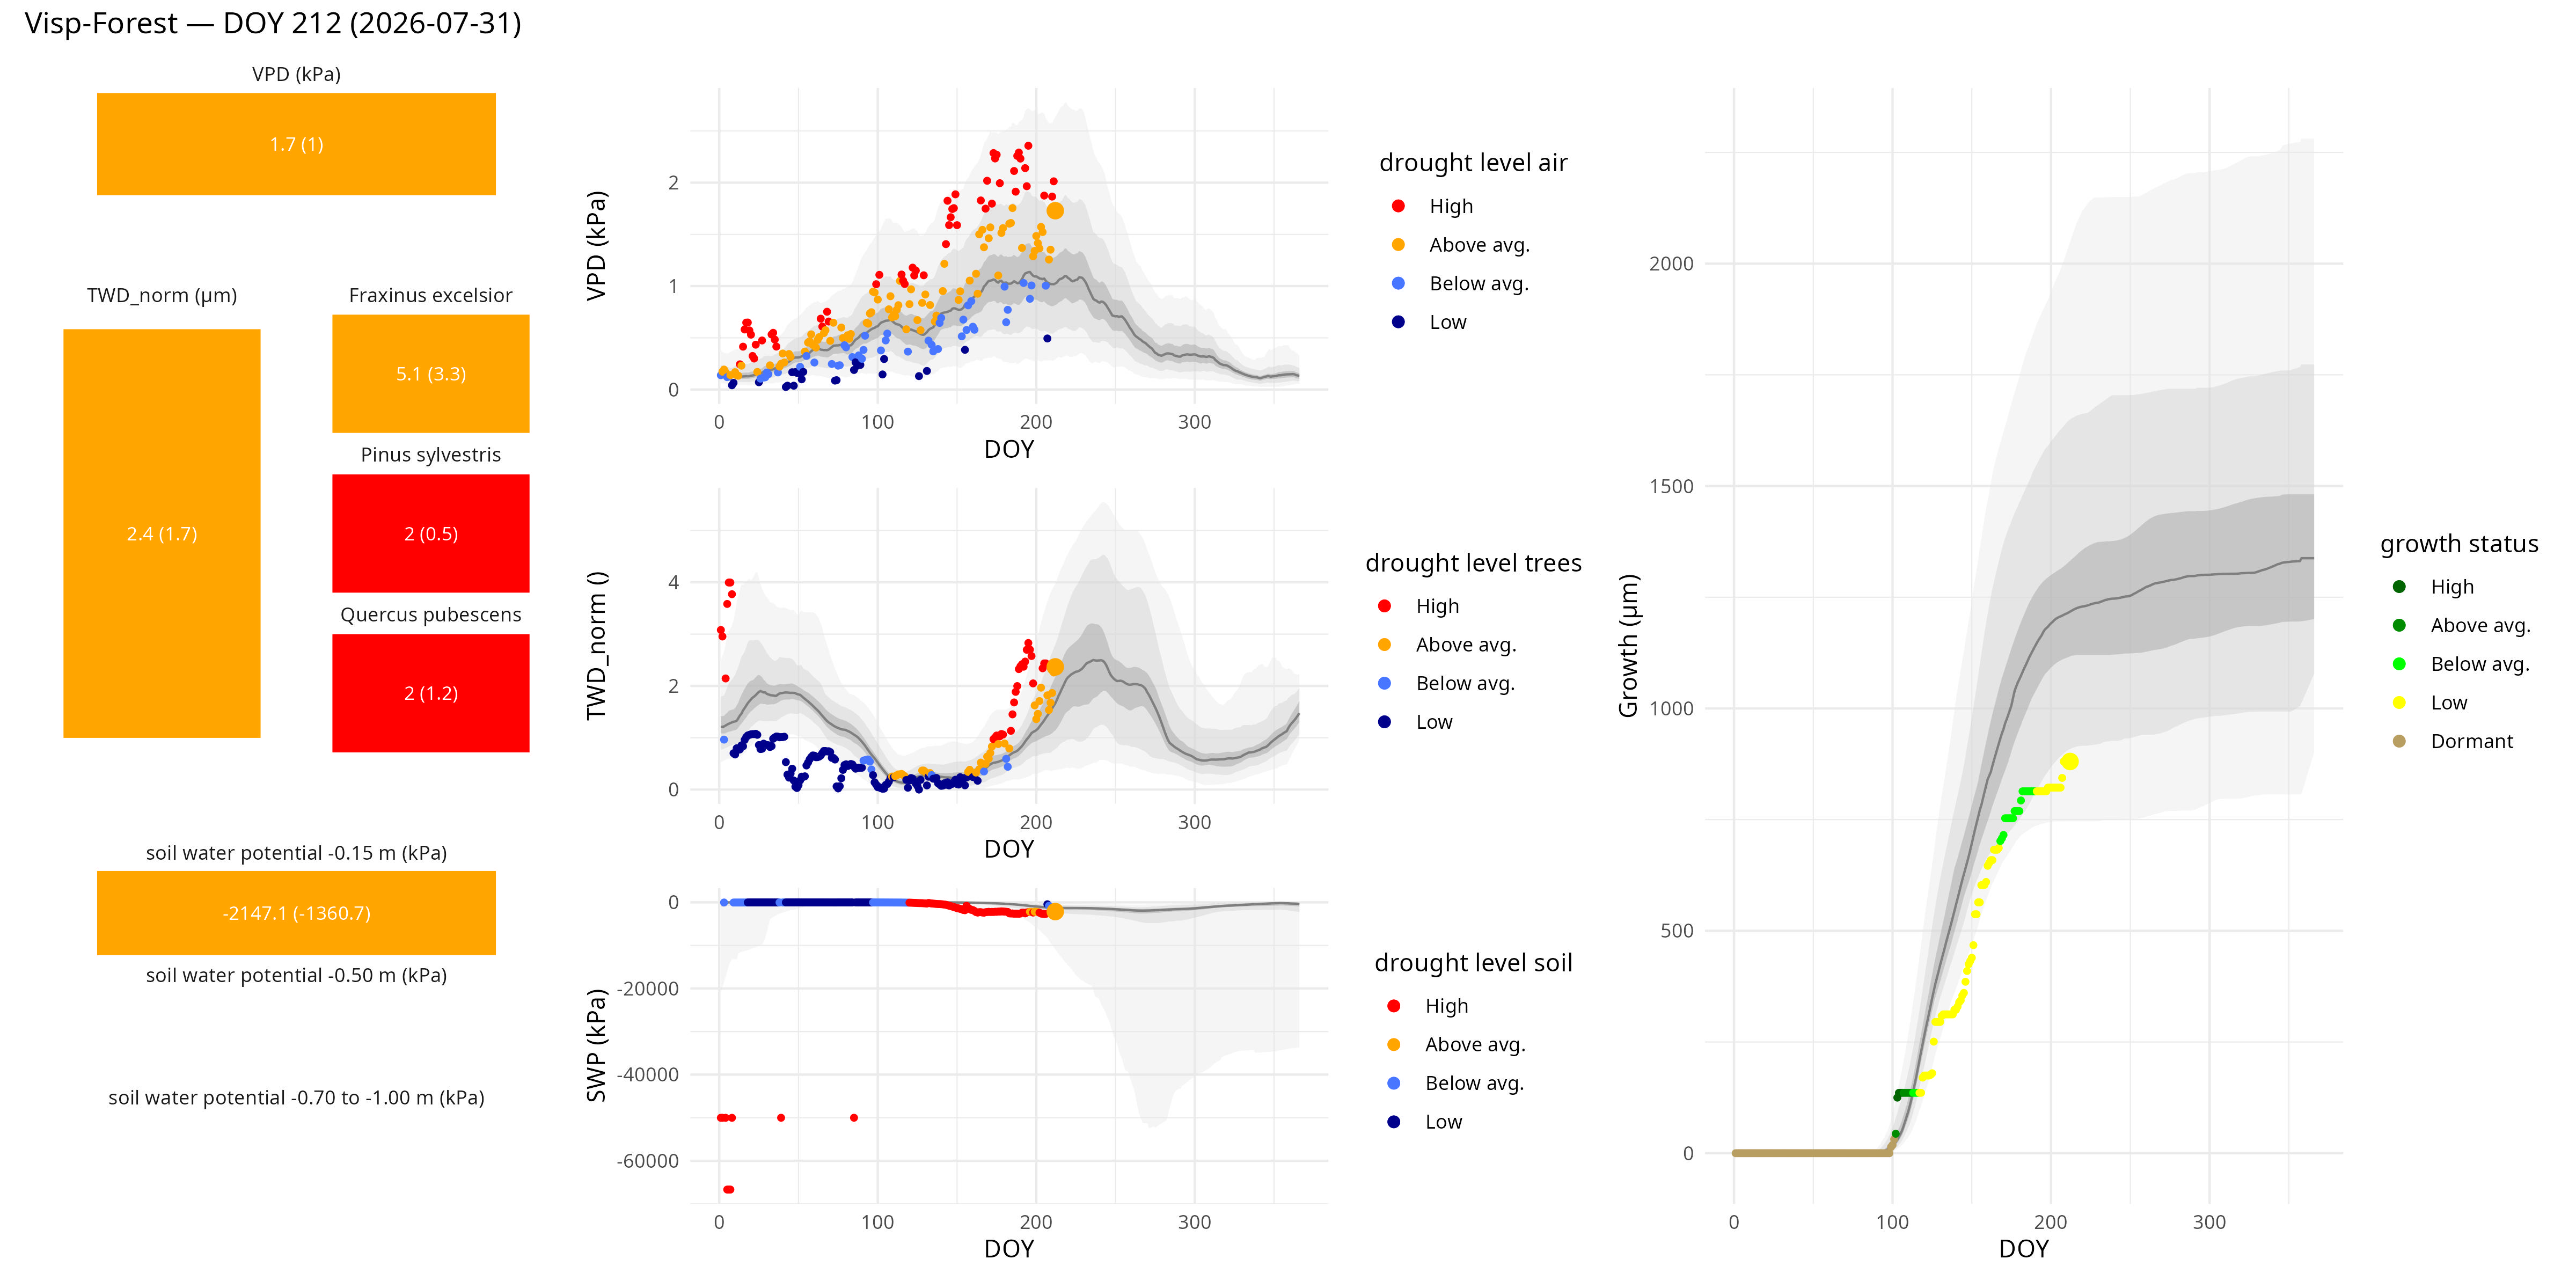
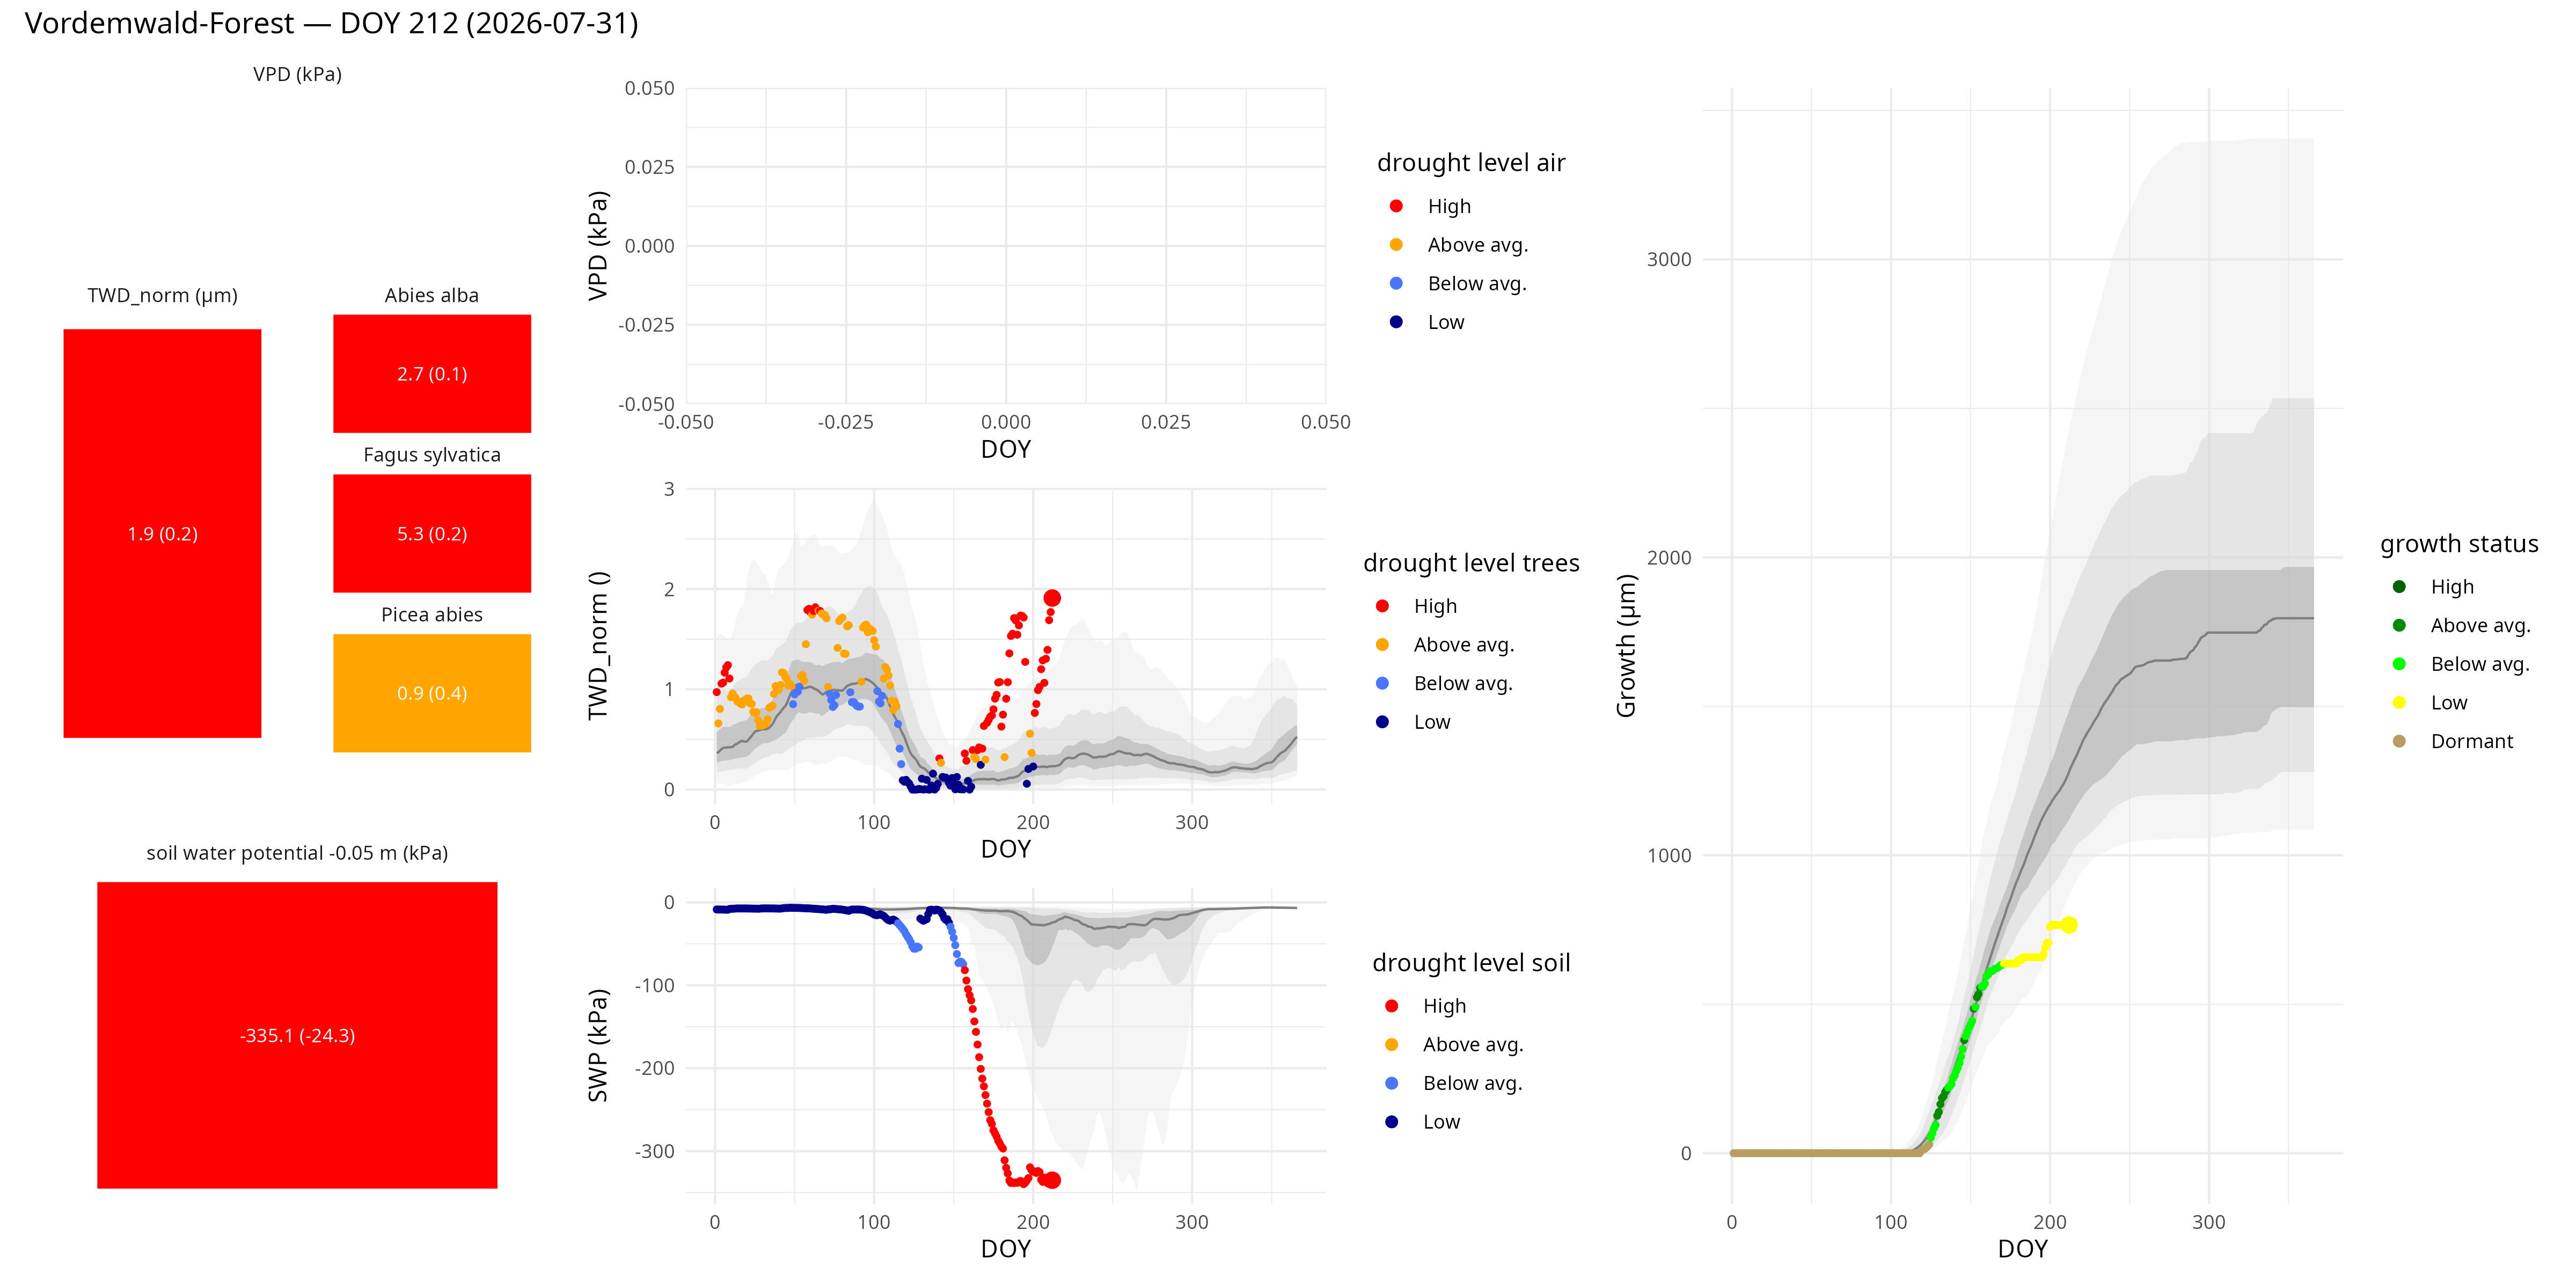
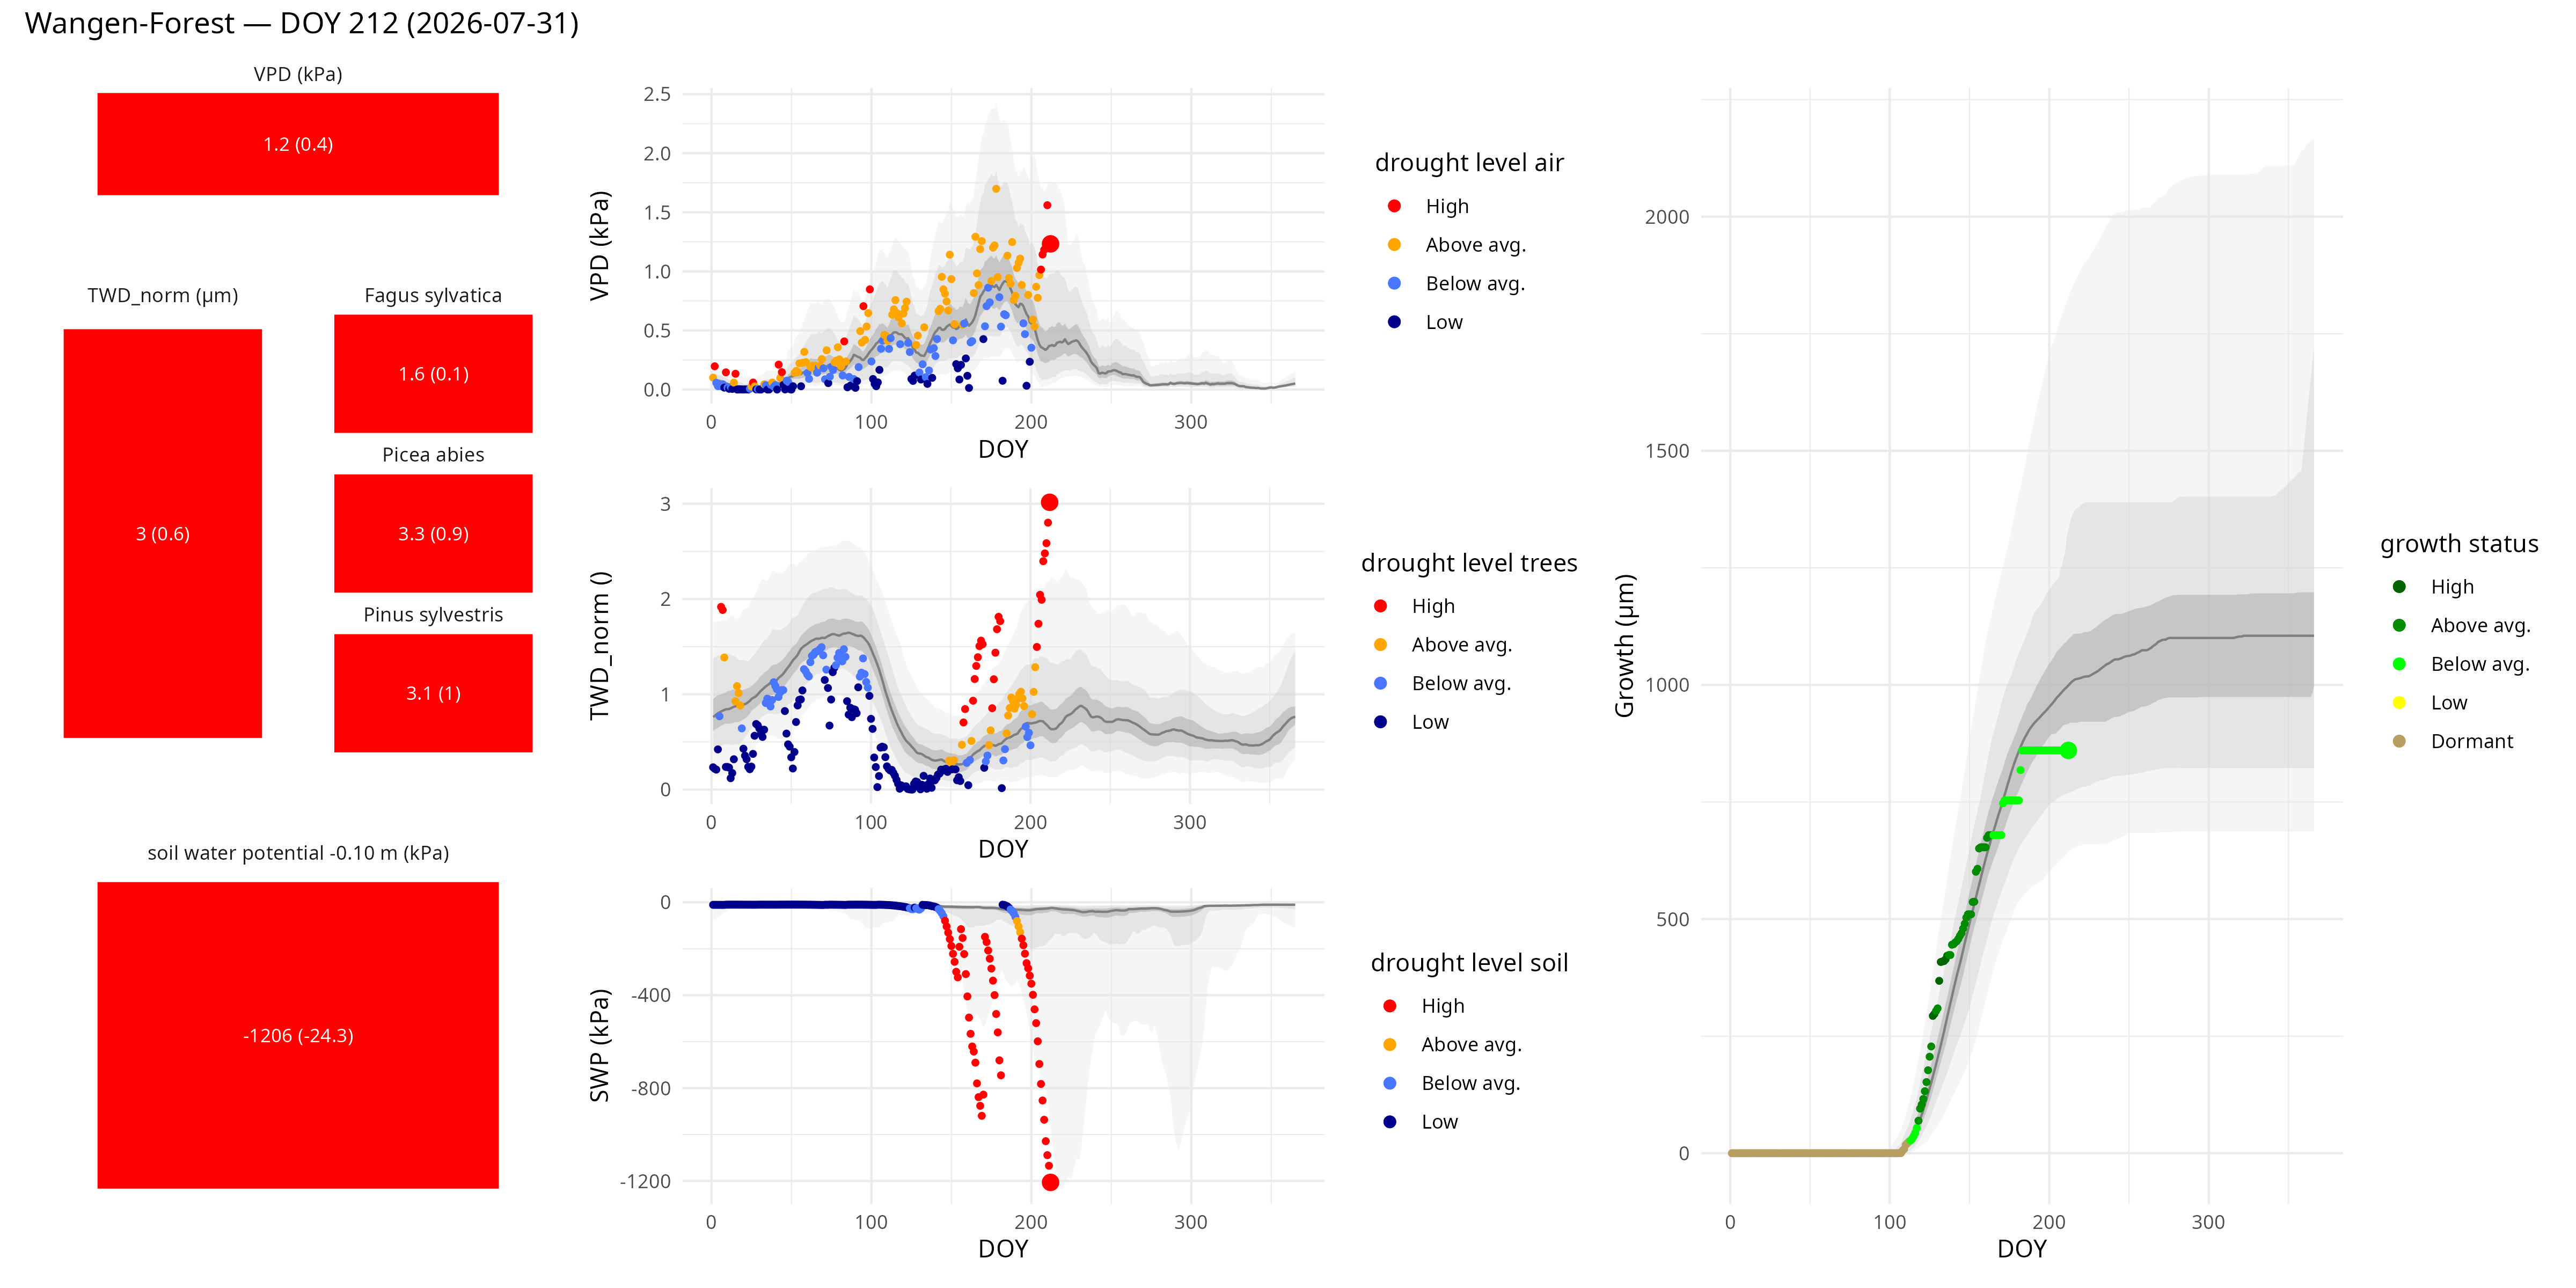
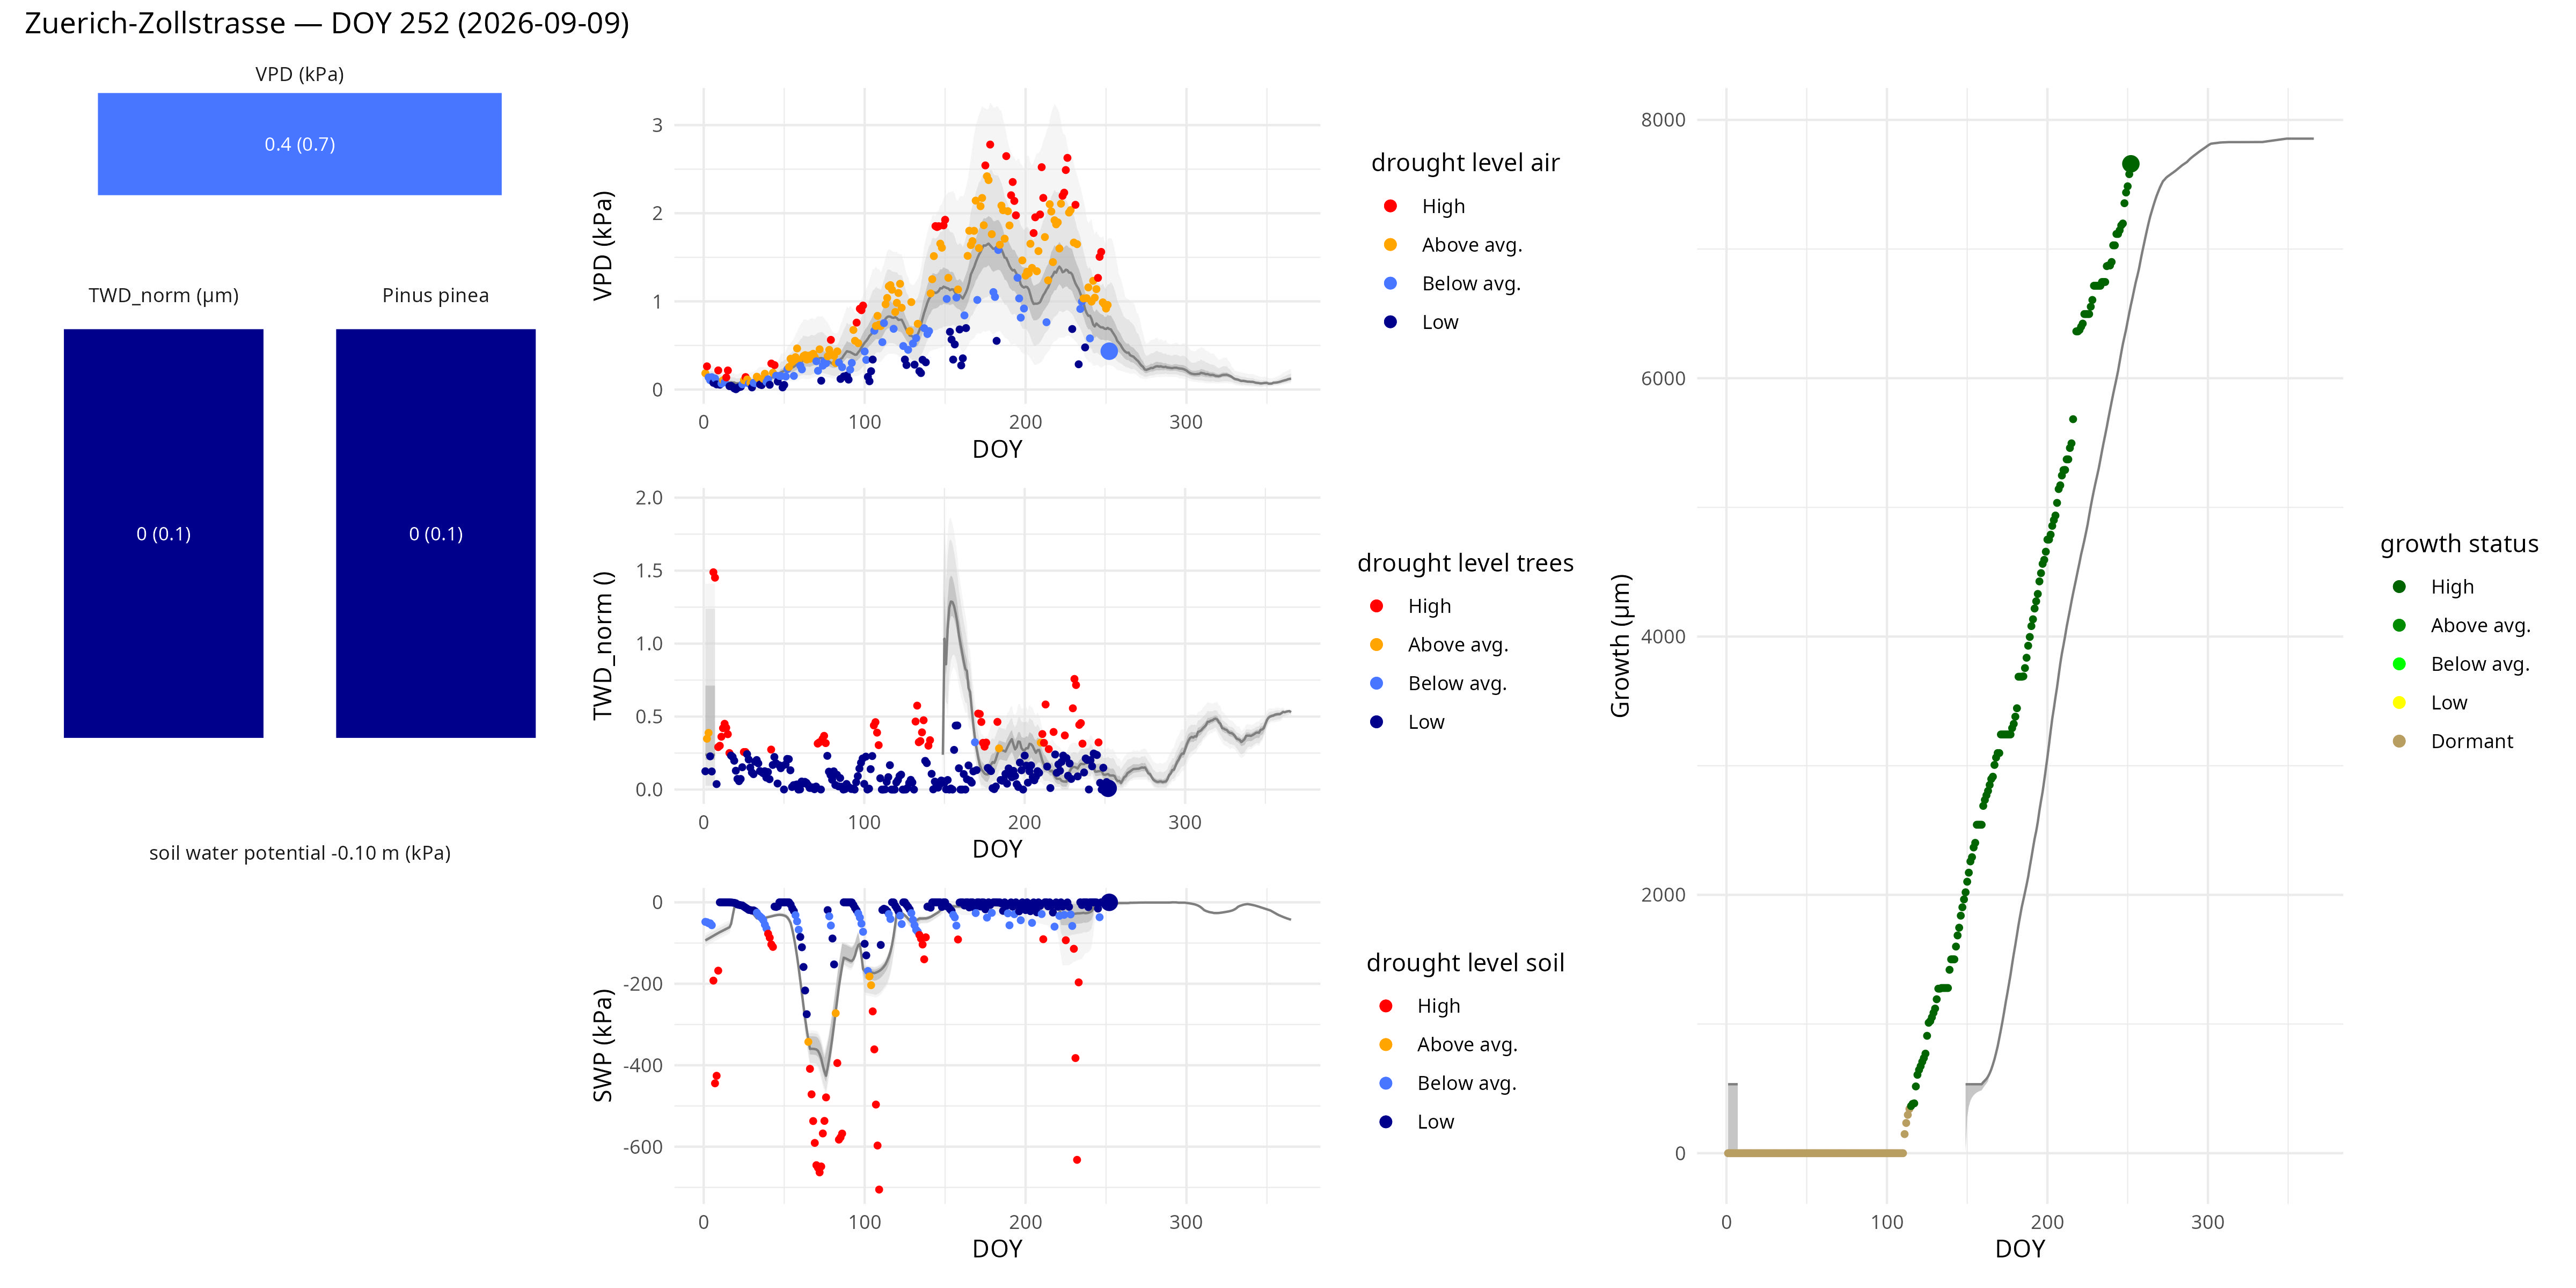
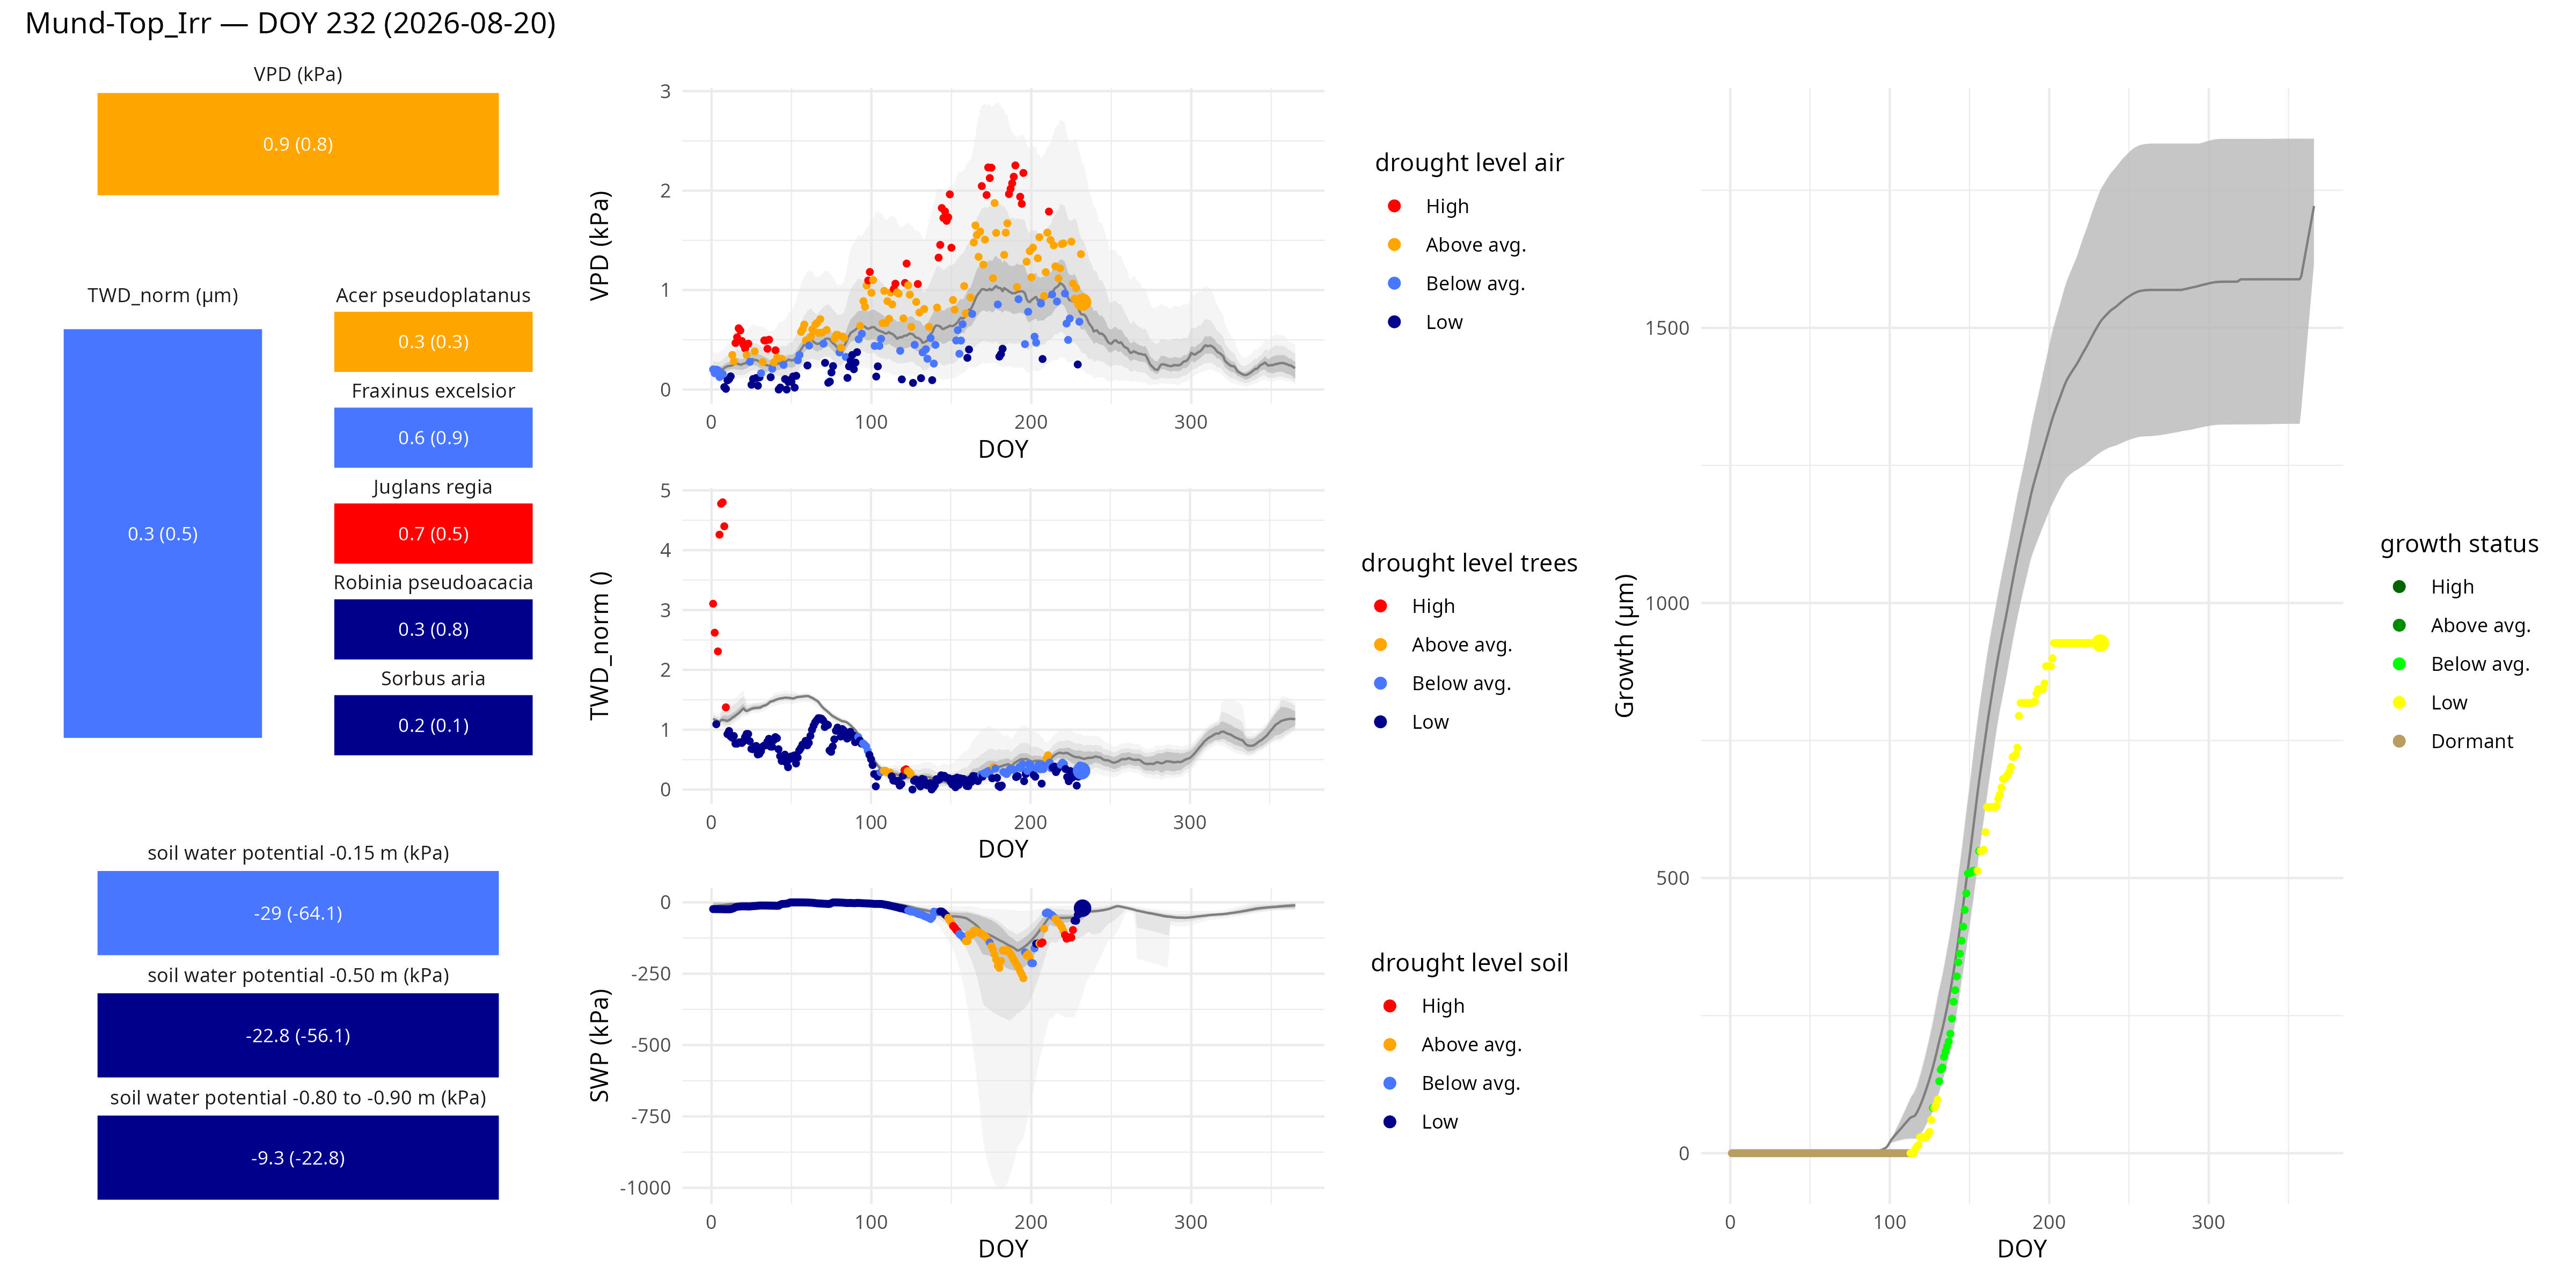
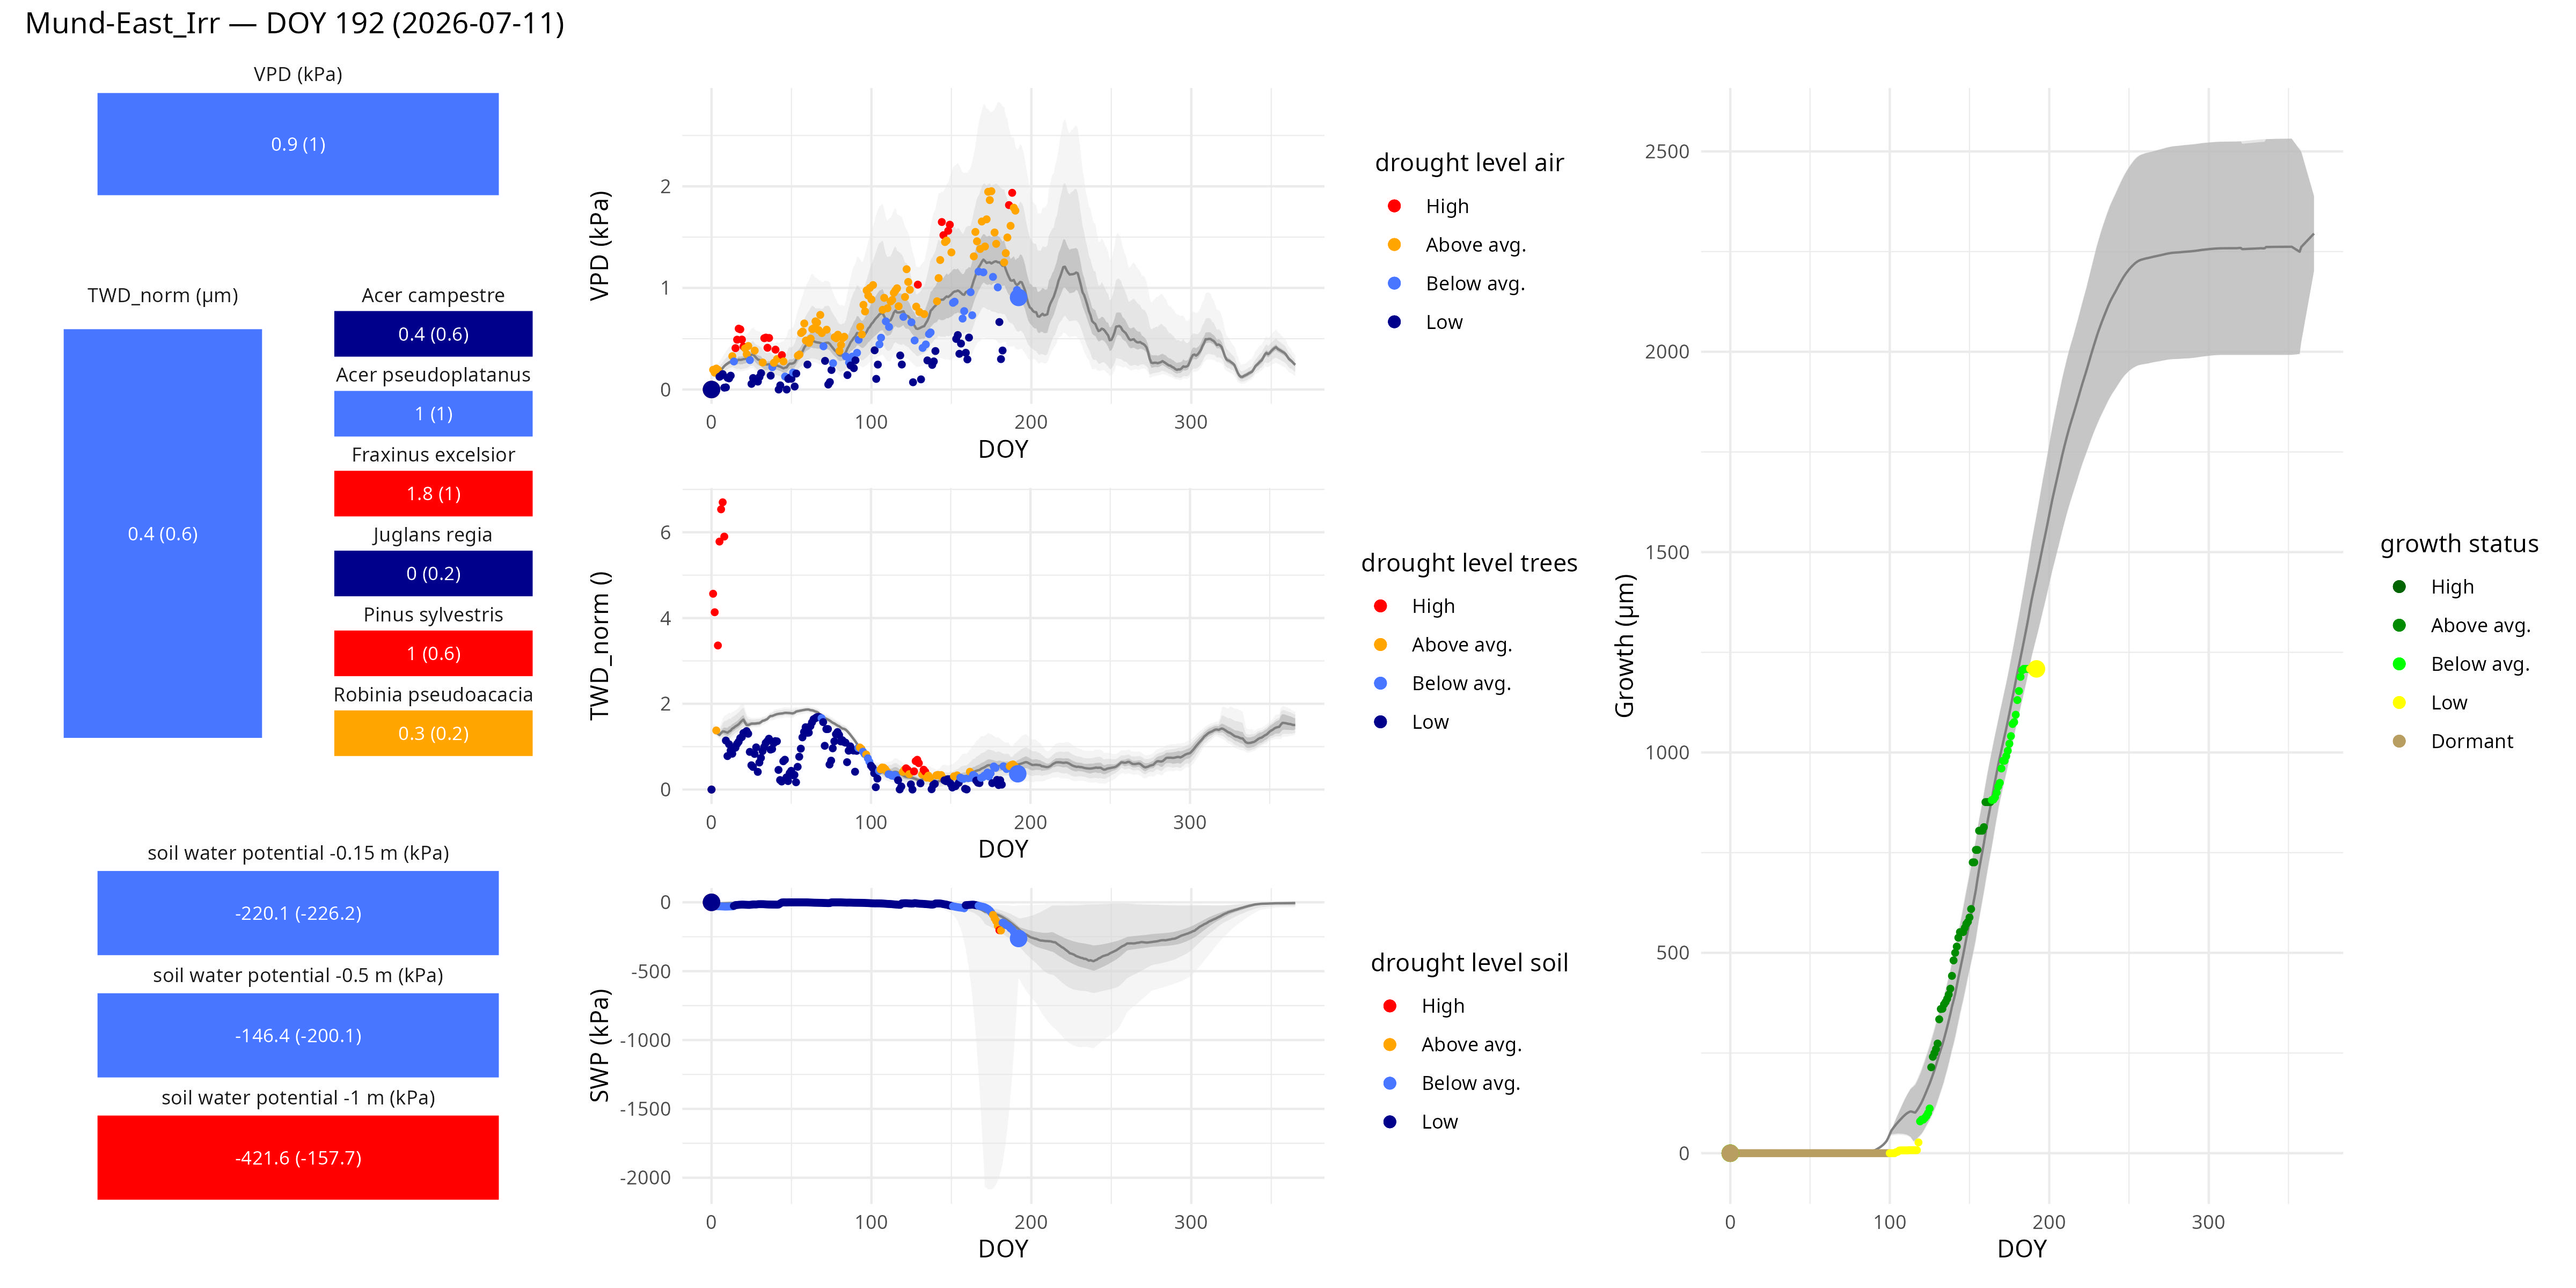
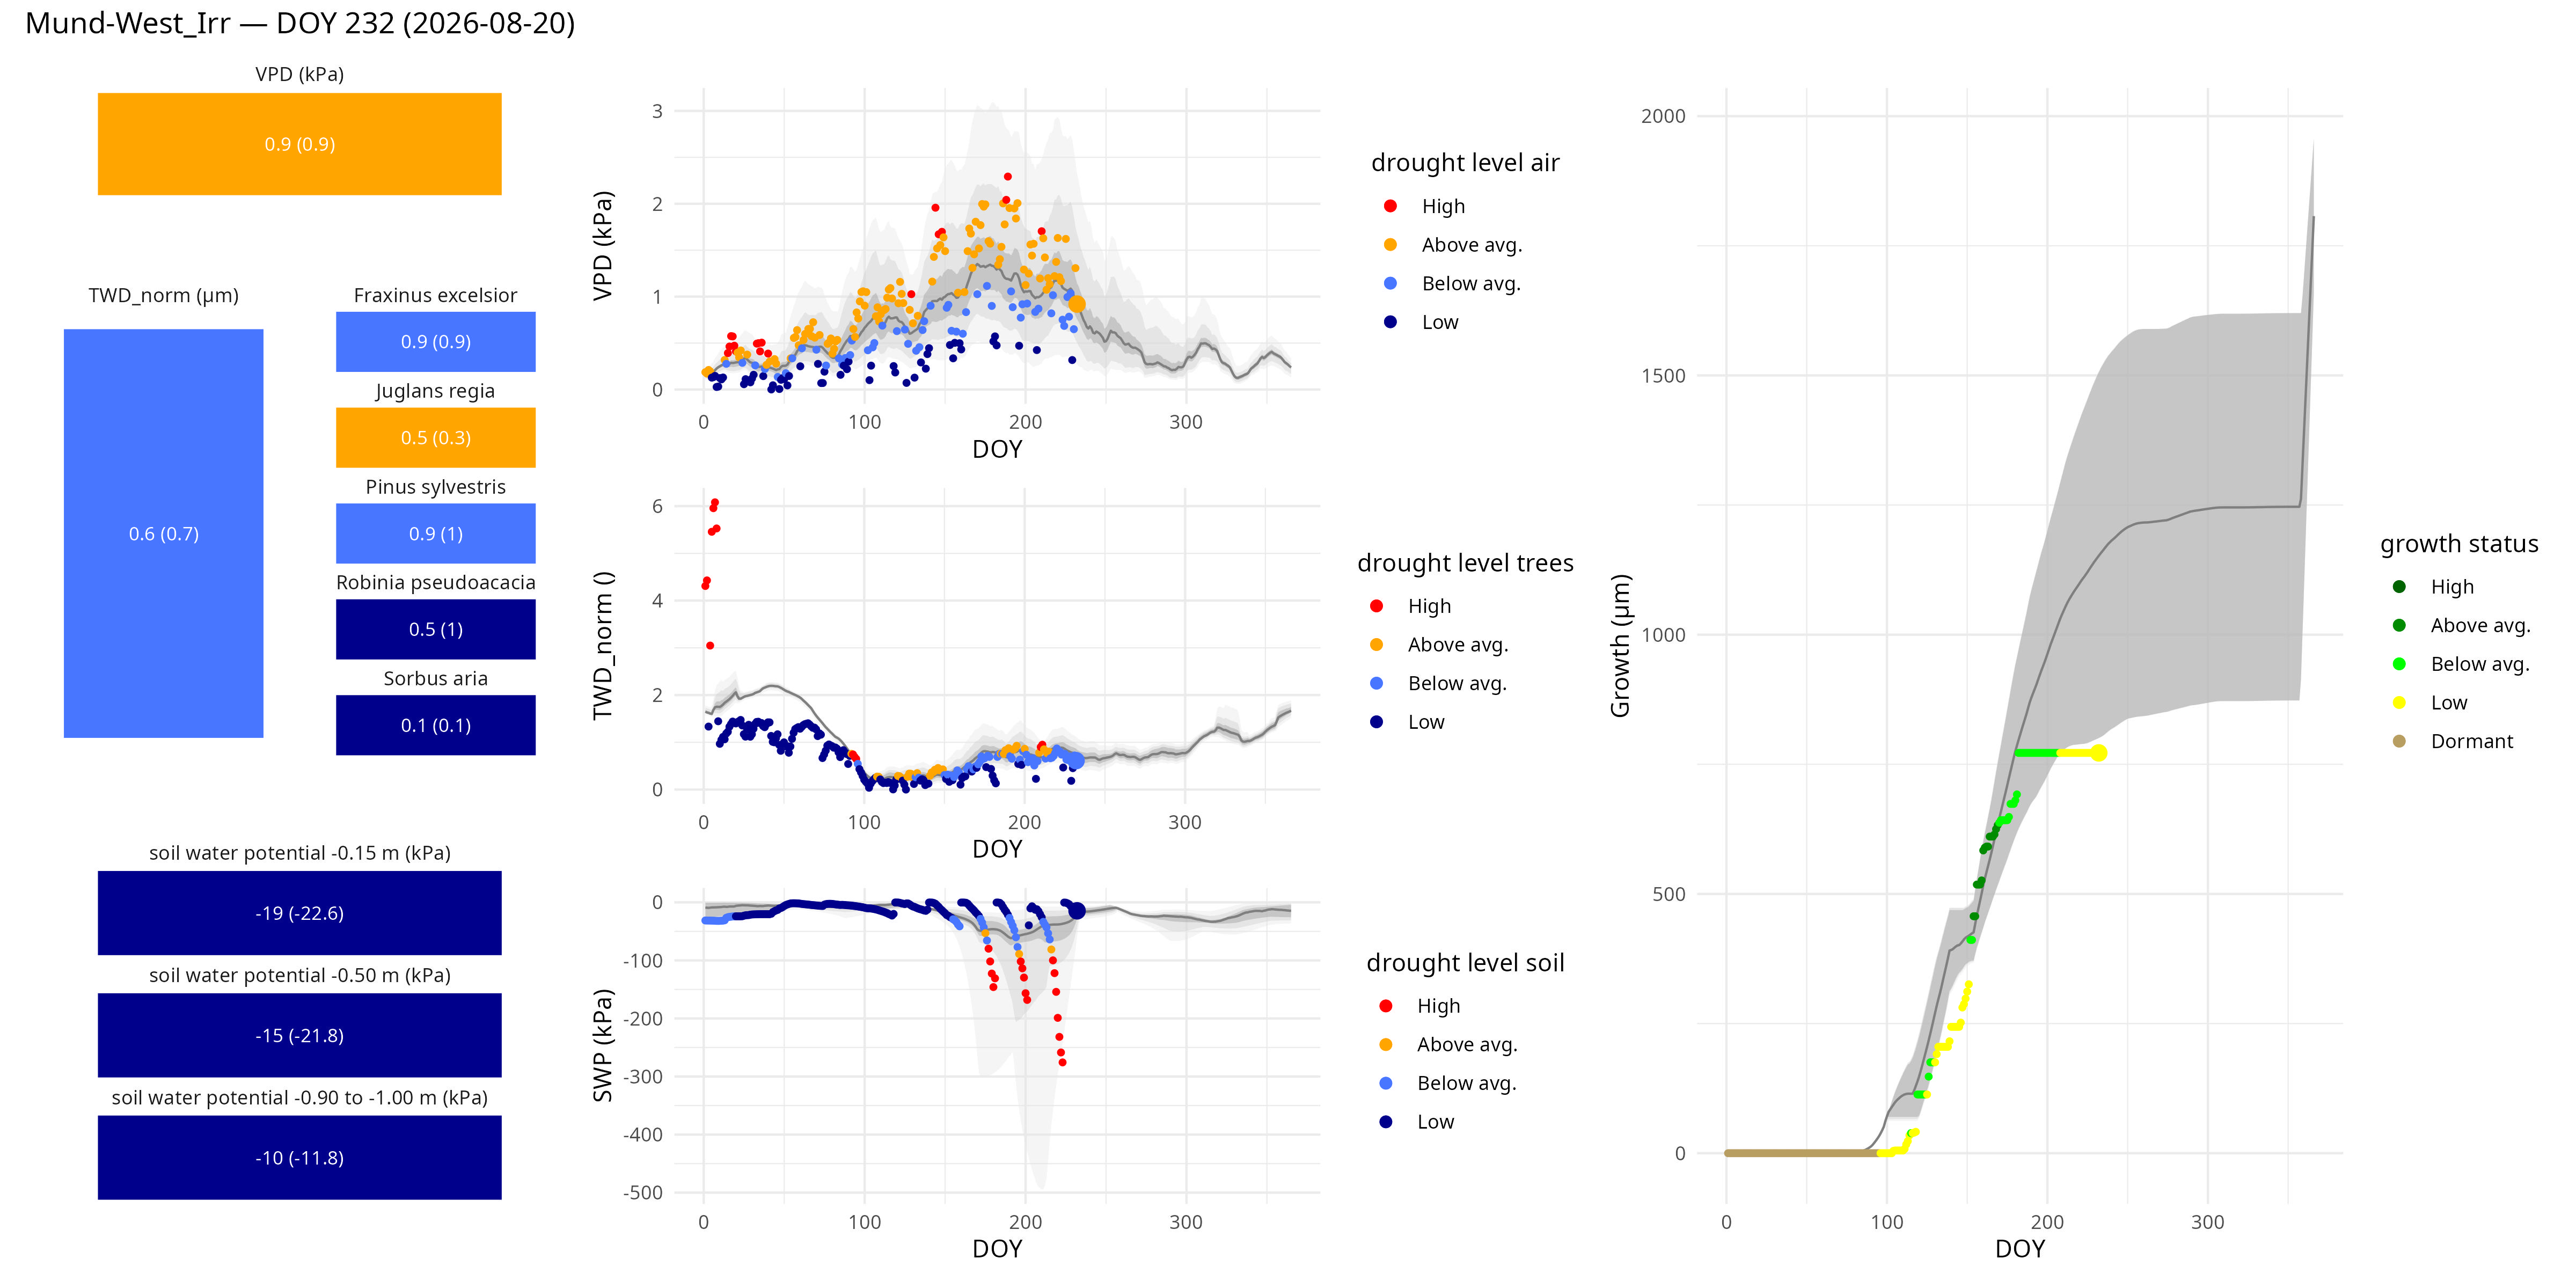
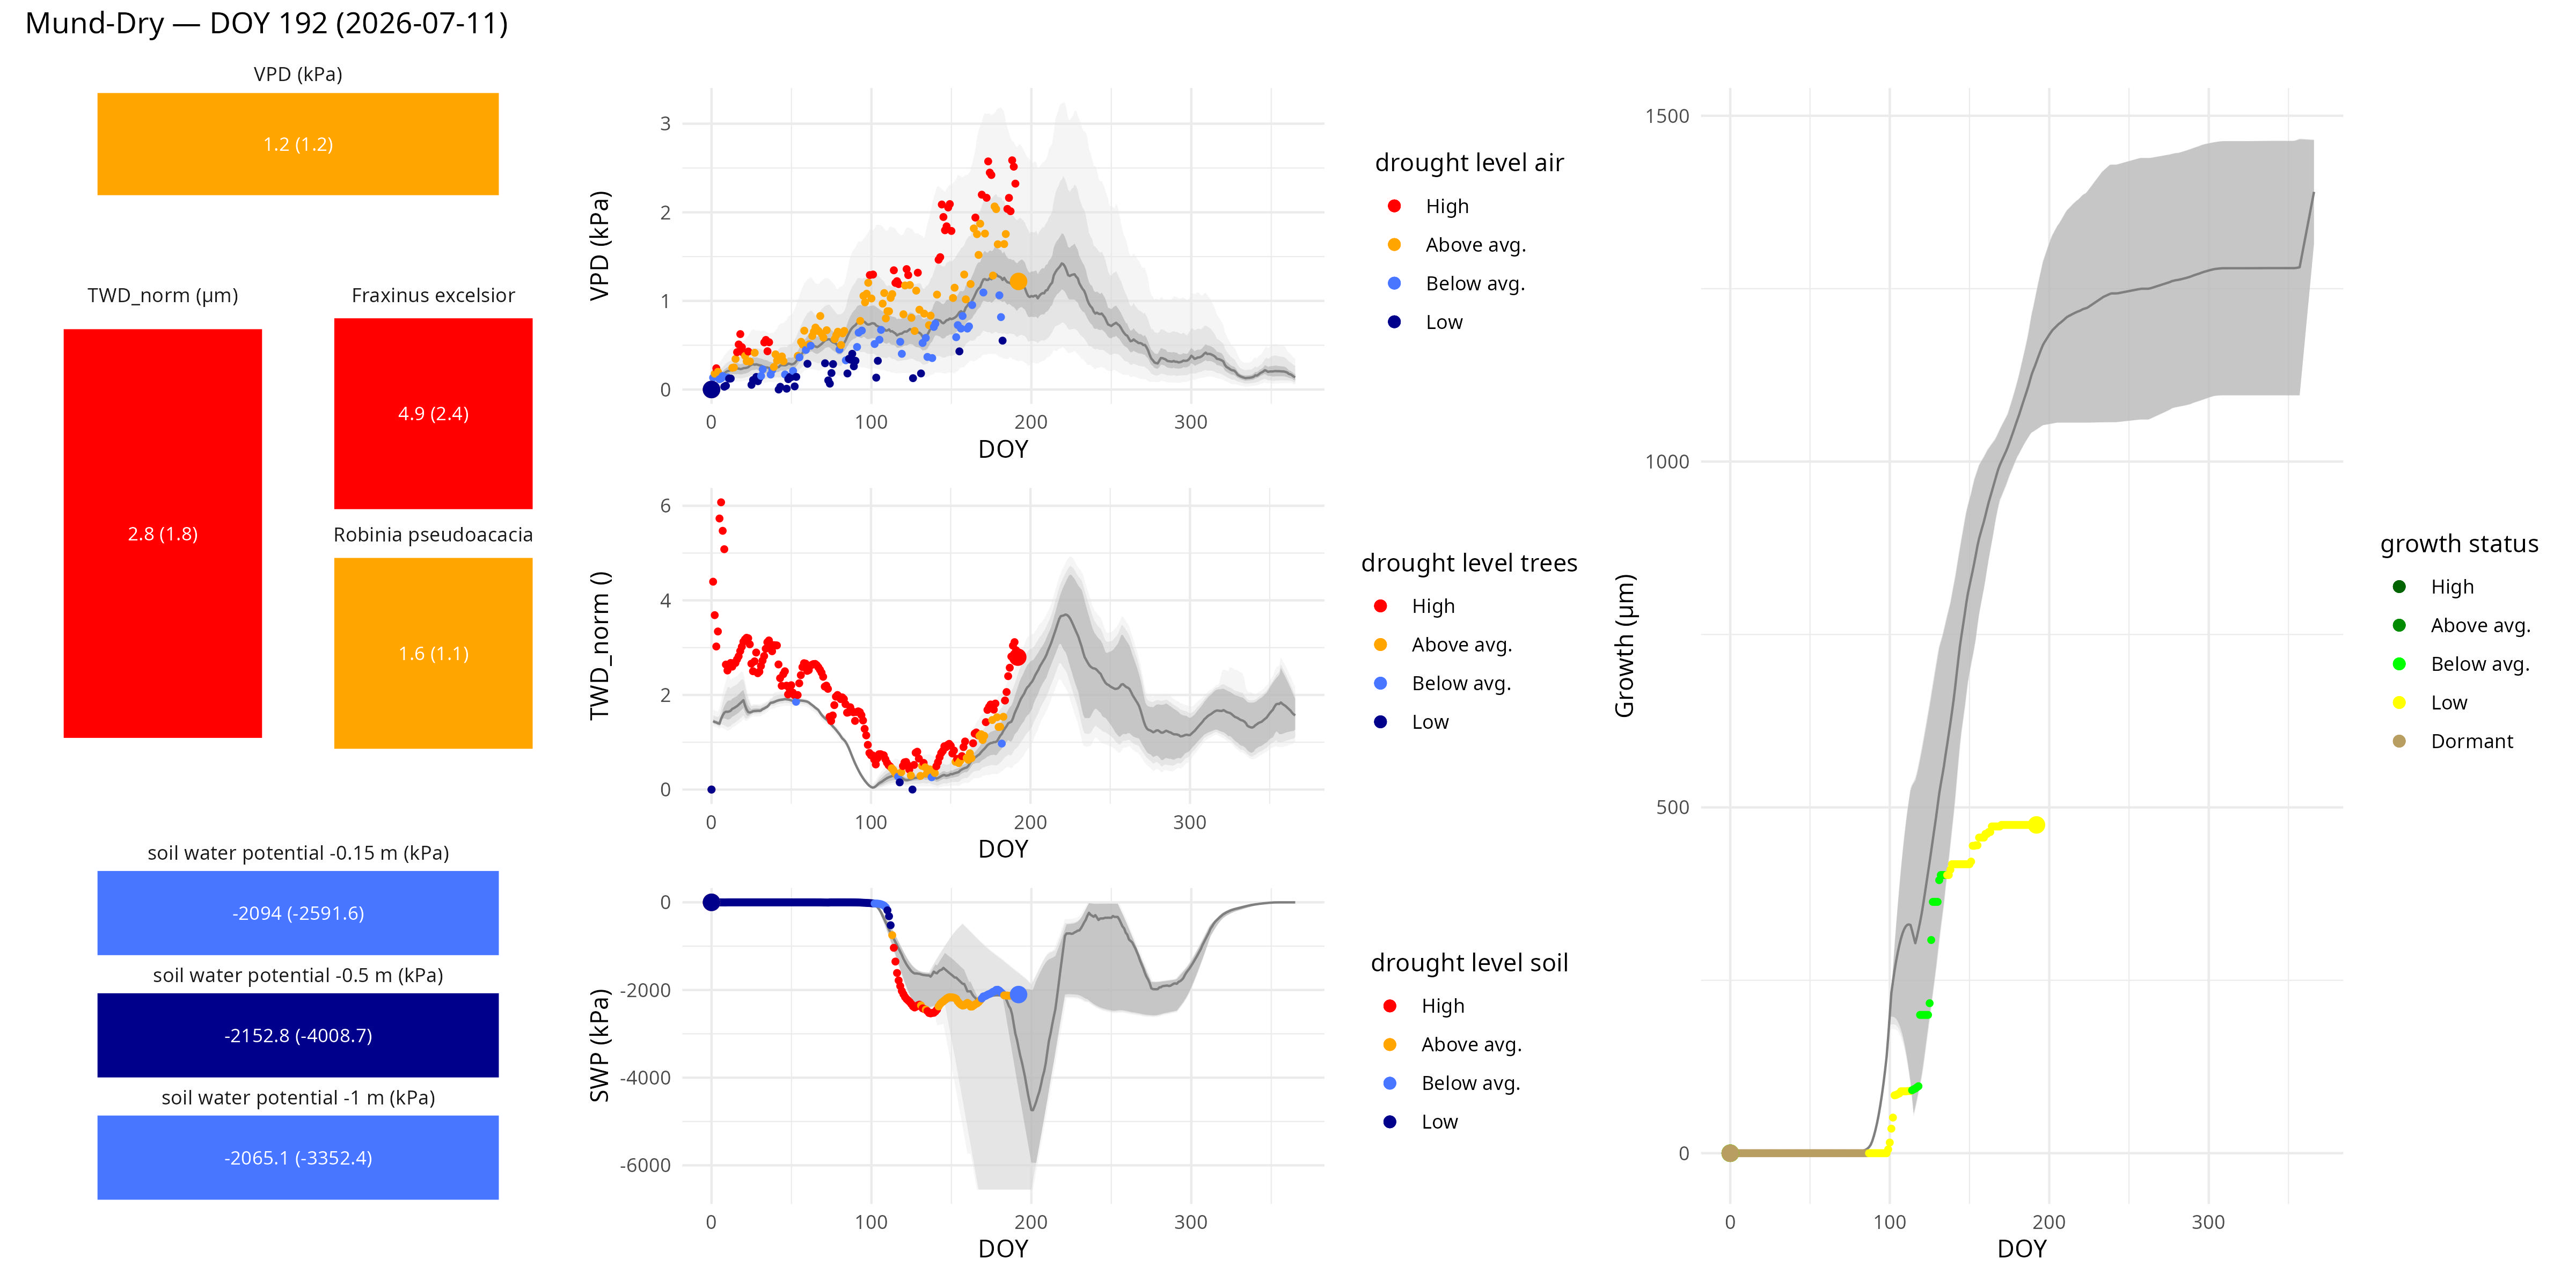
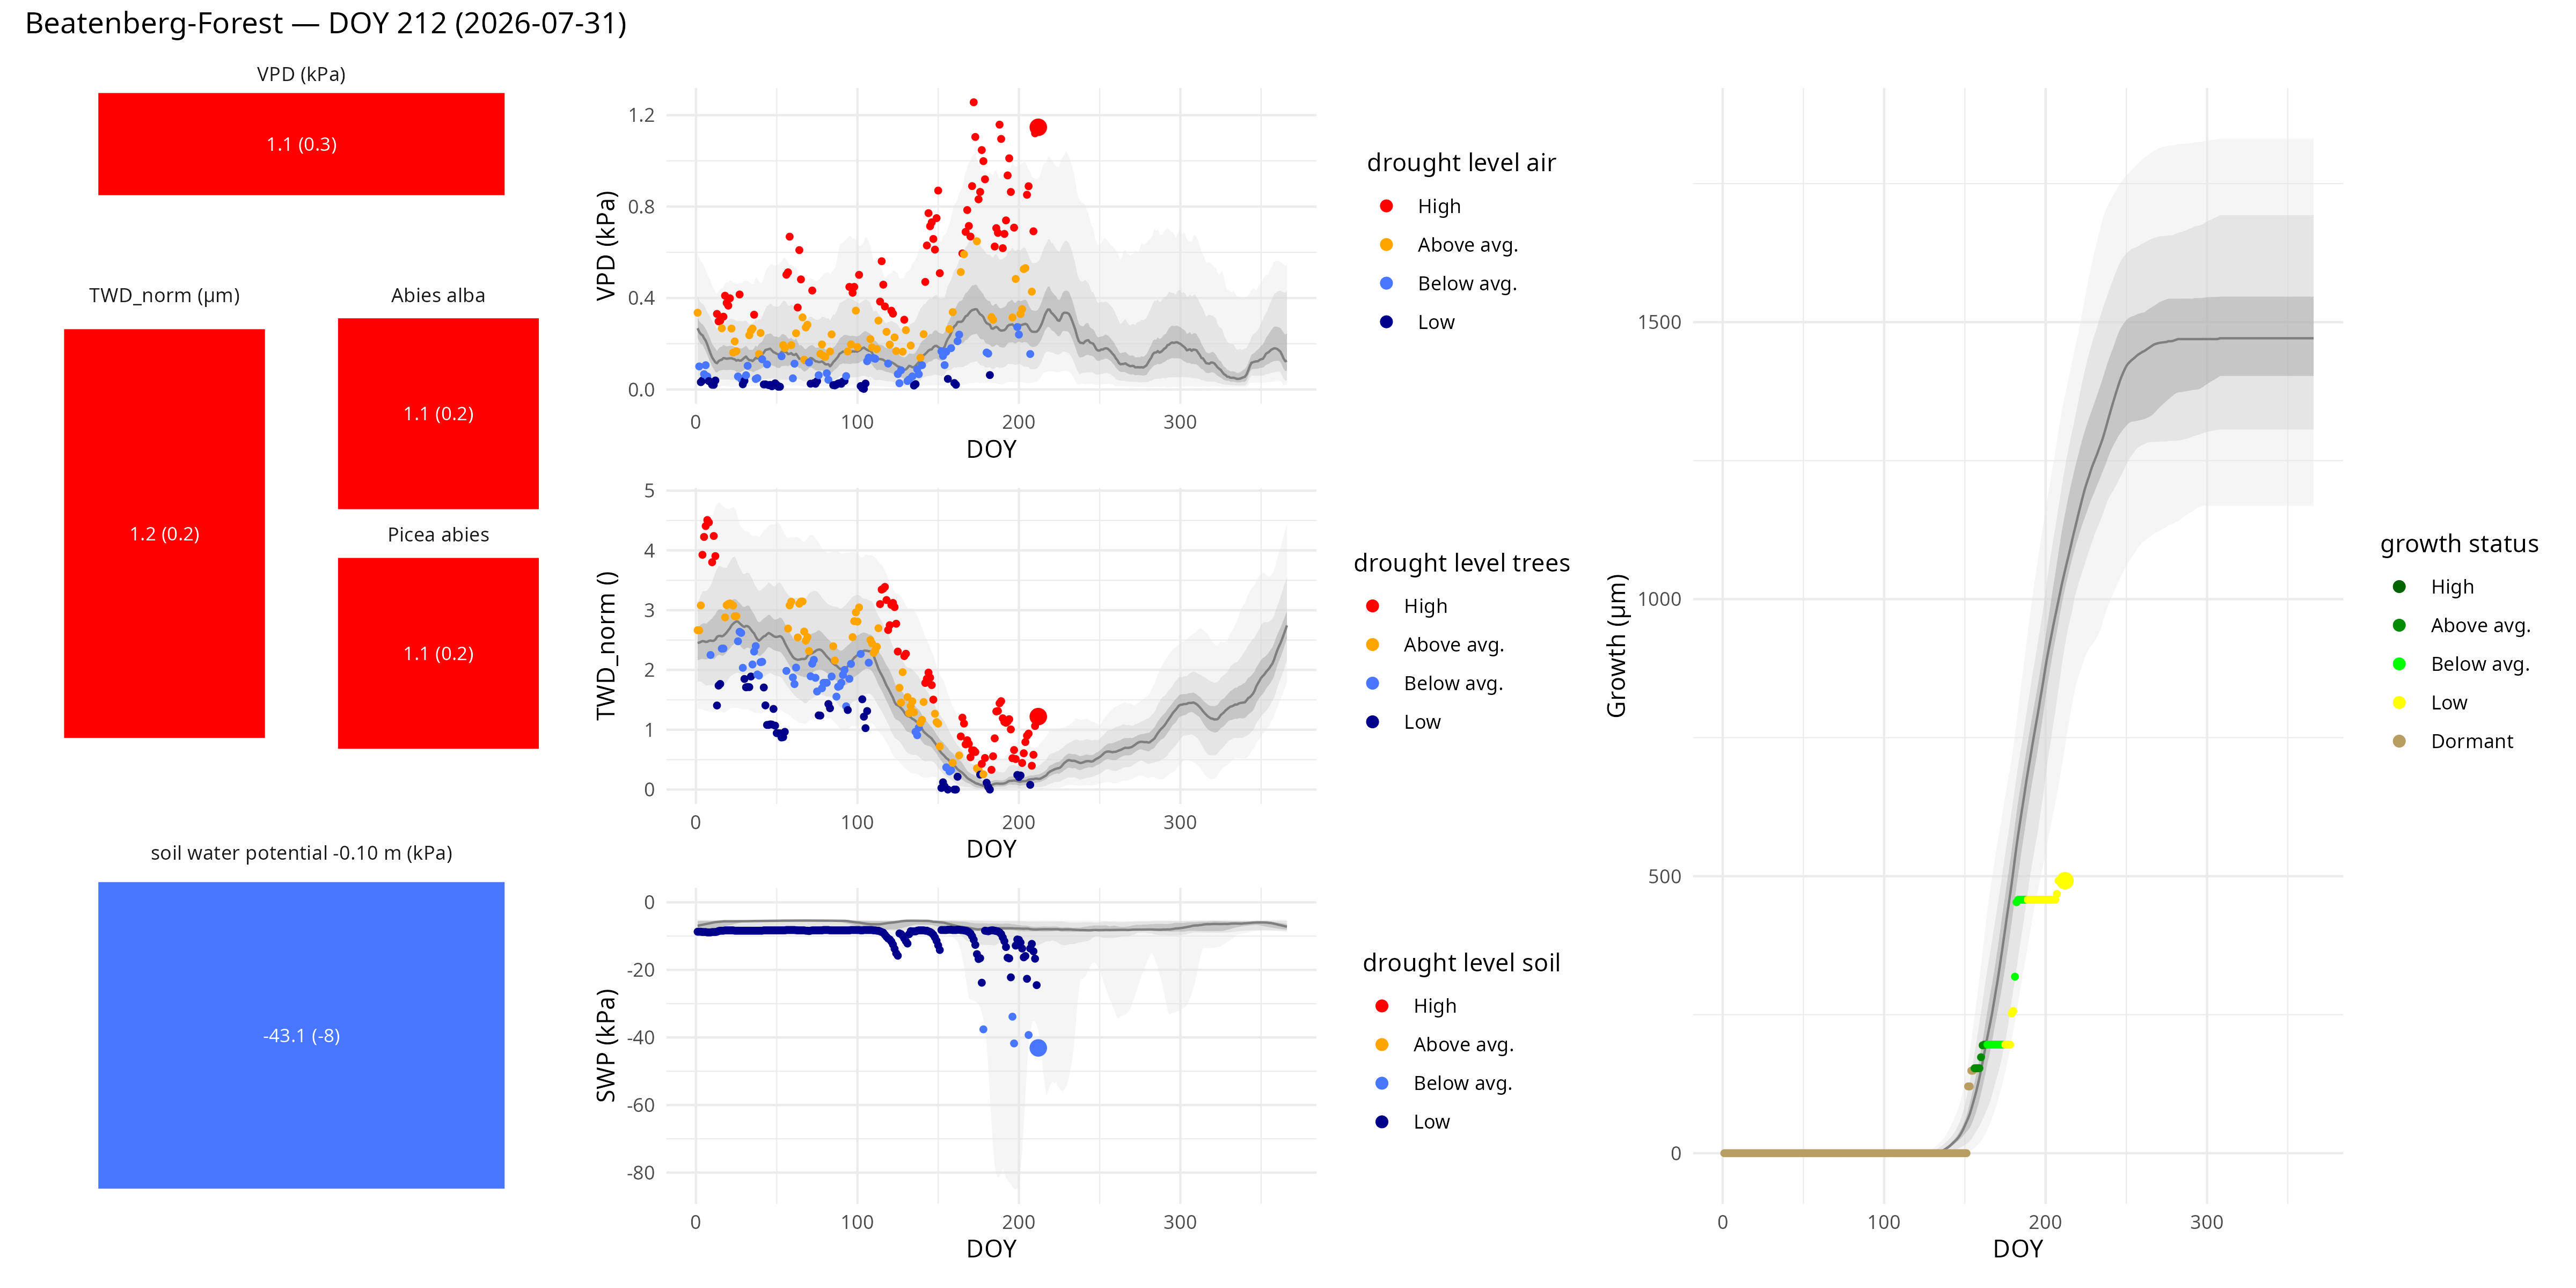
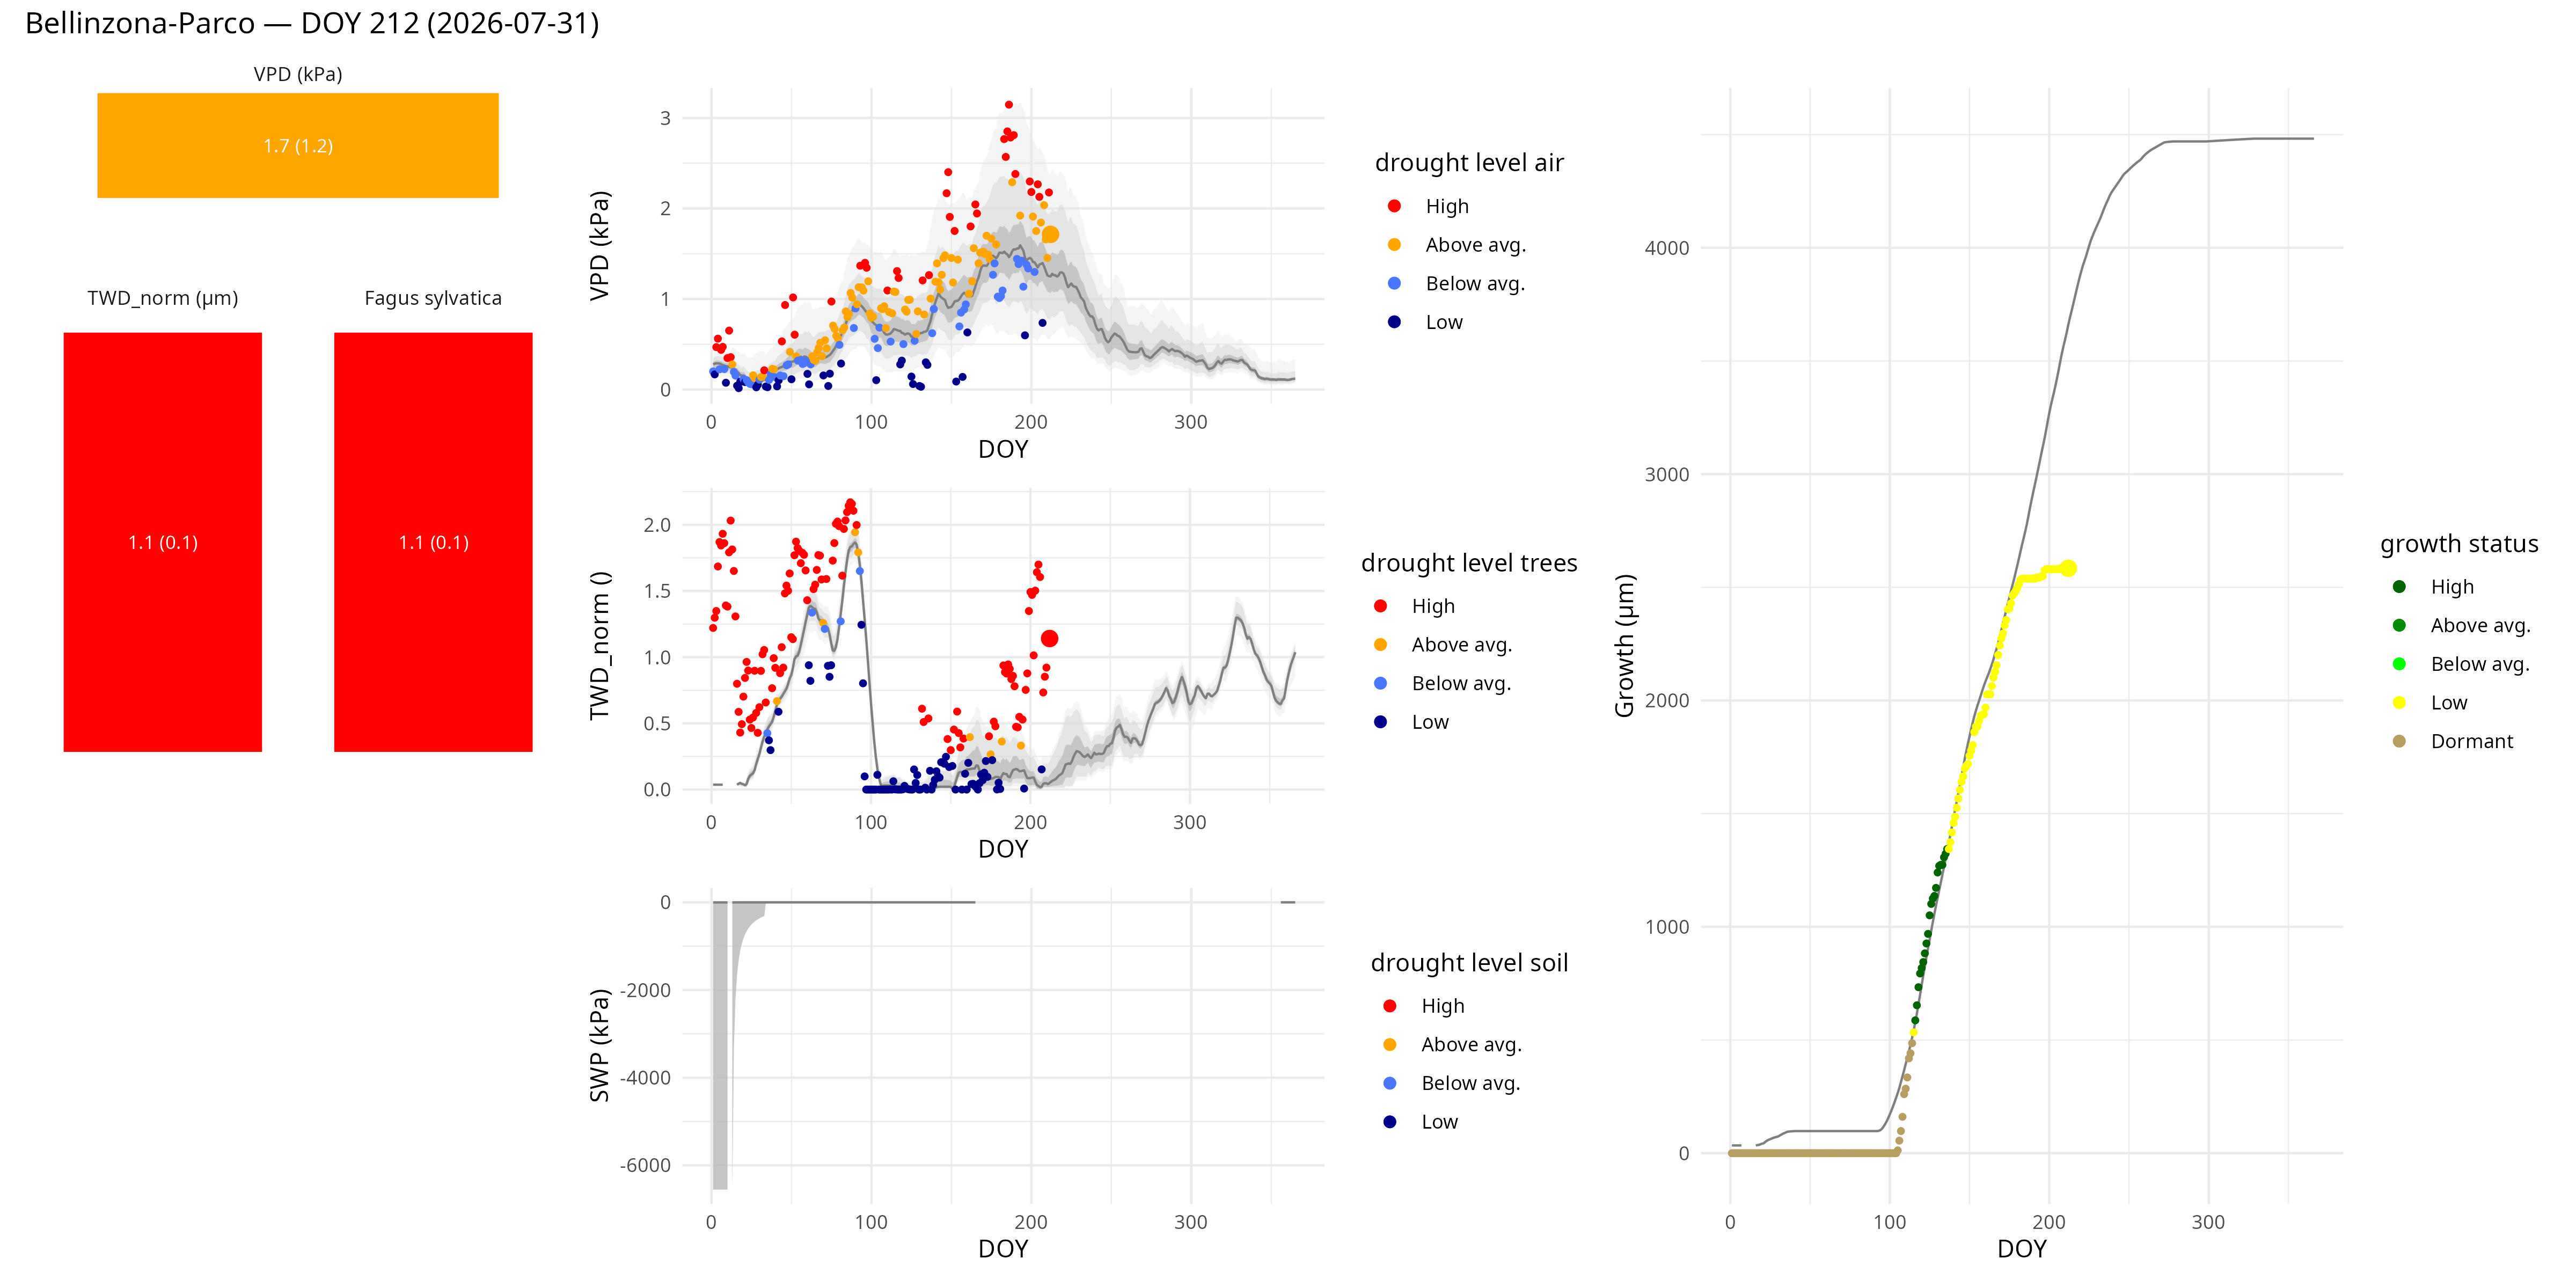
Left (stacks): Drought signals per site are displayed for up to three soil layers (bottom), for all trees pooled and for each species pooled per site (middle), and for the air (top). The colors indicate the intensity of drought stress on the current day compared to historical data, ranging from dark blue (no drought stress) to red (high drought stress). The numbers indicate the measured values in the respective unit.

Middle (time series): Seasonal progression of average soil water potential SWP (bottom), average tree water deficit TWD_norm (middle), and vapor pressure deficit VPD (top). Color coding as for the stacks.

Right (time series): Seasonal progression of average cumulative stem growth of the site. The color coding ranges from yellow (no/low growth) to dark green (high growth) and indicates the relative growth performance compared to historical data.

Data source: TreeNet, automatic data analysis with filtered data set.
Beatenberg Forest

Bellinzona Parco

Bern Drakau

Bern Thormebodewald

Birmensdorf Forest

Birmensdorf Orchard

Bueren Forest

Bursins Forest

Chippis East

Chippis Hilltop

Choeliacher Orchard

Copera Forest

Davos Seehornwald

Genolier Forest

Giswil Leihubelwald

Giswil Riedmatt

Grosswangen Forest

Hoelstein Forest

Hohtenn-Gampel Forest

Jussy Forest

Laegeren FF

Laegeren Hut

Lausanne Forest

Lens Forest

Loetschental N08

Loetschental N13D

Loetschental N13W

Loetschental S16

Loetschental S19

Loetschental S22

Marthalen Winzlerboden

Neunkirch North

Neunkirch Southeast

Neunkirch Southwest

Novaggio Forest

Pfynwald Control

Pfynwald Irrigation

Pfynwald Irrigation VPD

Pfynwald Irrigation Stop

Pfynwald Roof

Pfynwald Roof VPD

Pfynwald Illgraben Northwest

Riehen Forest

Sagno SW

Saillon A780

Saillon A860

Salgesch Control

Schaenis High

Schaenis Low

Schmitten Forest

Sempach Forest

Sihlwald Forest

Stillberg High

Stillberg Low

Surava North

Surava South

Tenna Forest Managed

Tenna Forest Old

Tenna Forest Old 3 1

Vetroz Forest

Visp Forest

Vordemwald Forest

Wangen Forest

Zuerich Zollstrasse

BLS

Naters-Top (Irrigated)

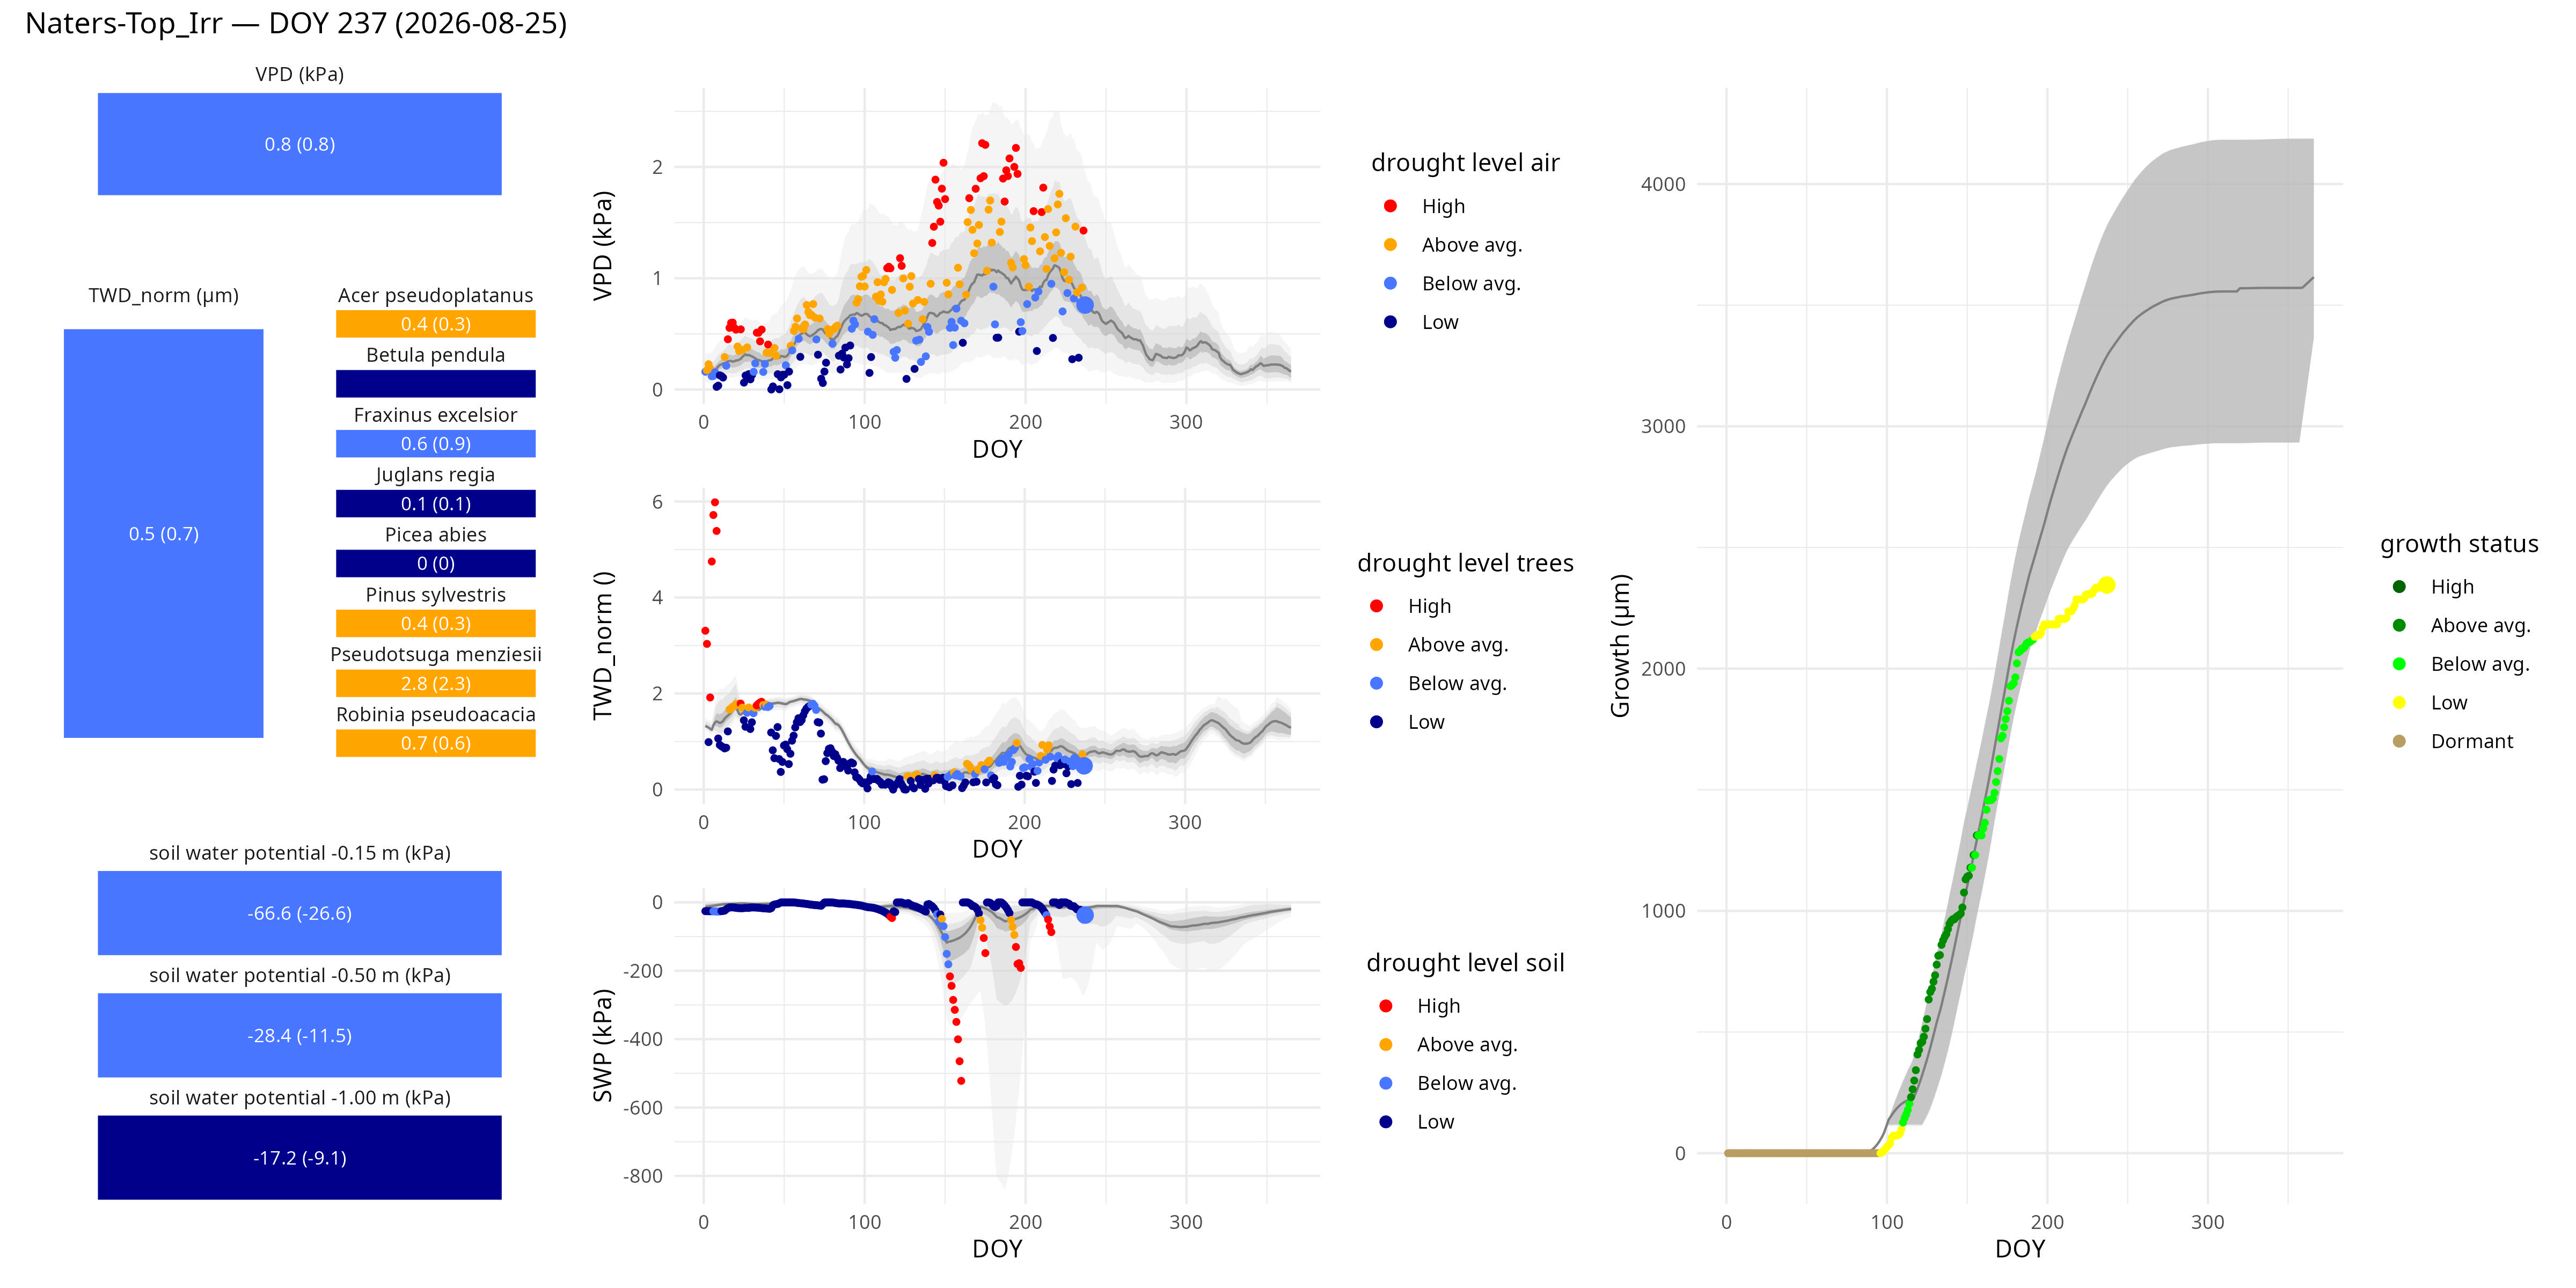
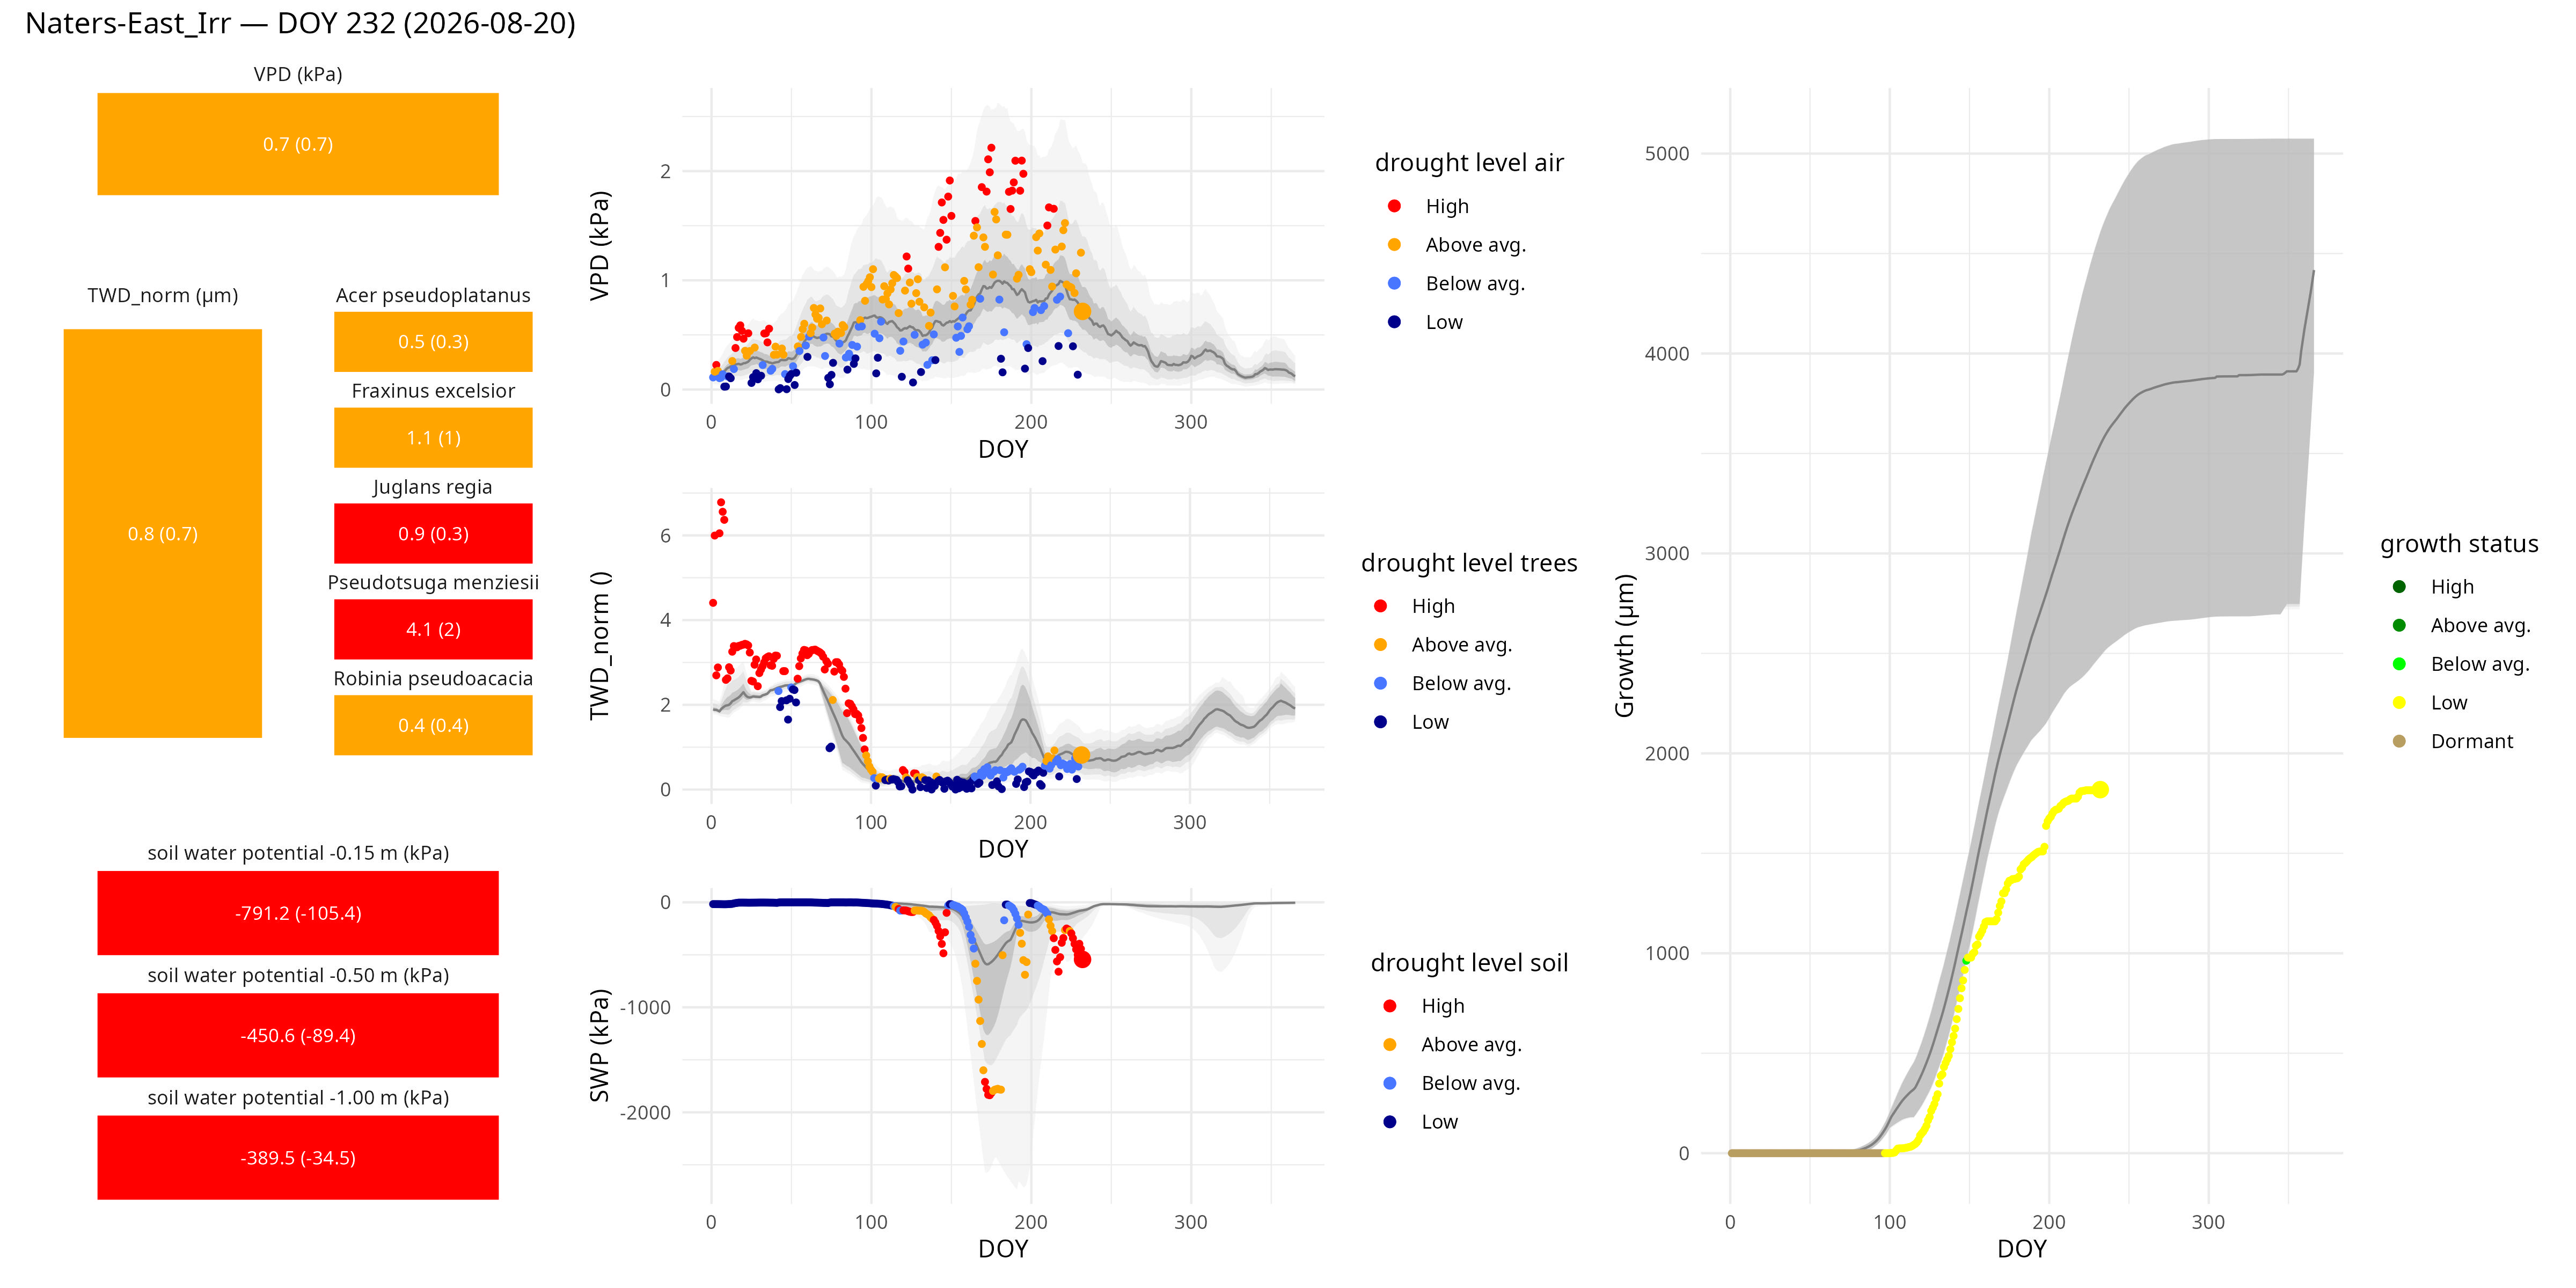
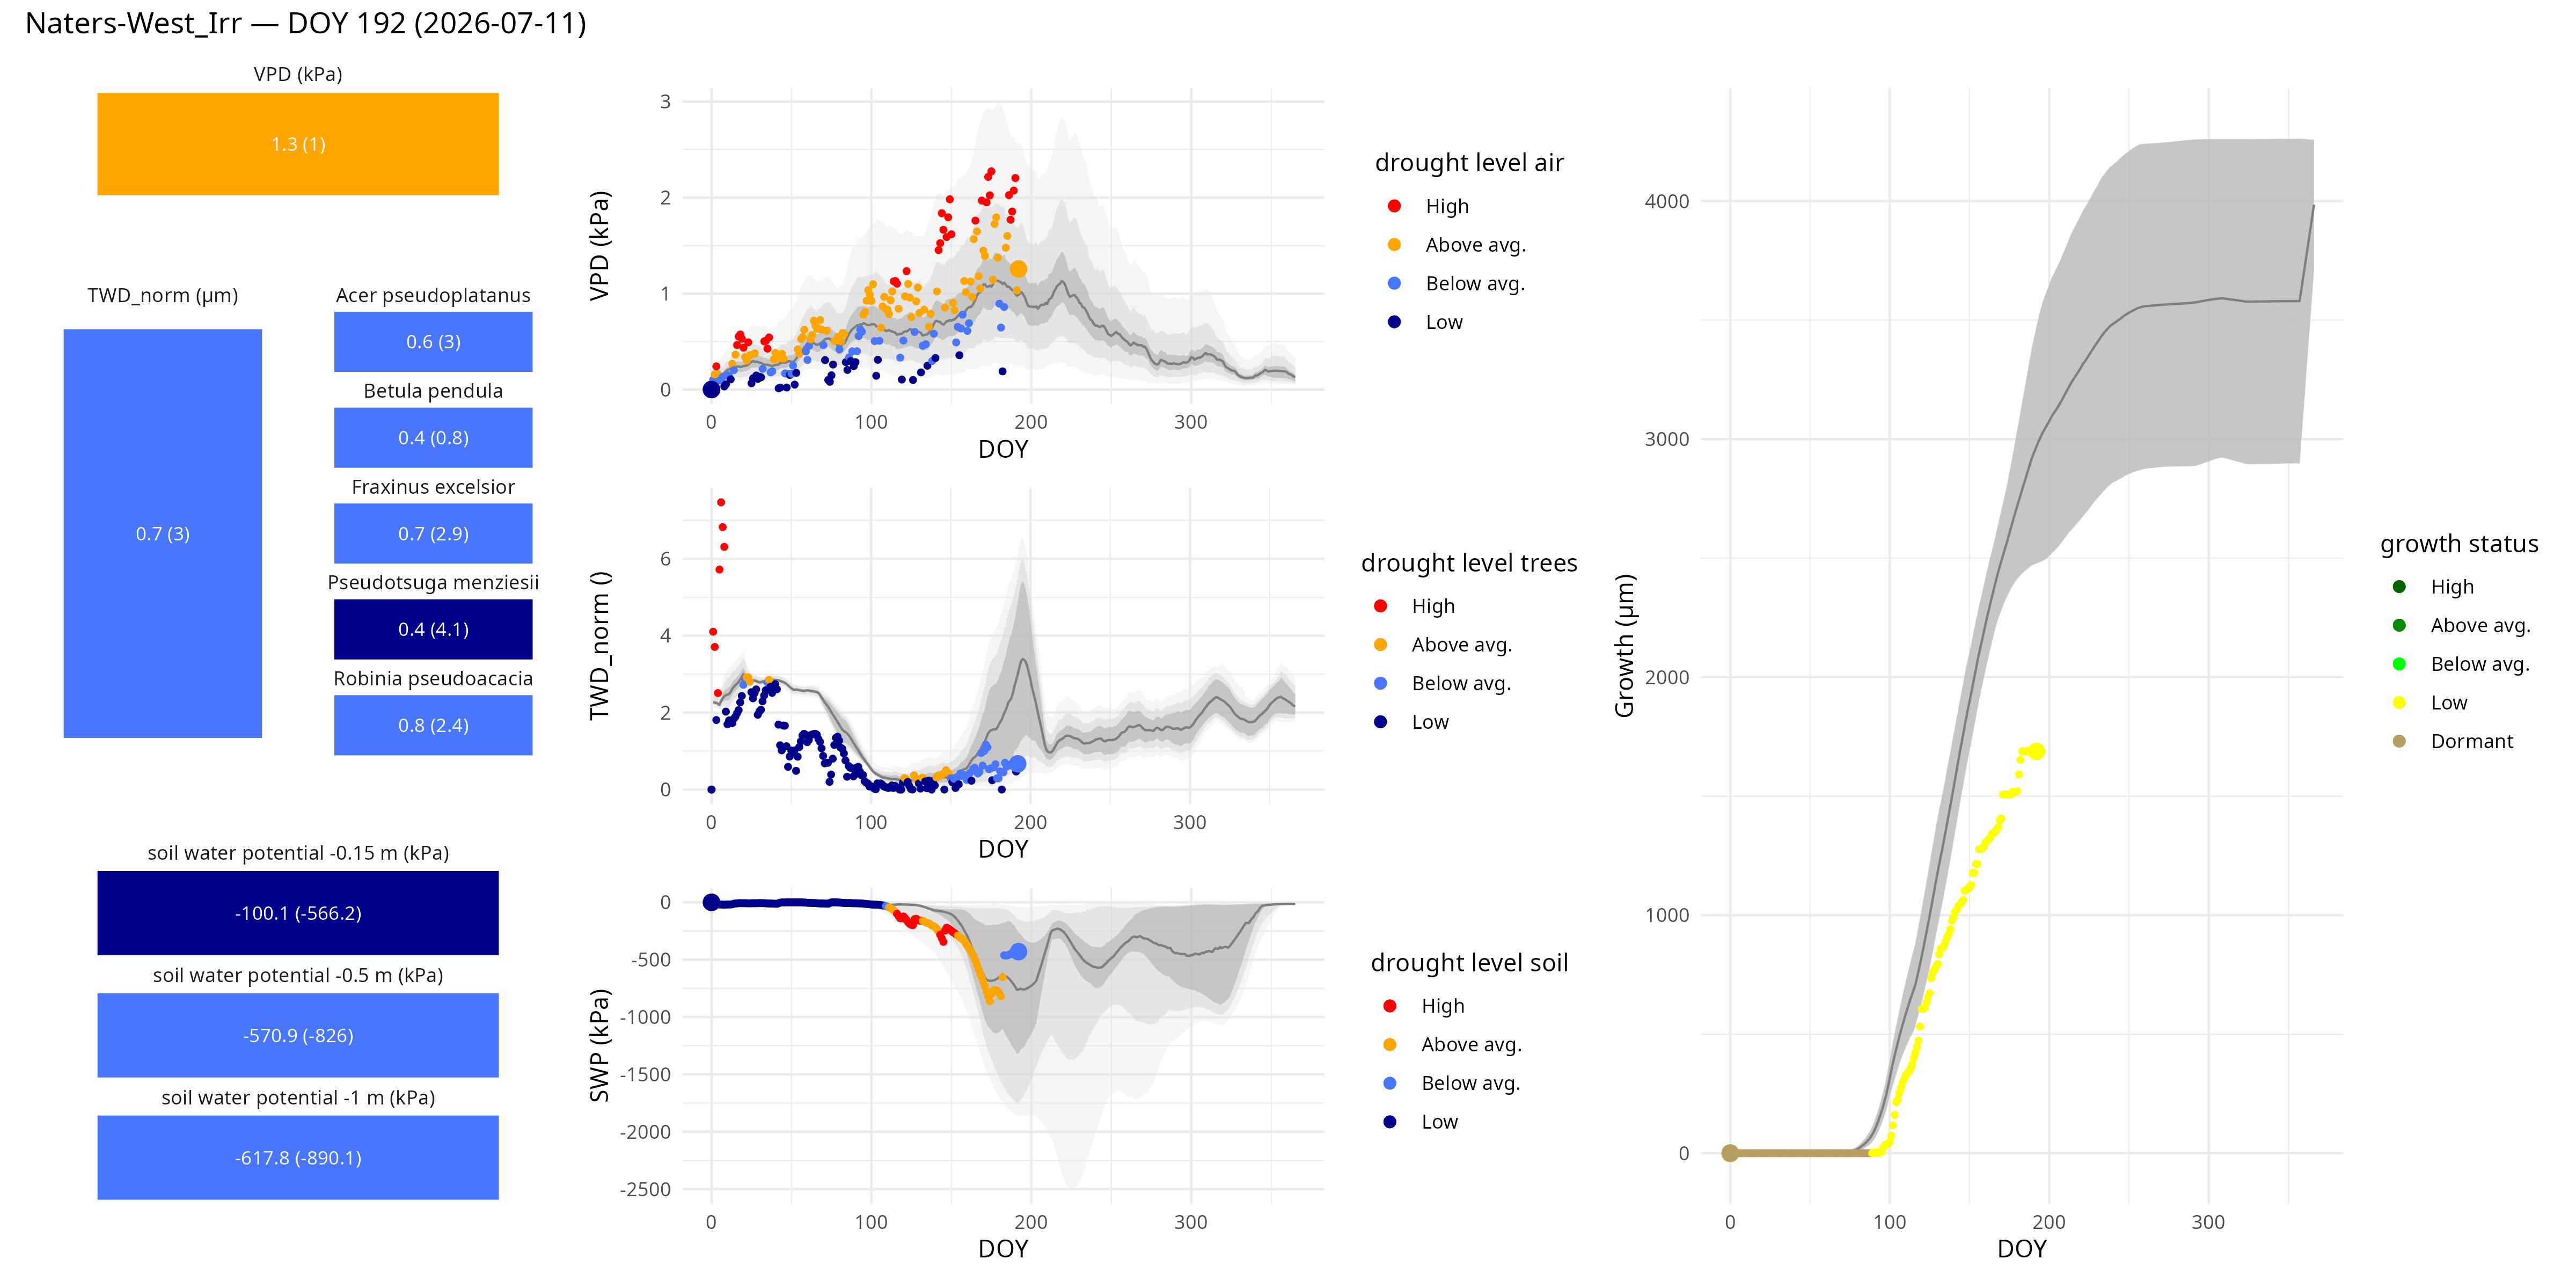
Left (stacks): Drought signals per site are displayed for up to three soil layers (bottom), for all trees pooled and for each species pooled per site (middle), and for the air (top). The colors indicate the intensity of drought stress on the current day compared to historical data, ranging from dark blue (no drought stress) to red (high drought stress). The numbers indicate the measured values in the respective unit.

Middle (time series): Seasonal progression of average soil water potential SWP (bottom), average tree water deficit TWD_norm (middle), and vapor pressure deficit VPD (top). Color coding as for the stacks.

Right (time series): Seasonal progression of average cumulative stem growth of the site. The color coding ranges from yellow (no/low growth) to dark green (high growth) and indicates the relative growth performance compared to historical data.

Data source: TreeNet, automatic data analysis with filtered data set.
Naters-East (Irrigated)

Naters-West (Irrigated)

Mund-Top (Irrigated)

Mund-East (Irrigated)

Mund-West (Irrigated)

Mund-Dry

TreeNet Switzerland collects continuous data on stem radius fluctuations measured with point dendrometers from trees all over Switzerland and estimates drought and growth indicators for Swiss forest ecosystems. We closely collaborate with the Long-term Forest Ecosystem Research Programme (LWF/WSL), the ETHZ, the Institute for Applied Plant Biology (IAP), and the University of Basel.