All species
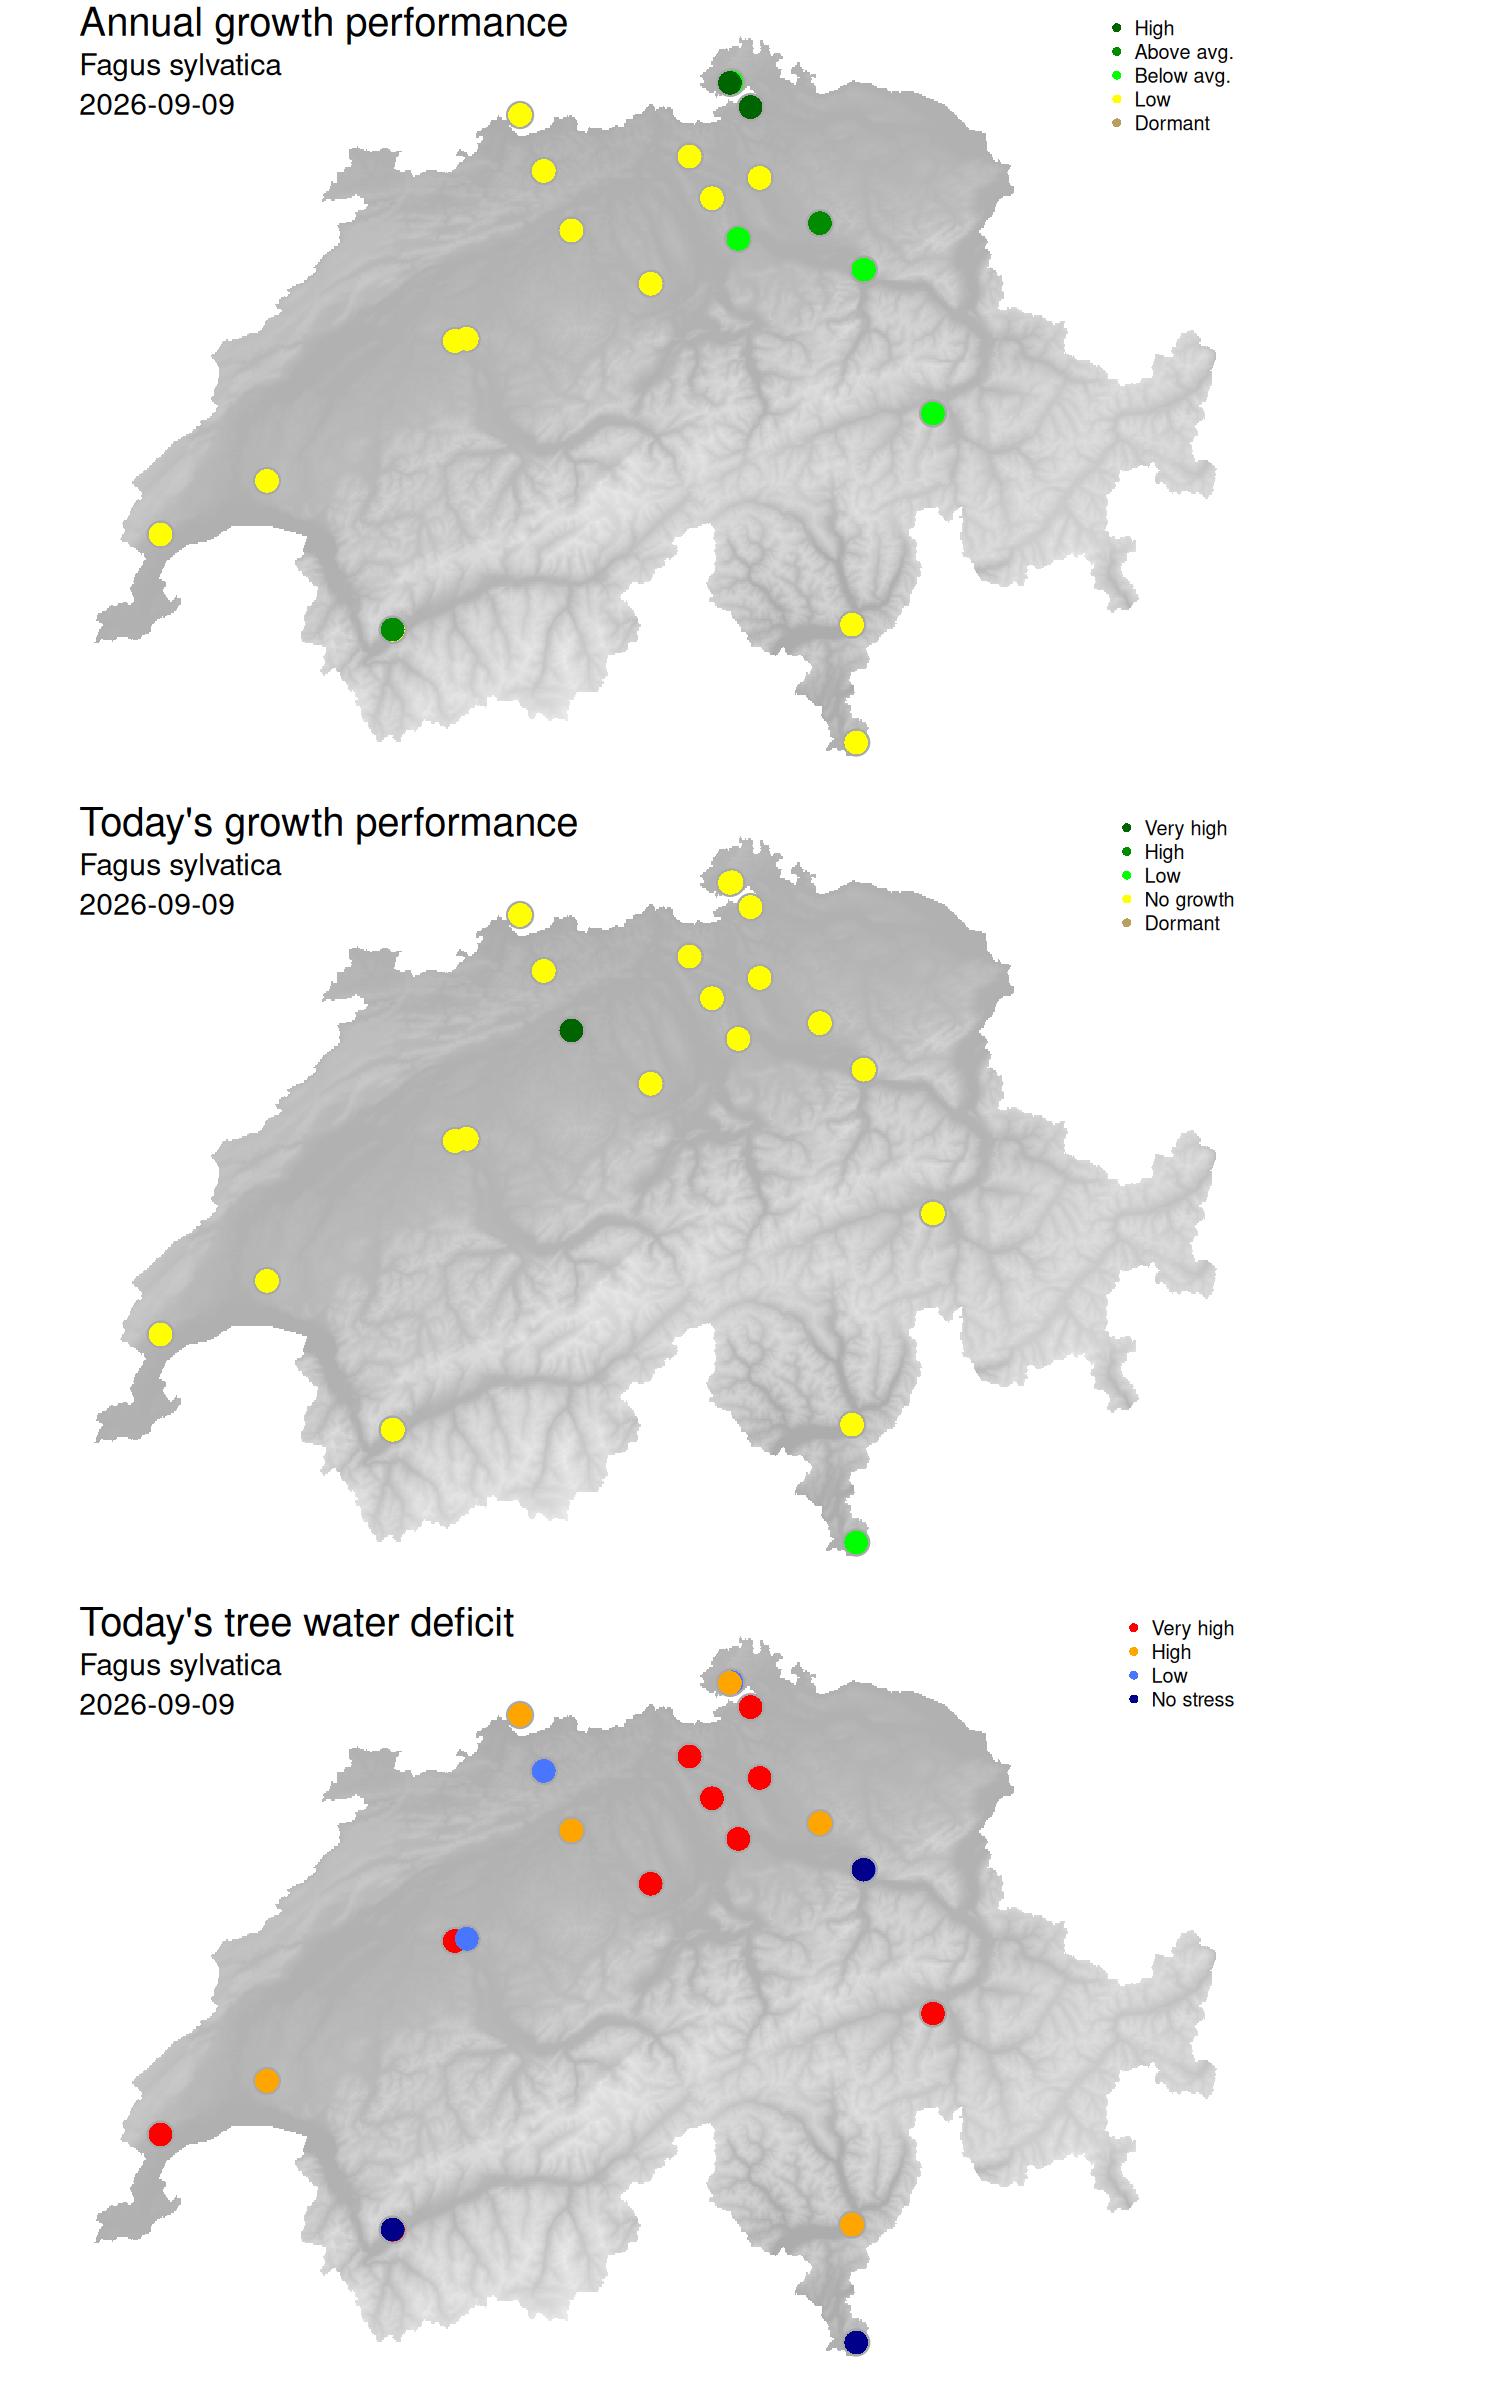
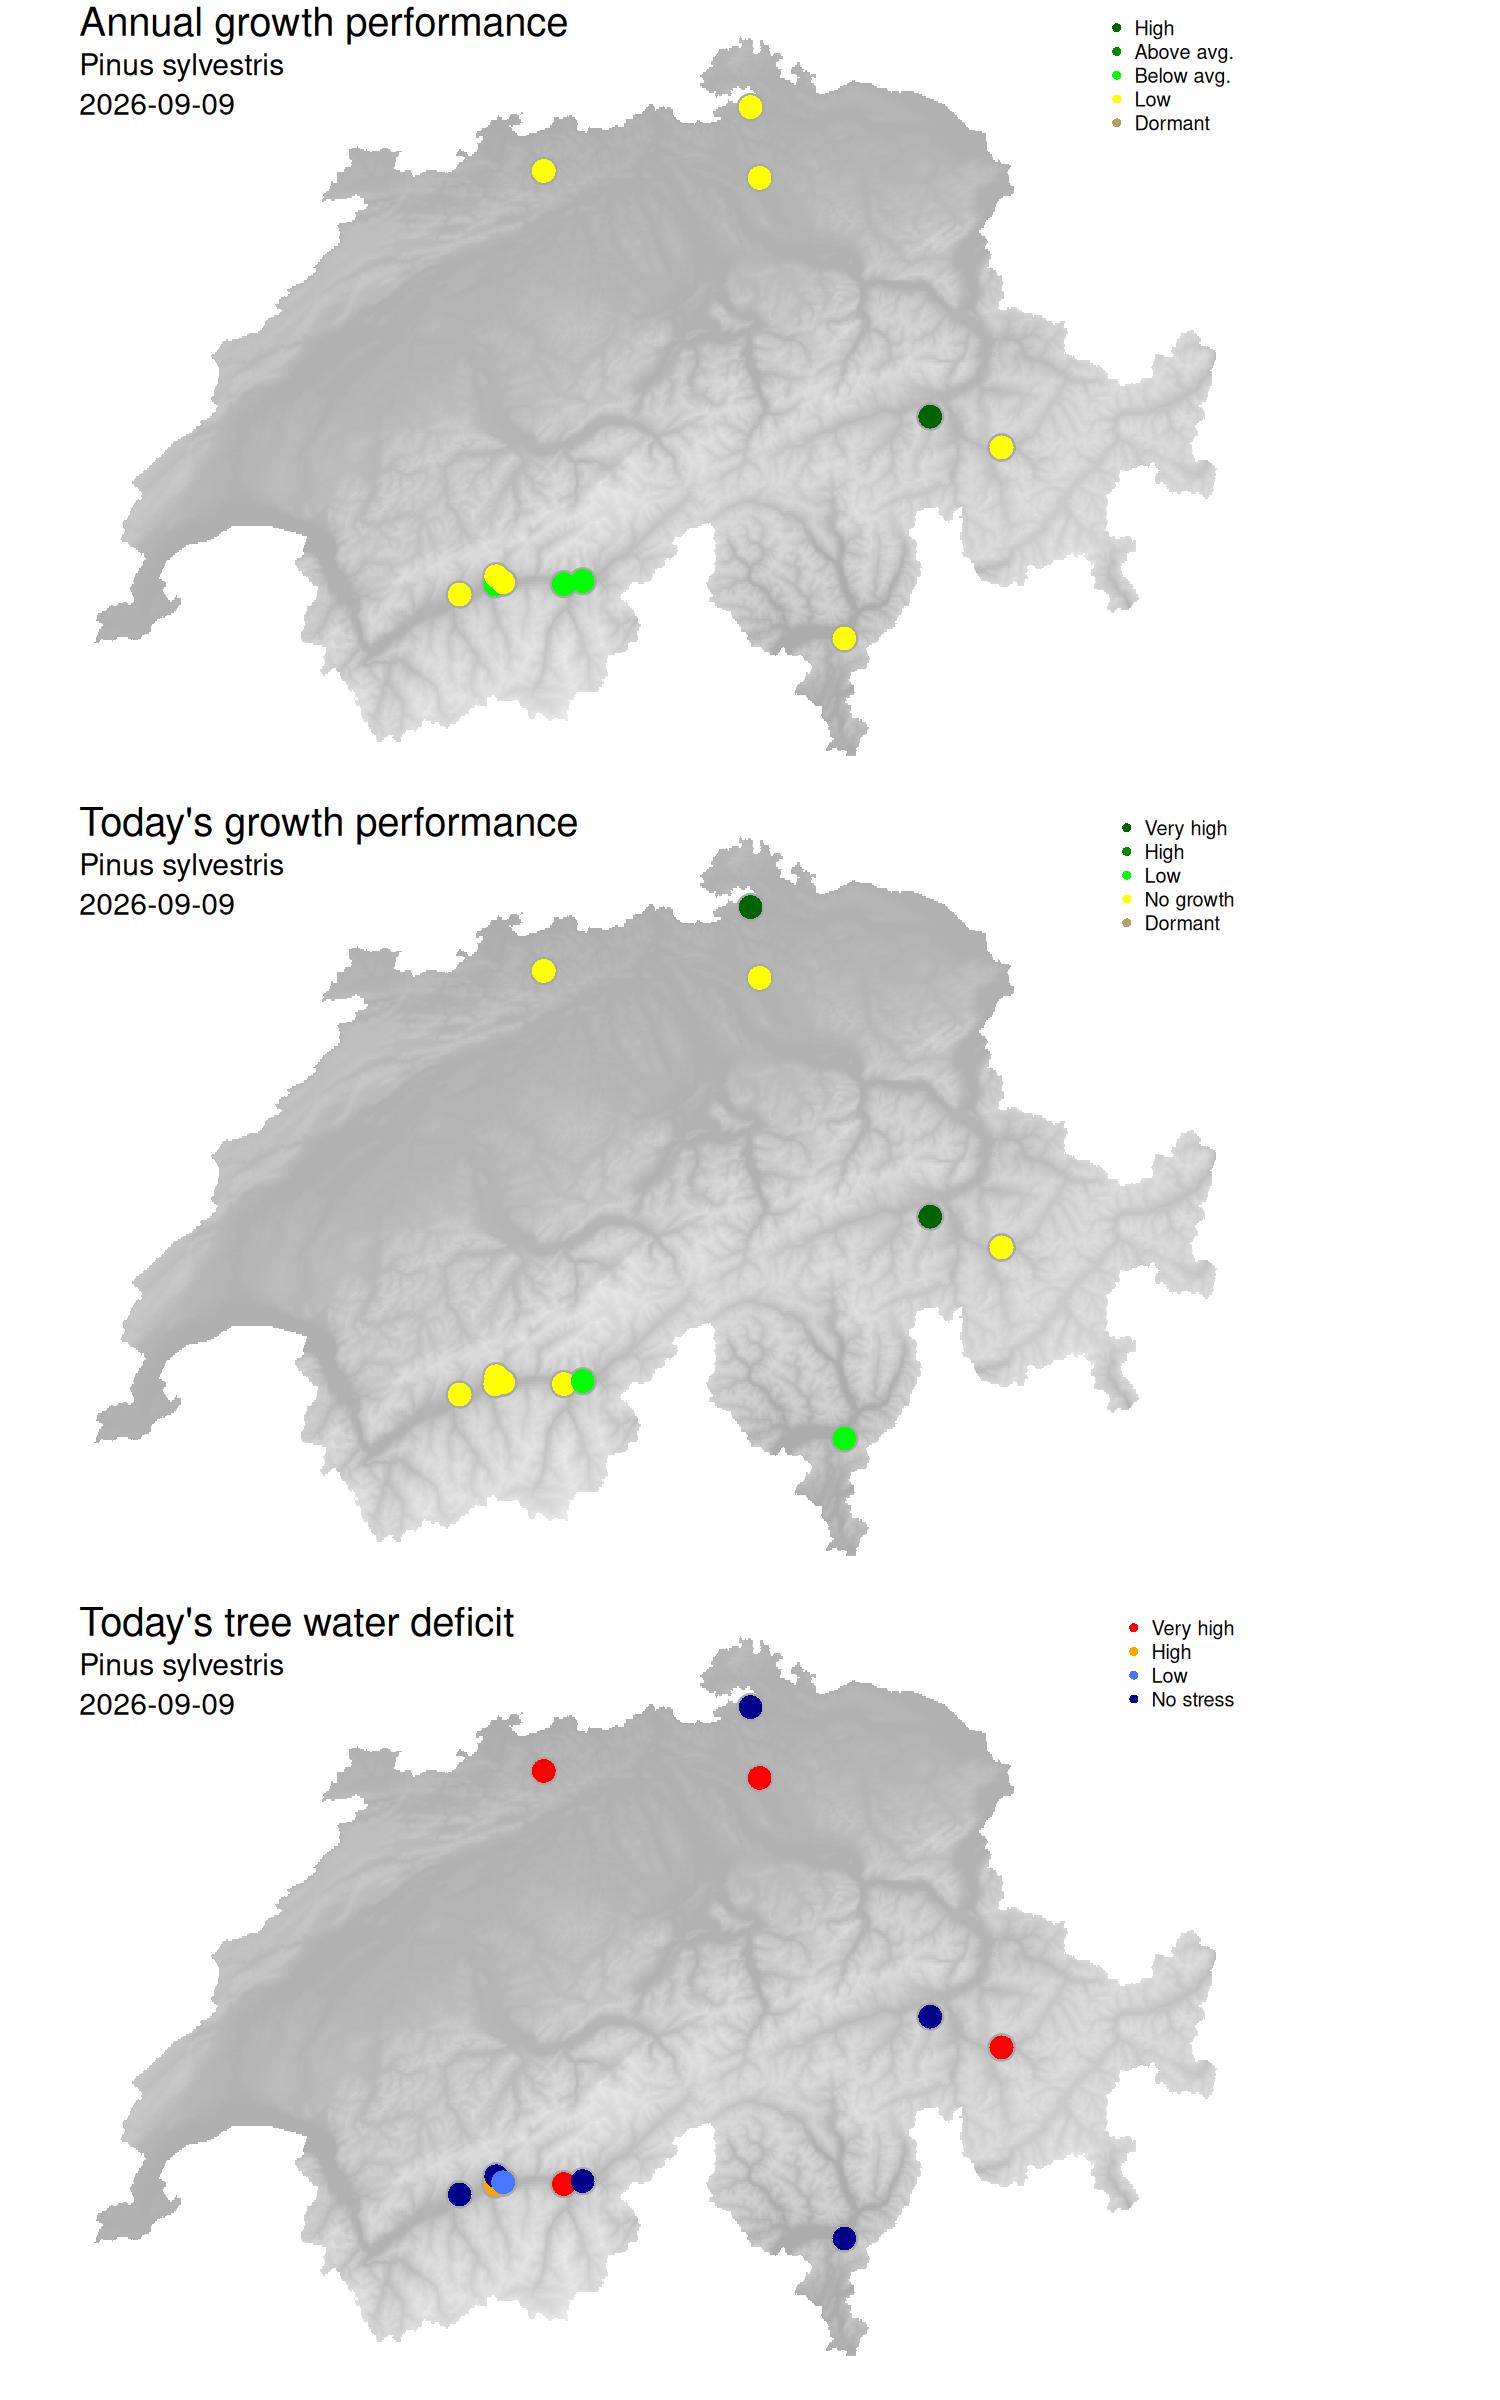
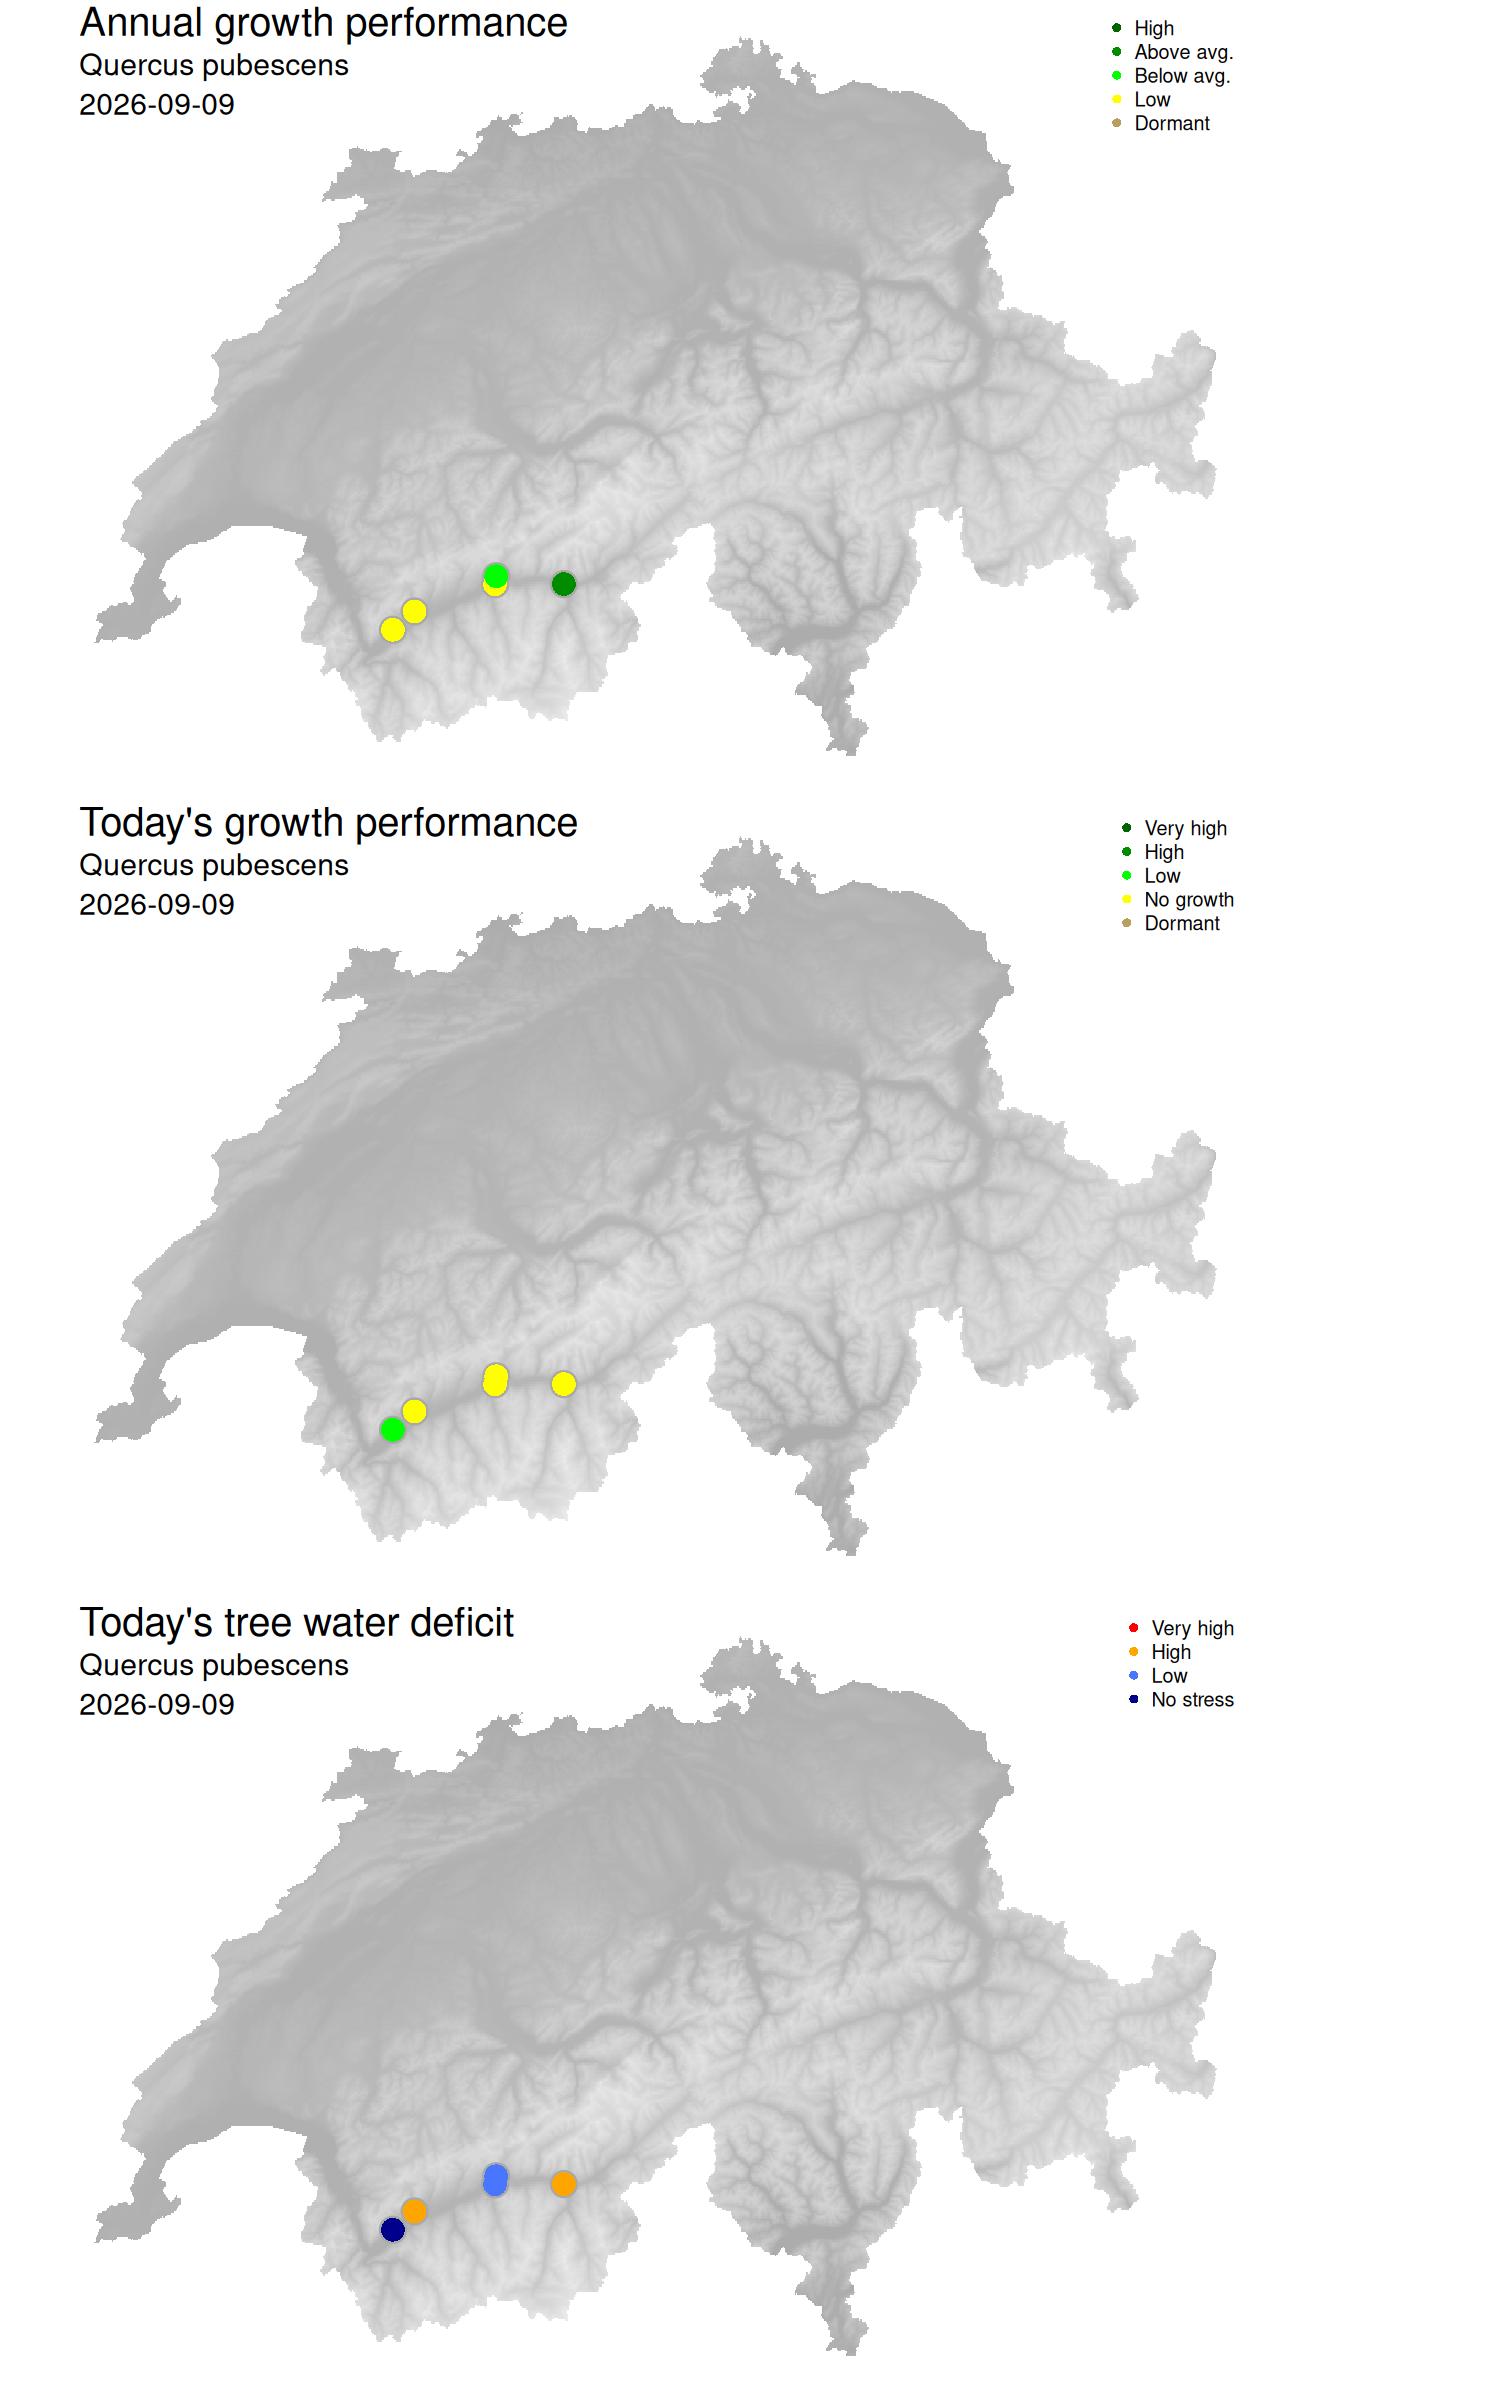
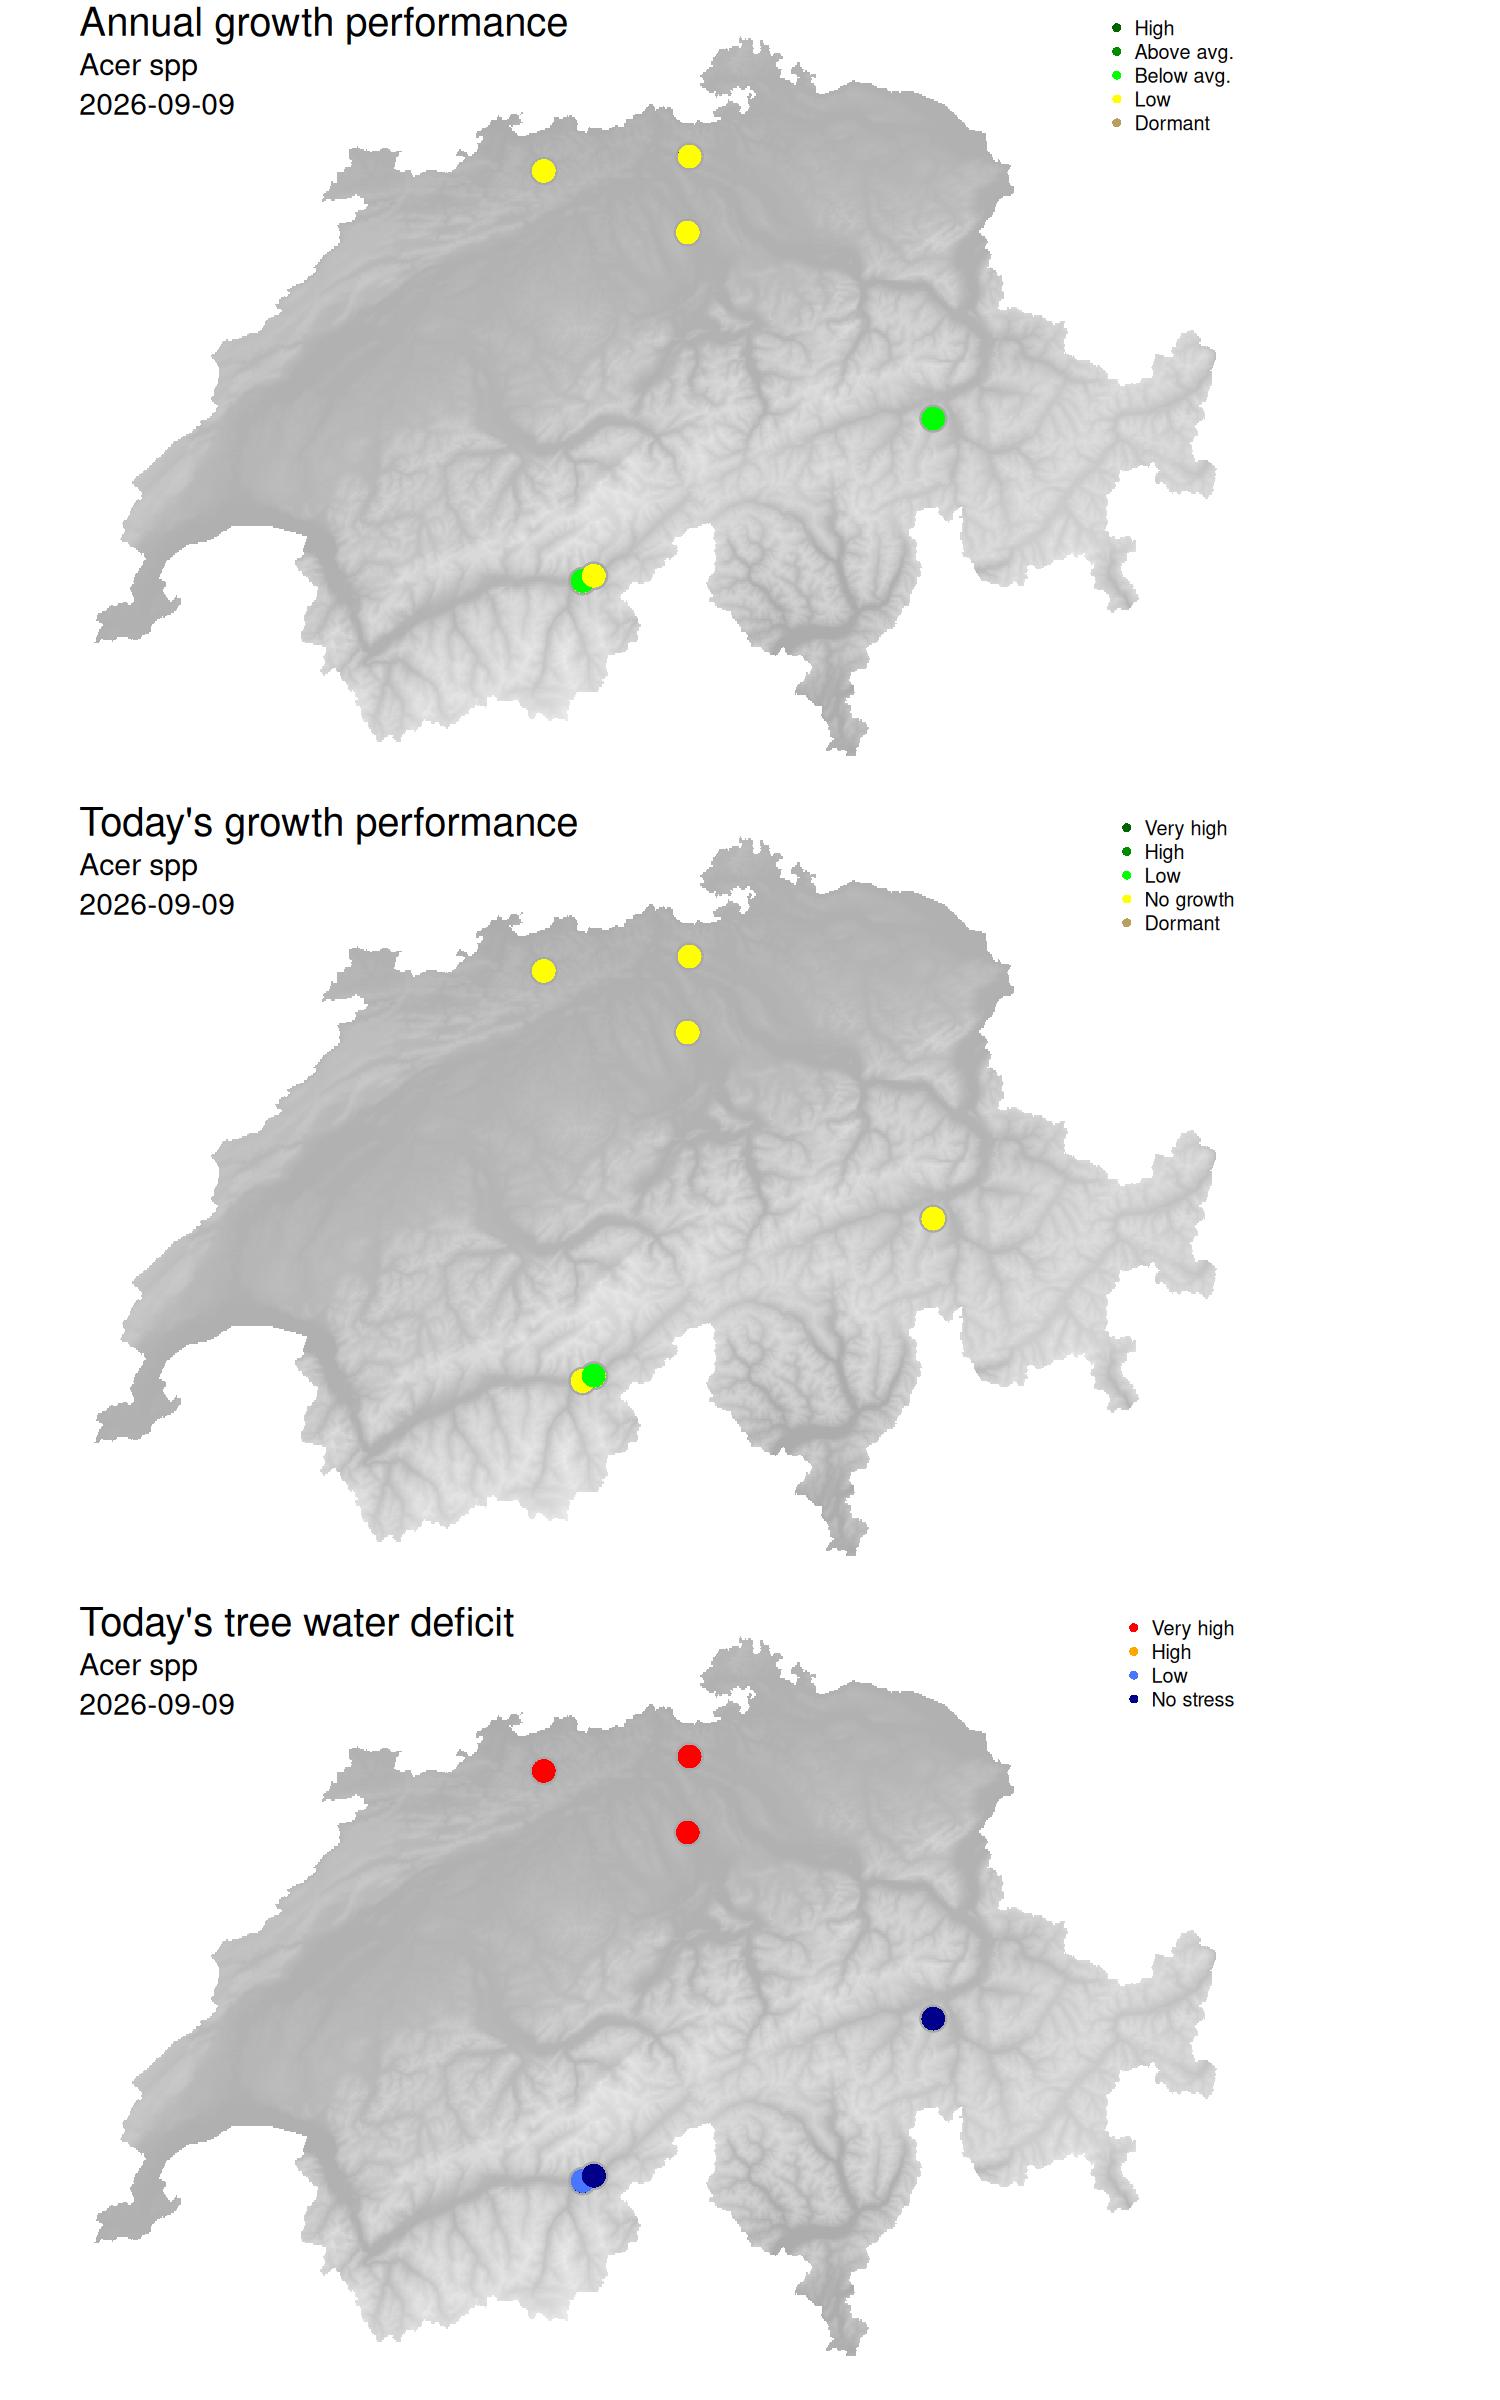
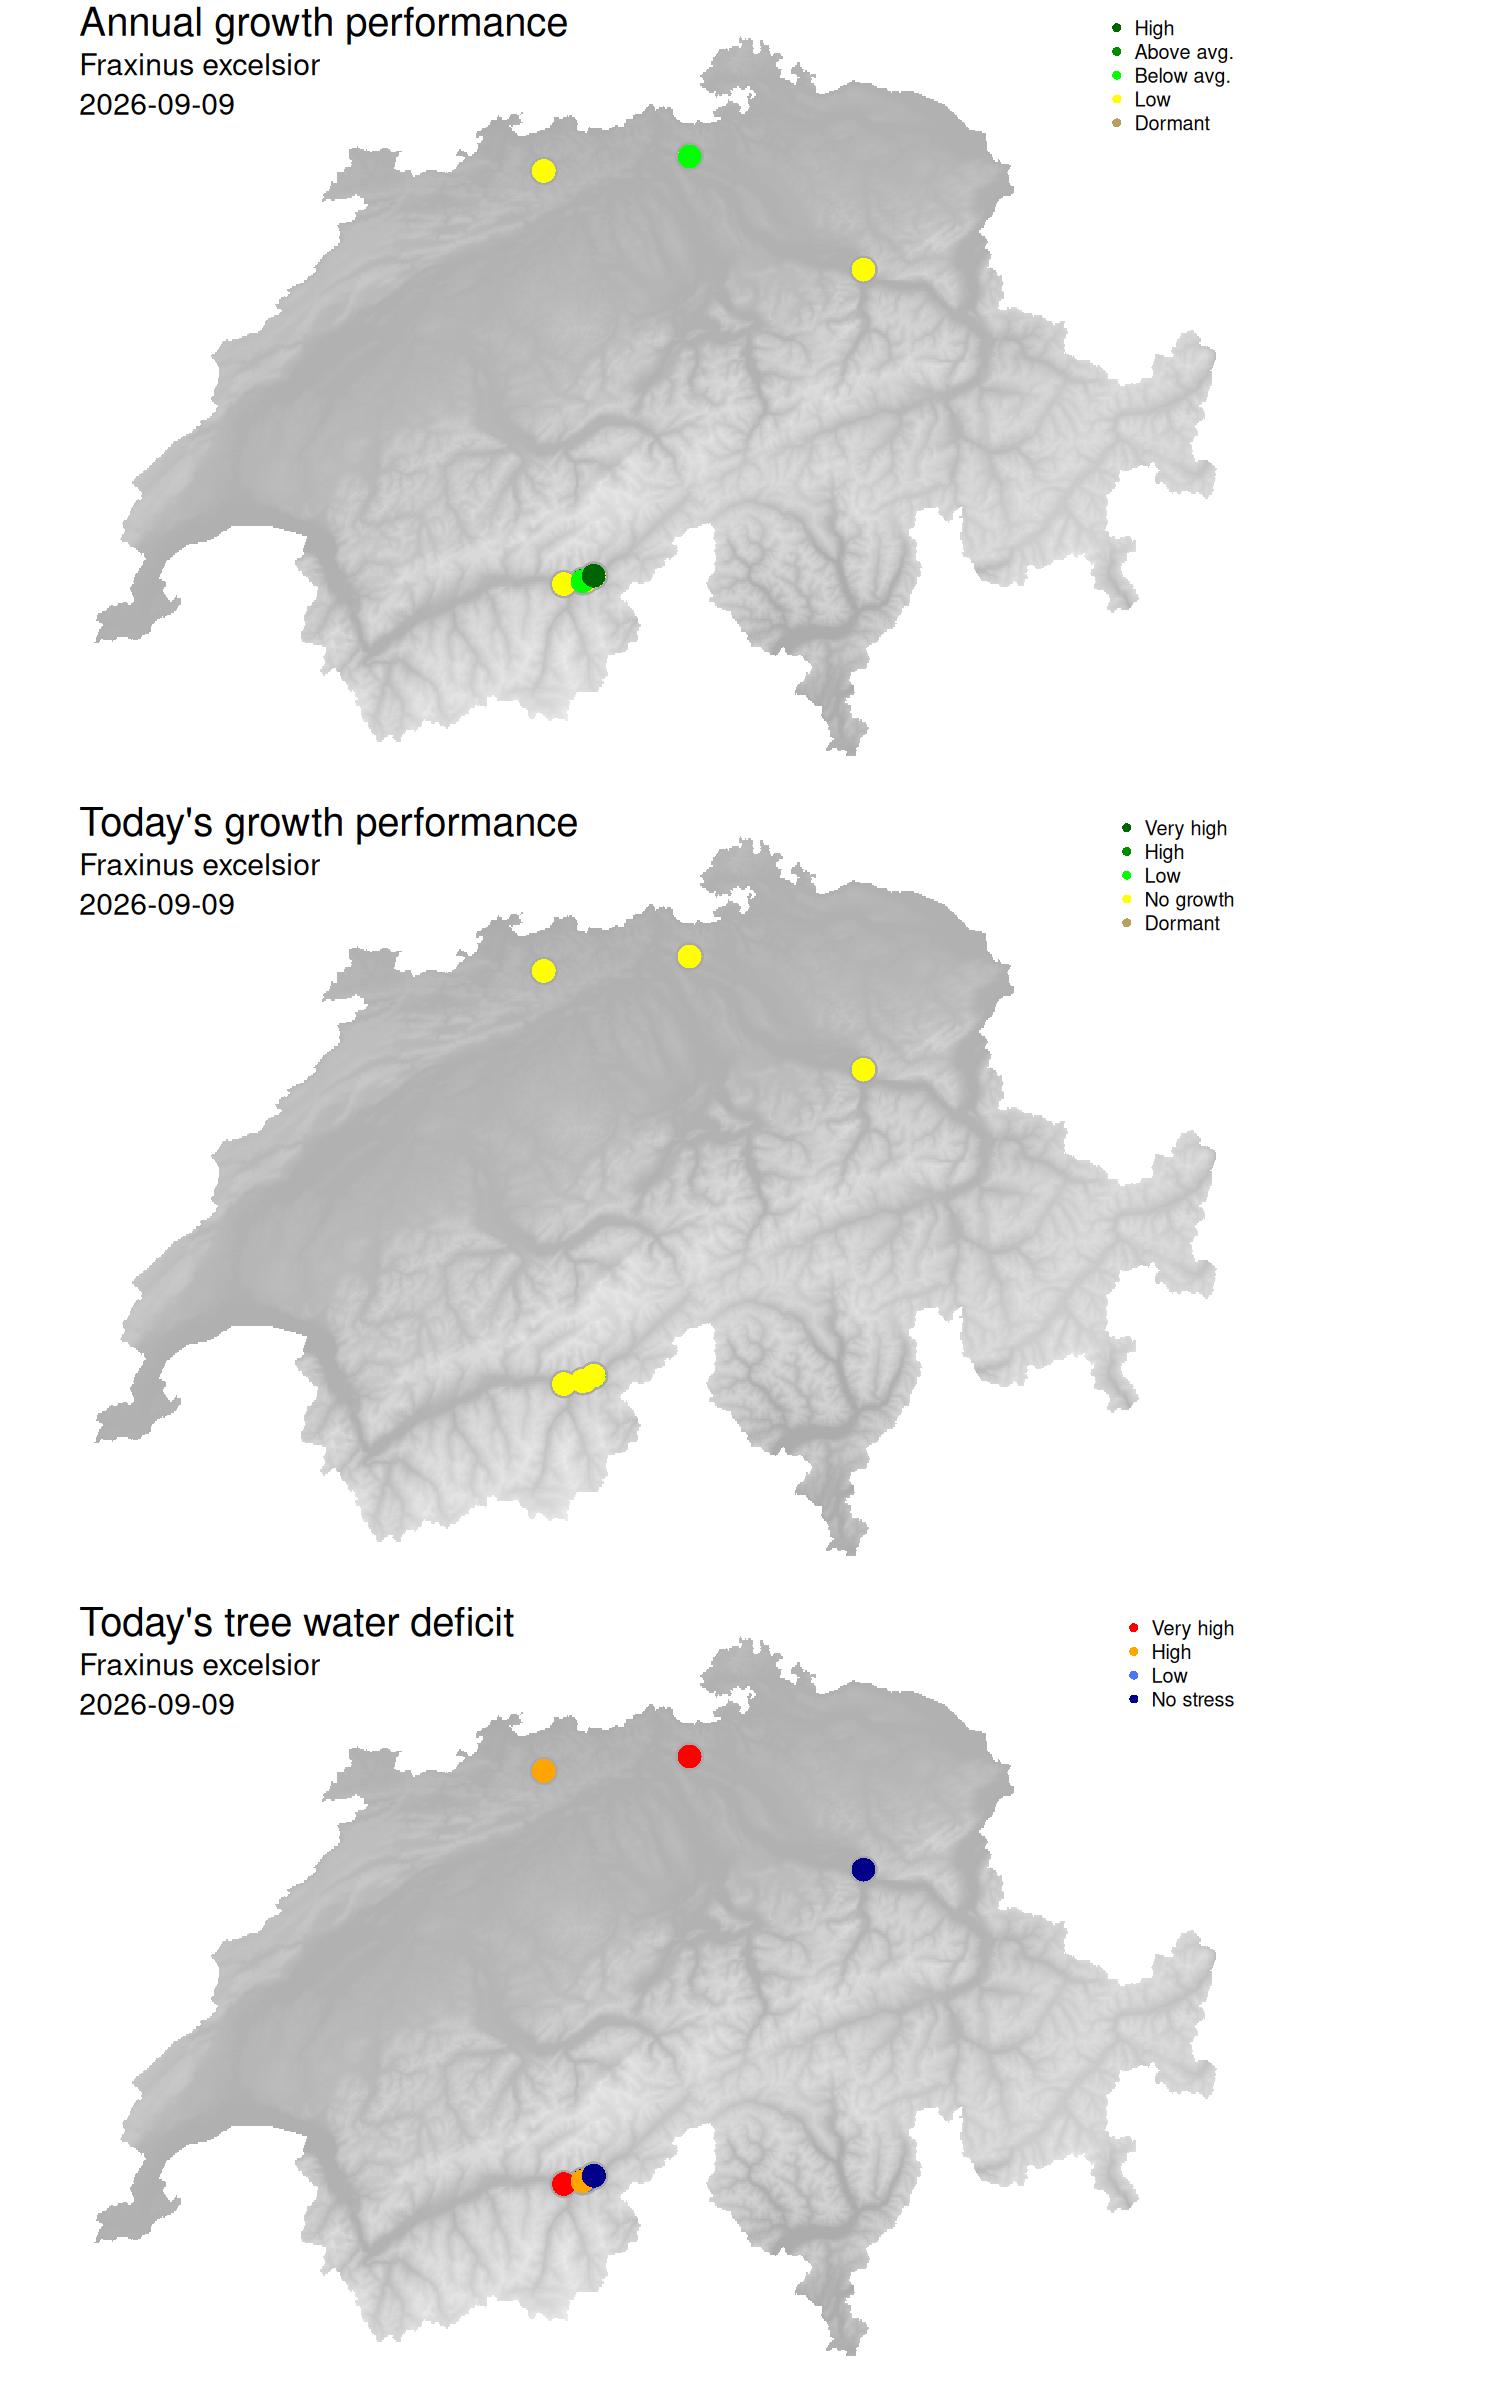
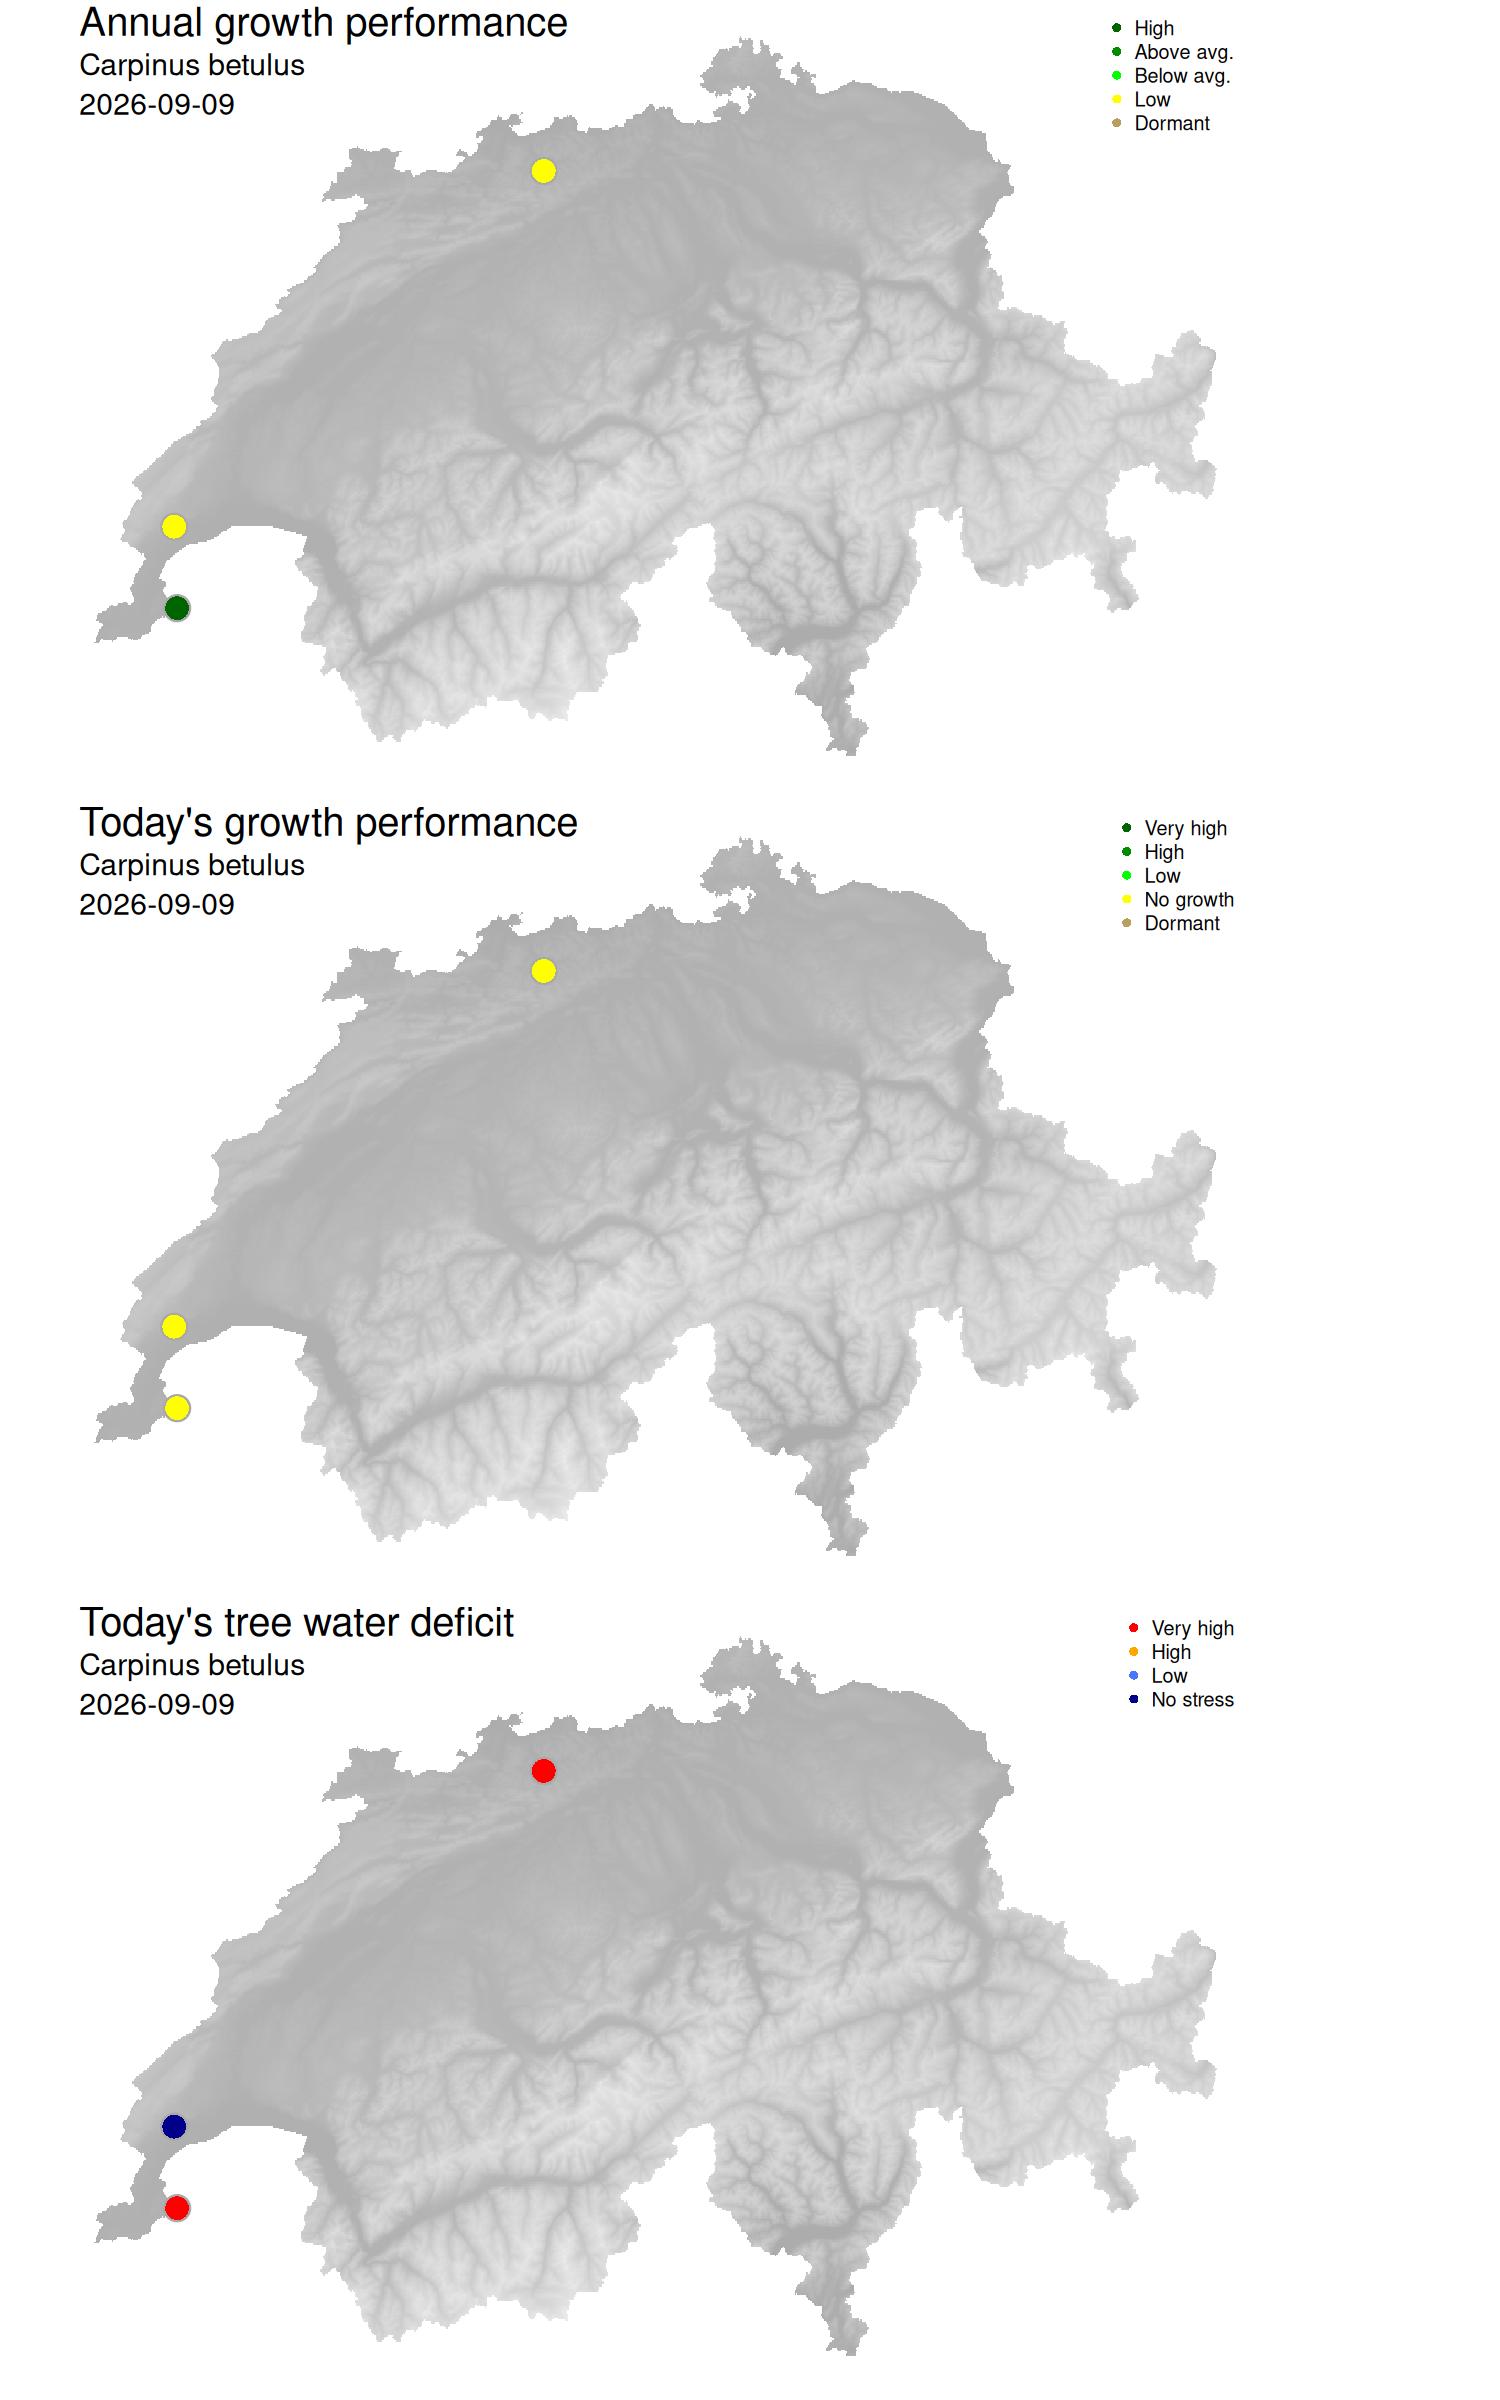
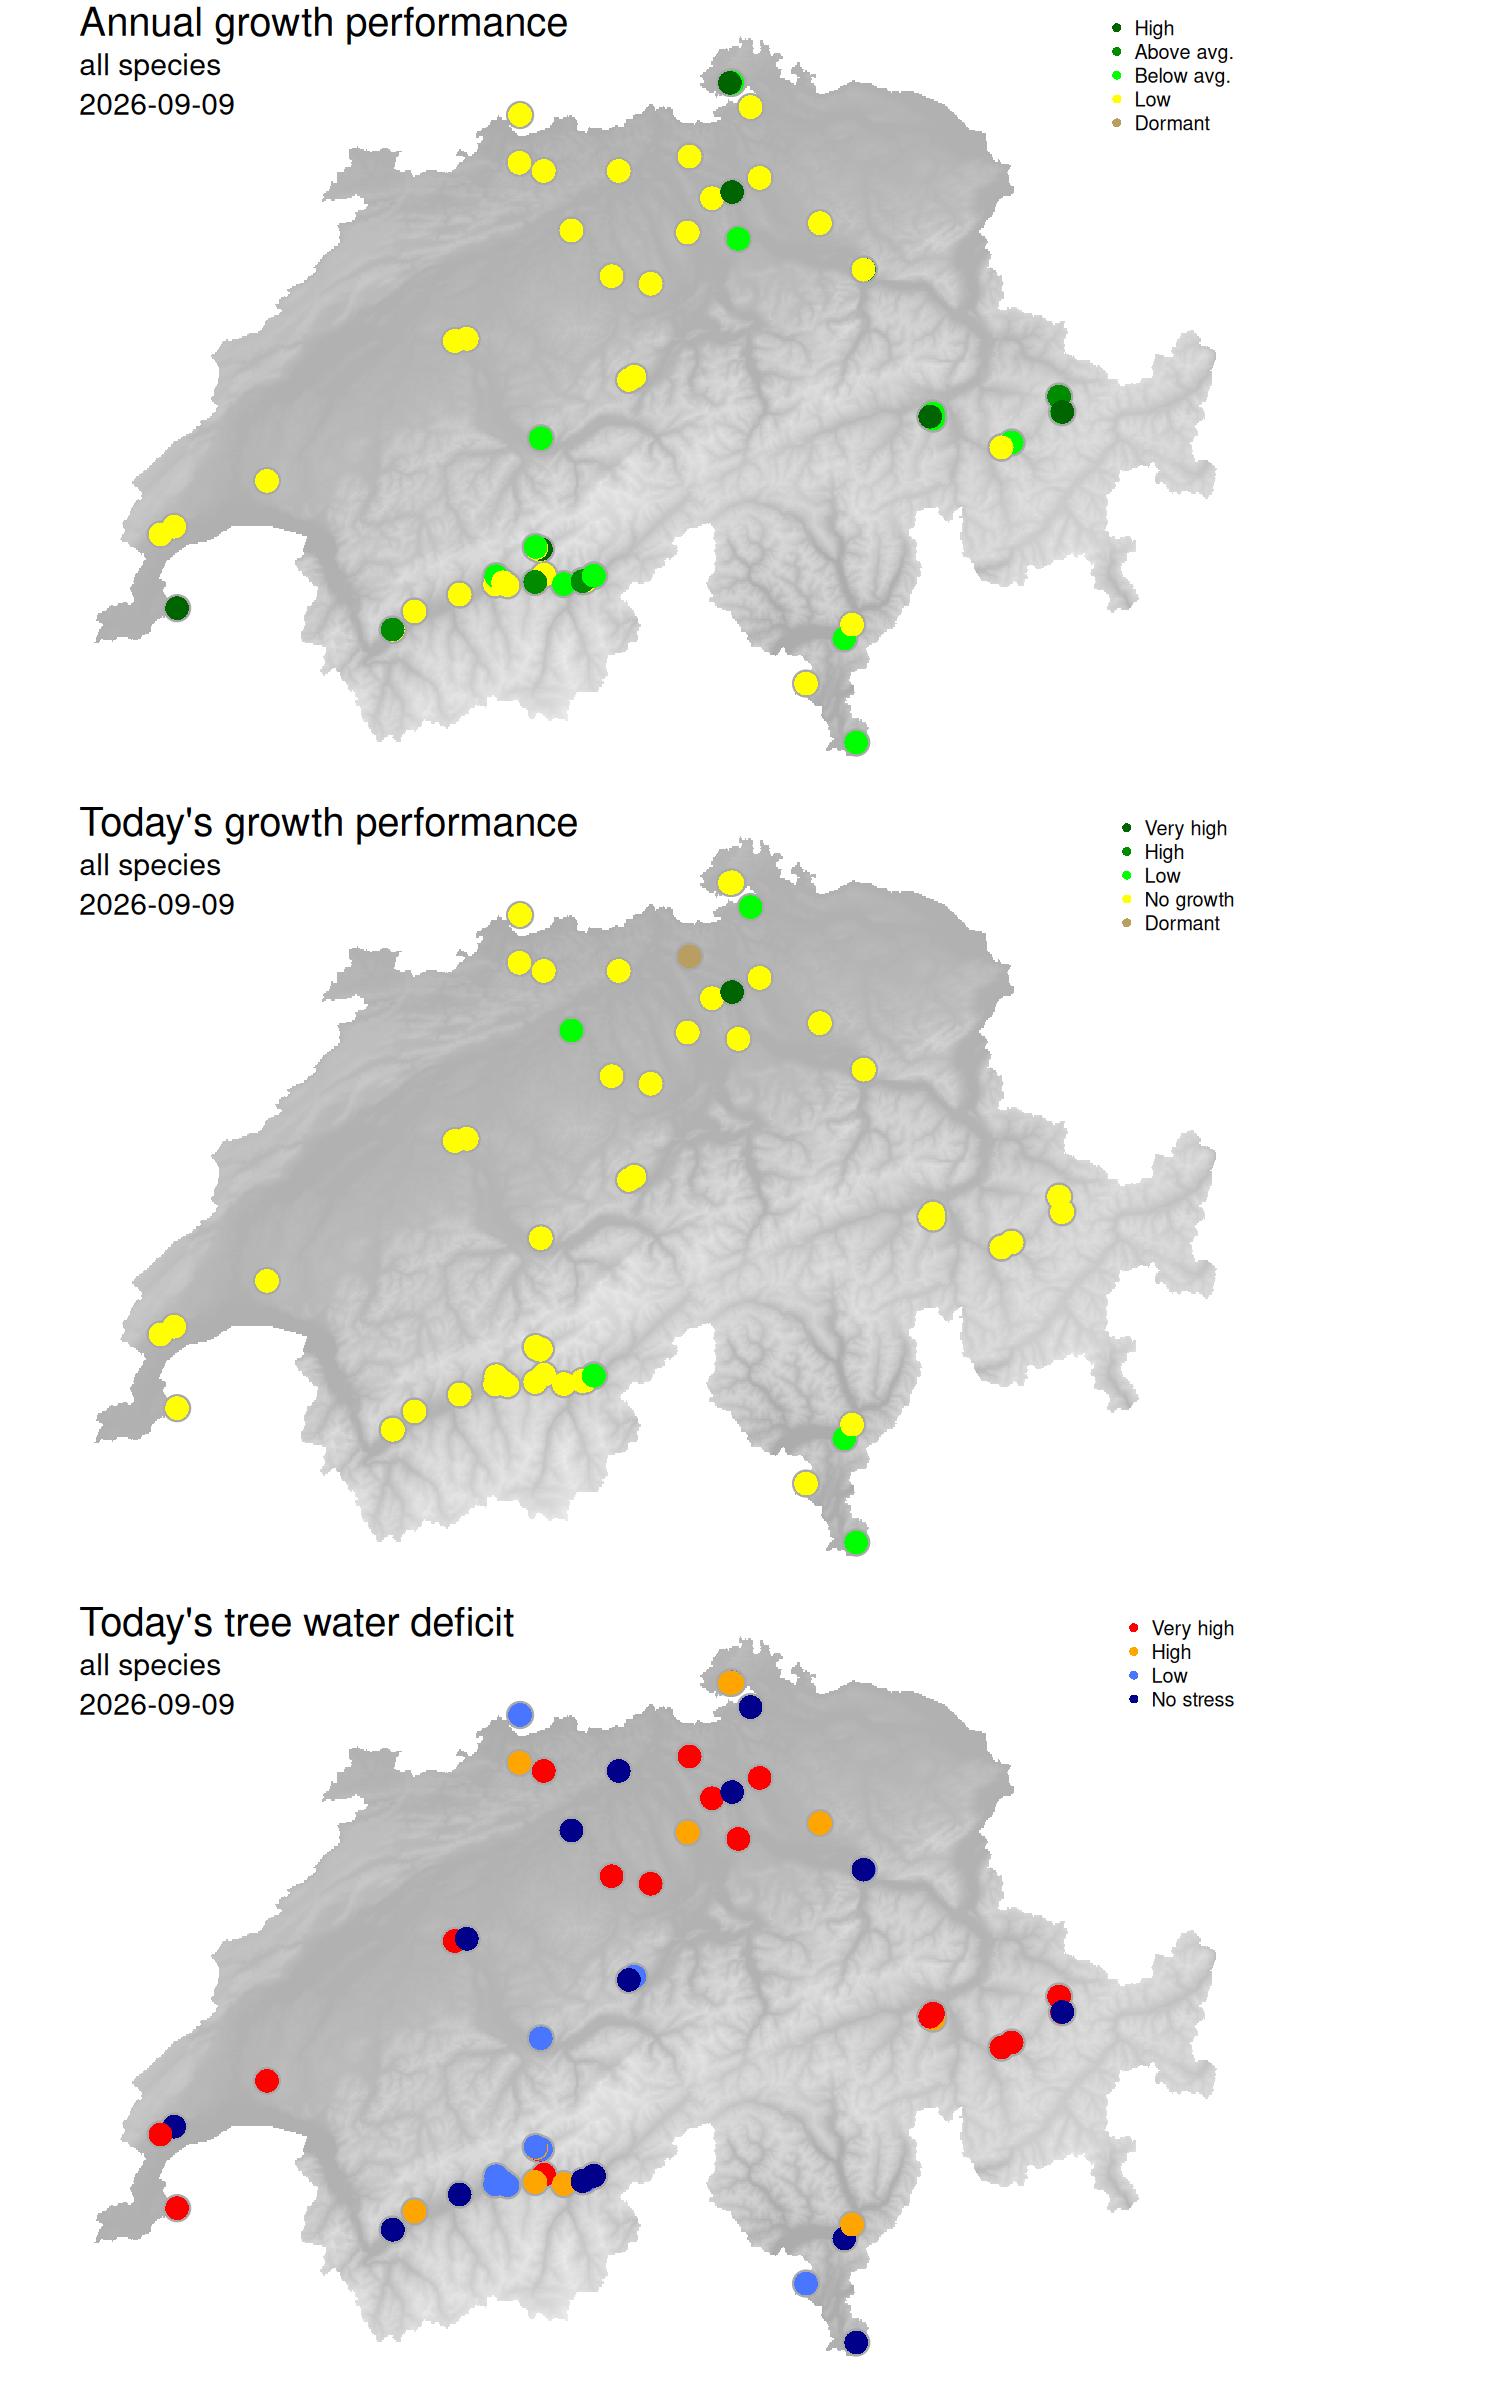
The upper map shows the annual growth performance relative to the average, historic data of a site. Data are categorized as ‘high’ growth (dark green), ‘above average’ growth (green), ‘below average’ growth (light green), and ‘poor’ growth (yellow). Sites with mainly dormant trees are shown in brown.
The middle map shows the actual daily growth performance of a site. Data are categorized as ‘very high’ growth (dark green), ‘high’ growth (green), ‘low’ growth (light green), and ‘no growth’ (yellow). Sites with mainly dormant trees are shown in brown.
The lower map shows the actual normalized tree water deficit (drought stress) of all trees at a site. Data are shown in the categories of small water deficit ‘no stress’ (dark blue), ‘low’ water deficit (light blue), ‘high’ water deficit (orange) and ‘very high’ water deficit (red). When the temperature drops below zero, this can trigger what is known as frost shrinkage of the stem, indicated with a star.
Species-specific maps can be found below.
Data source: TreeNet, automatic data analysis with filtered data set.